

An account of data entry inconsistencies and their impact on positron emission tomography quantification
- PMID: 30212971
- PMCID: PMC6156030
- DOI: 10.1097/MD.0000000000012312
An account of data entry inconsistencies and their impact on positron emission tomography quantification
Abstract
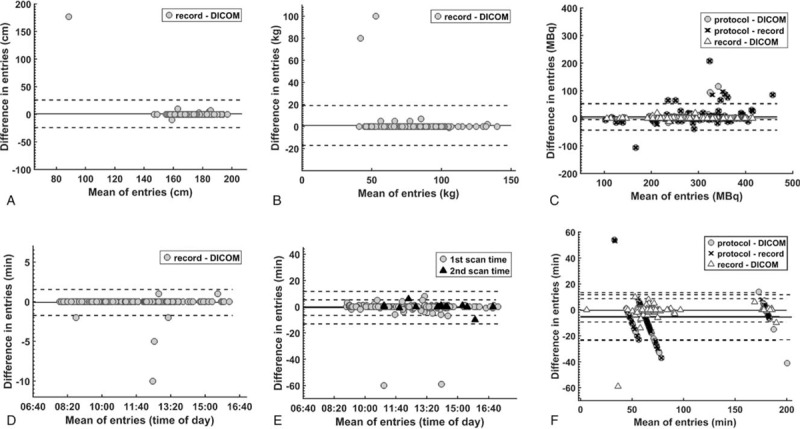
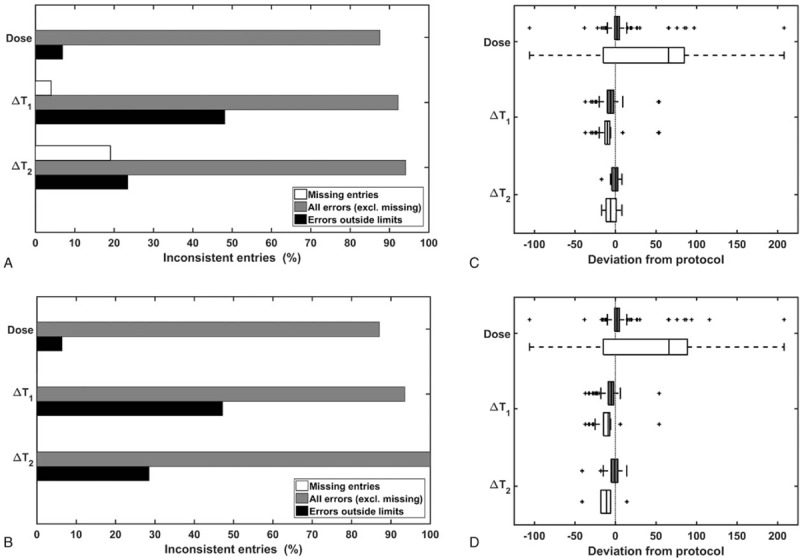
Reproducibility is essential to clinical application of positron emission tomography (PET) quantification. Human lapses in data registration and protocol compliance are pervasive sources of intrasite quantification variability. Although rarely assessed or reported, these lapses are ultimately a limitation to harmonization in multicenter clinical trials. A comprehensive account of their possible extent is relayed here.This is a retrospective audit of errors in manual registration of study parameters and in protocol adherence across a sample of in-center research projects over one year (201 patients, 222 PET/CT scans). Discrepancies in patient height and weight; tracer type; dose; injection; and scan times were listed. Correspondent variances in standardized uptake values (SUVs) normalized by body weight, SUV (BW), and body surface area, SUV (BSA), were assessed.Manual misregistrations totalled 41.8%. These were mainly small, but with a few large deviations, and most significant in weight (range: -1-100 kg) and dose (-19 to 12 MBq). Errors were more frequent and generally larger in non-routine studies. This also applied to protocol compliance. A 50.7% noncompliance was found with significant deviations in dose (-106 to 208 MBq) and especially in early scan uptake times (-37 to 54 min). Although misregistrations did not overall translate into significant SUV variability, noncompliance did. These errors contributed a factor 0.02 to 1.45 and 0.71 to 3.09 SUV (BW) change, respectively. SUV (BSA) saw a significant 21% to 22% decrease with mistyped height and weight.Inconsistency was frequent but less prominent in data entry than in protocol compliance. As both caused some substantial SUV variances, intra-site assessments and data checking are required for clinical trials.
Conflict of interest statement
The author(s) report no conflicts of interest.
Figures


References
-
- Thie JA. Understanding the standardized uptake value, its methods, and implications for usage. J Nucl Med 2004;45:1431–4. - PubMed
-
- Shankar LK, Hoffman JM, Bacharach S, et al. Consensus recommendations for the use of 18F-FDG PET as an indicator of therapeutic response in patients in National Cancer Institute trials. J Nucl Med 2006;47:1059–66. - PubMed
-
- Boellaard R. Standards for PET image acquisition and quantitative data analysis. J Nucl Med 2009;50:11S–20S. - PubMed
-
- Adams MC, Turkington TG, Wilson JM, et al. A systematic review of the factors affecting accuracy of SUV measurements. Am J Roentgenol 2010;195:310–20. - PubMed
MeSH terms
Substances
LinkOut - more resources
Full Text Sources
Other Literature Sources
Medical
Research Materials
