

Quantification of Blood Velocity with 4D Digital Subtraction Angiography Using the Shifted Least-Squares Method
- PMID: 30213811
- PMCID: PMC6177311
- DOI: 10.3174/ajnr.A5793
Quantification of Blood Velocity with 4D Digital Subtraction Angiography Using the Shifted Least-Squares Method
Abstract
Background and purpose: 4D-DSA provides time-resolved 3D-DSA volumes with high temporal and spatial resolutions. The purpose of this study is to investigate a shifted least squares method to estimate the blood velocity from the 4D DSA images. Quantitative validation was performed using a flow phantom with an ultrasonic flow probe as ground truth. Quantification of blood velocity in human internal carotid arteries was compared with measurements generated from 3D phase-contrast MR imaging.
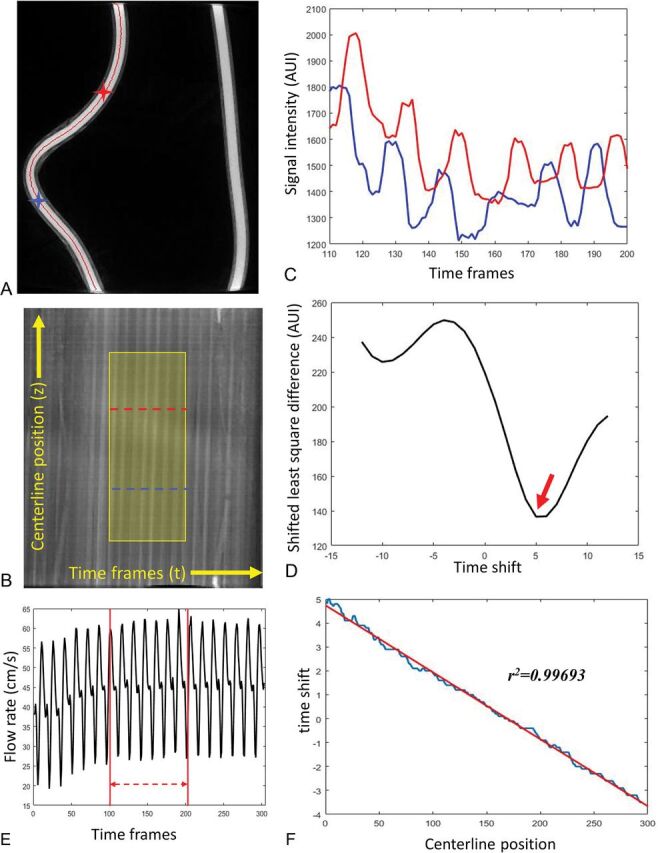
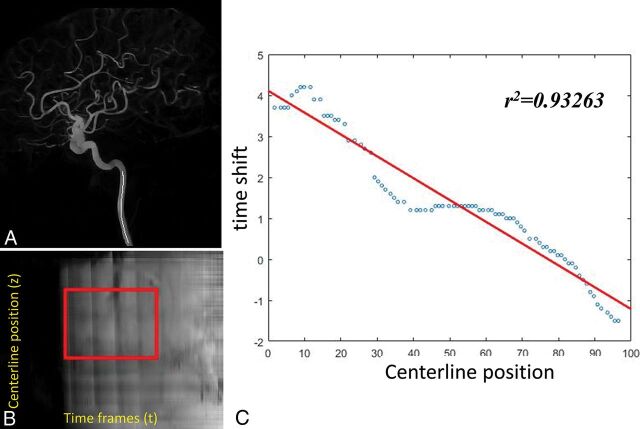
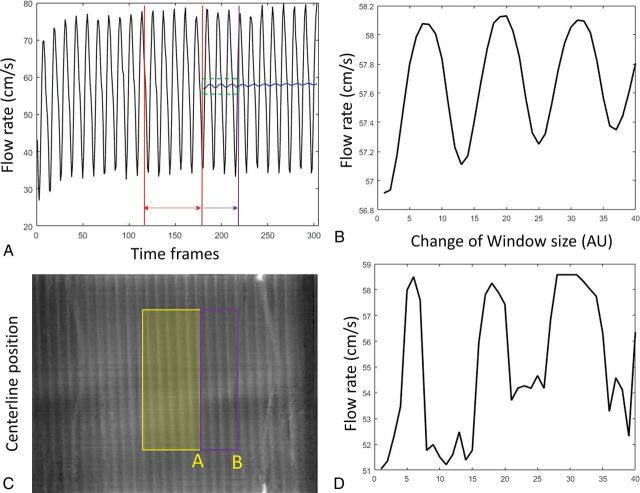
Materials and methods: The centerlines of selected vascular segments and the time concentration curves of each voxel along the centerlines were determined from the 4D-DSA dataset. The temporal shift required to achieve a minimum difference between any point and other points along the centerline of a segment was calculated. The temporal shift as a function of centerline point position was fit to a straight line to generate the velocity. The proposed shifted least-squares method was first validated using a flow phantom study. Blood velocities were also estimated in the 14 ICAs of human subjects who had both 4D-DSA and phase-contrast MR imaging studies. Linear regression and correlation analysis were performed on both the phantom study and clinical study, respectively.
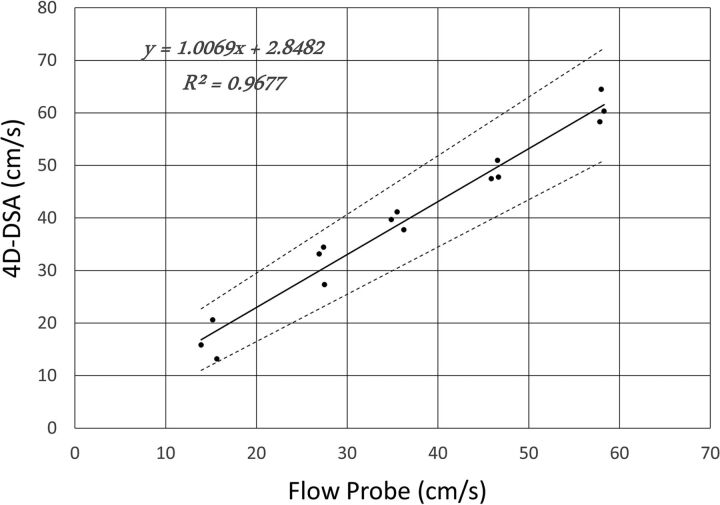
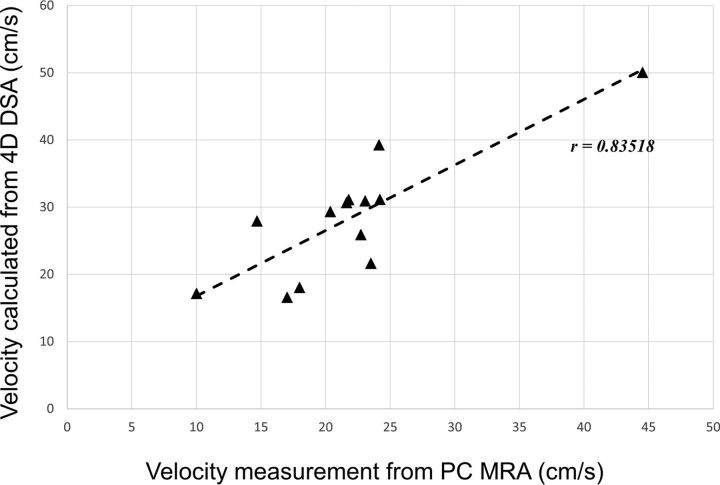
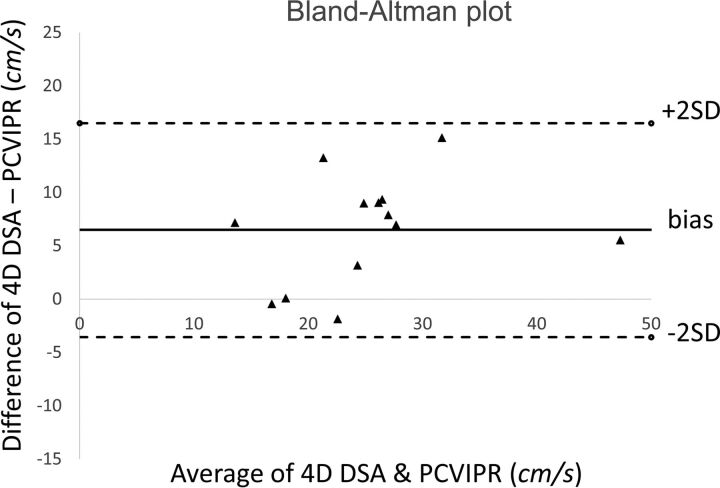
Results: Mean velocities of the flow phantom calculated from 4D-DSA matched very well with ultrasonic flow probe measurements with 11% relative root mean square error. Mean blood velocities of ICAs calculated from 4D-DSA correlated well with phase-contrast MR imaging measurements with Pearson correlation coefficient r = 0.835.
Conclusions: The availability of 4D-DSA provides the opportunity to use the shifted least-squares method to estimate velocity in vessels within a 3D volume.
© 2018 by American Journal of Neuroradiology.
Figures
Similar articles
-
Quantification of internal carotid artery flow with digital subtraction angiography: validation of an optical flow approach with Doppler ultrasound.AJNR Am J Neuroradiol. 2014 Jan;35(1):156-63. doi: 10.3174/ajnr.A3662. Epub 2013 Aug 8. AJNR Am J Neuroradiol. 2014. PMID: 23928145 Free PMC article.
-
Peak velocity measurements in tortuous arteries with phase contrast magnetic resonance imaging: the effect of multidirectional velocity encoding.Invest Radiol. 2014 Apr;49(4):189-94. doi: 10.1097/RLI.0000000000000013. Invest Radiol. 2014. PMID: 24300842
-
Quantitative and Qualitative Comparison of 4D-DSA with 3D-DSA Using Computational Fluid Dynamics Simulations in Cerebral Aneurysms.AJNR Am J Neuroradiol. 2019 Sep;40(9):1505-1510. doi: 10.3174/ajnr.A6172. AJNR Am J Neuroradiol. 2019. PMID: 31467234 Free PMC article.
-
4D-DSA: Development and Current Neurovascular Applications.AJNR Am J Neuroradiol. 2021 Jan;42(2):214-220. doi: 10.3174/ajnr.A6860. Epub 2020 Nov 26. AJNR Am J Neuroradiol. 2021. PMID: 33243899 Free PMC article. Review.
-
MR angiography with three-dimensional MR digital subtraction angiography.Top Magn Reson Imaging. 1996 Dec;8(6):366-88. Top Magn Reson Imaging. 1996. PMID: 9402678 Review.
Cited by
-
Experimental study using phantom models of cerebral aneurysms and 4D-DSA to measure blood flow on 3D-color-coded images.Technol Health Care. 2024;32(5):3217-3230. doi: 10.3233/THC-231906. Technol Health Care. 2024. PMID: 38968064 Free PMC article.
-
Motion-compensation approach for quantitative digital subtraction angiography and its effect on in-vivo blood velocity measurement.J Med Imaging (Bellingham). 2024 Jan;11(1):013501. doi: 10.1117/1.JMI.11.1.013501. Epub 2024 Jan 4. J Med Imaging (Bellingham). 2024. PMID: 38188936 Free PMC article.
-
Quantitative evaluation of the effects of flow diverter treatment on aneurysm hemodynamics using time-resolved rotational angiography.Interv Neuroradiol. 2024 May 7:15910199241252519. doi: 10.1177/15910199241252519. Online ahead of print. Interv Neuroradiol. 2024. PMID: 38715369 Free PMC article.
-
Spatiotemporal frequency domain analysis for blood velocity measurement during embolization procedures.Med Phys. 2024 Mar;51(3):1726-1737. doi: 10.1002/mp.16715. Epub 2023 Sep 4. Med Phys. 2024. PMID: 37665770 Free PMC article.
-
Flat-panel conebeam CT in the clinic: history and current state.J Med Imaging (Bellingham). 2021 Sep;8(5):052115. doi: 10.1117/1.JMI.8.5.052115. Epub 2021 Oct 28. J Med Imaging (Bellingham). 2021. PMID: 34722795 Free PMC article.
References
-
- Turski P, Levine R, Turnipseed W, et al. . MR angiography flow analysis: neurovascular applications. Magn Reson Imaging Clin N Am 1995;3:541–55 - PubMed
Publication types
MeSH terms
Grants and funding
LinkOut - more resources
Full Text Sources
Other Literature Sources