. 2018 Nov;8(11):1404-1421.
doi: 10.1158/2159-8290.CD-18-0474. Epub 2018 Sep 13.

Prediction of DNA Repair Inhibitor Response in Short-Term Patient-Derived Ovarian Cancer Organoids

Affiliations

Prediction of DNA Repair Inhibitor Response in Short-Term Patient-Derived Ovarian Cancer Organoids

Sarah J Hill et al. Cancer Discov. 2018 Nov.

Abstract

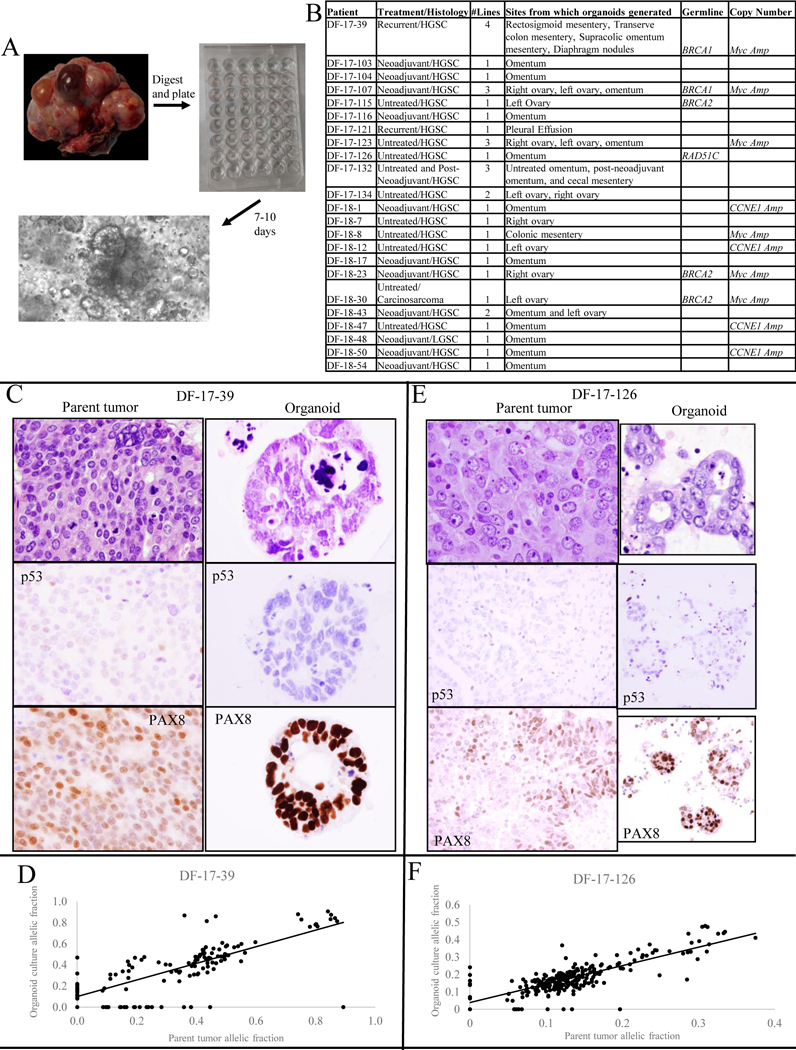
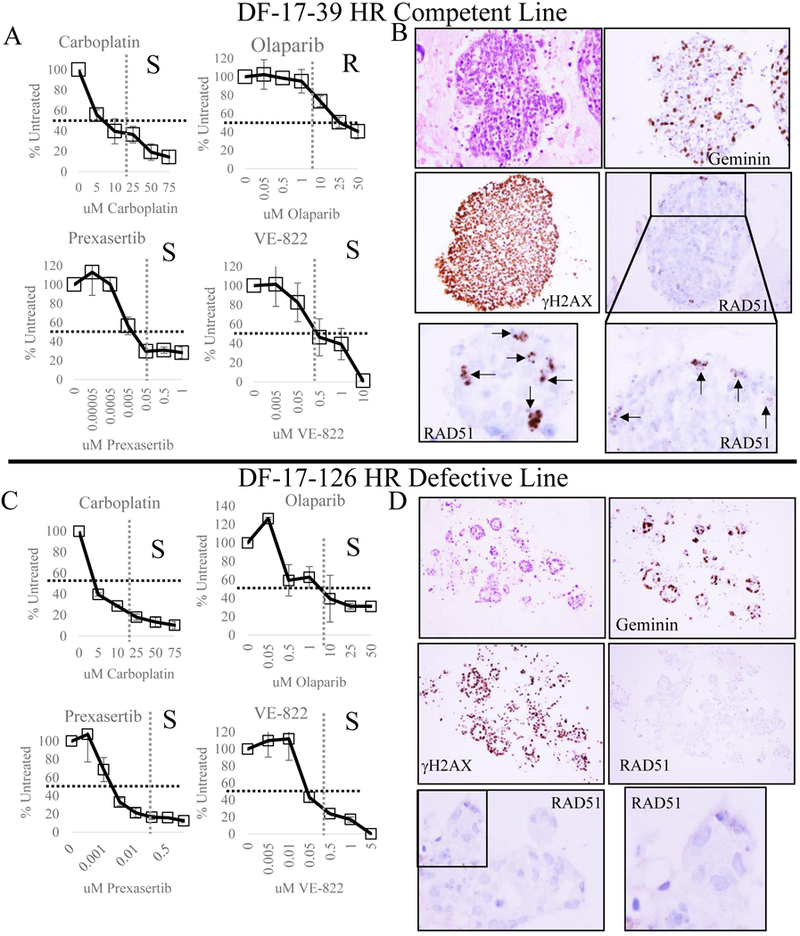
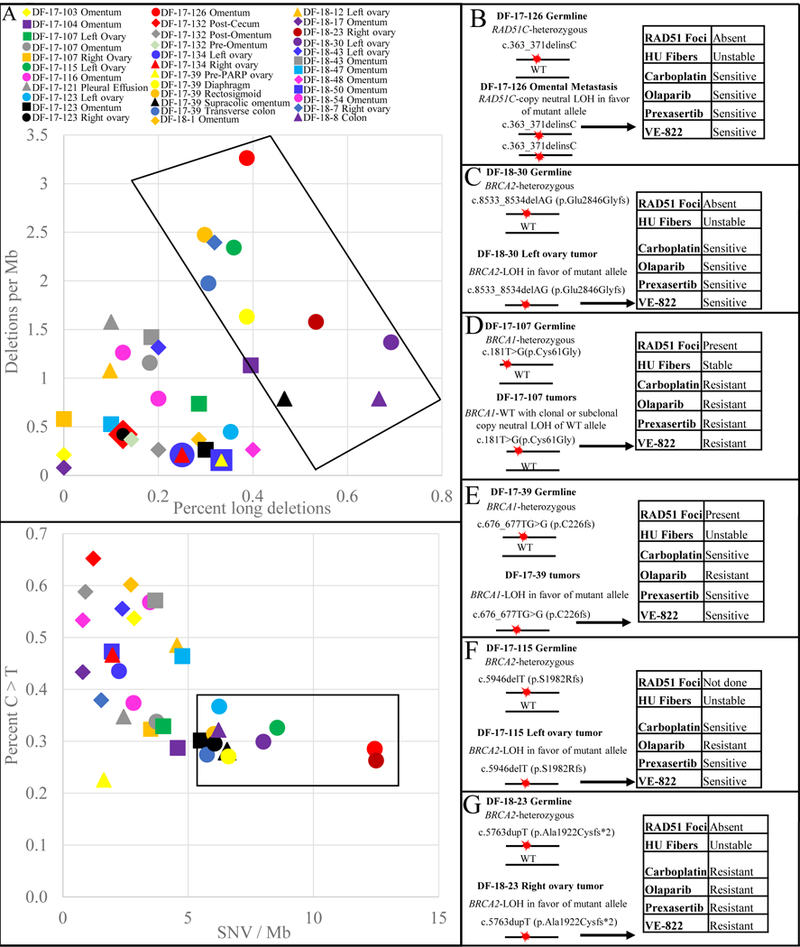
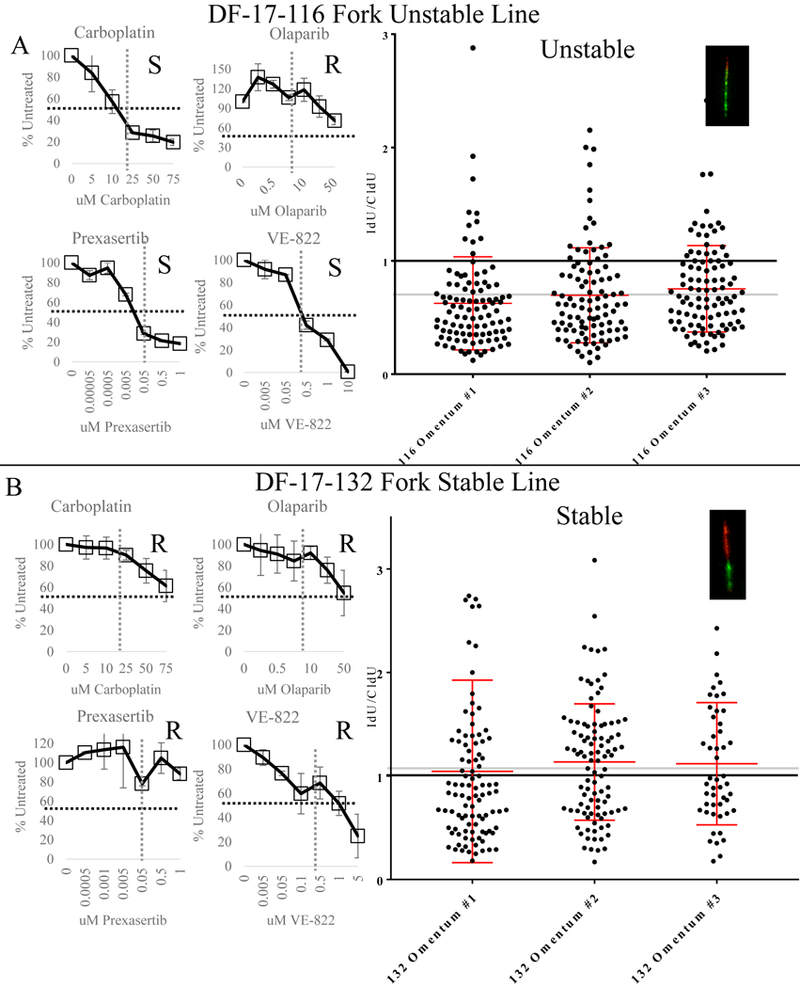
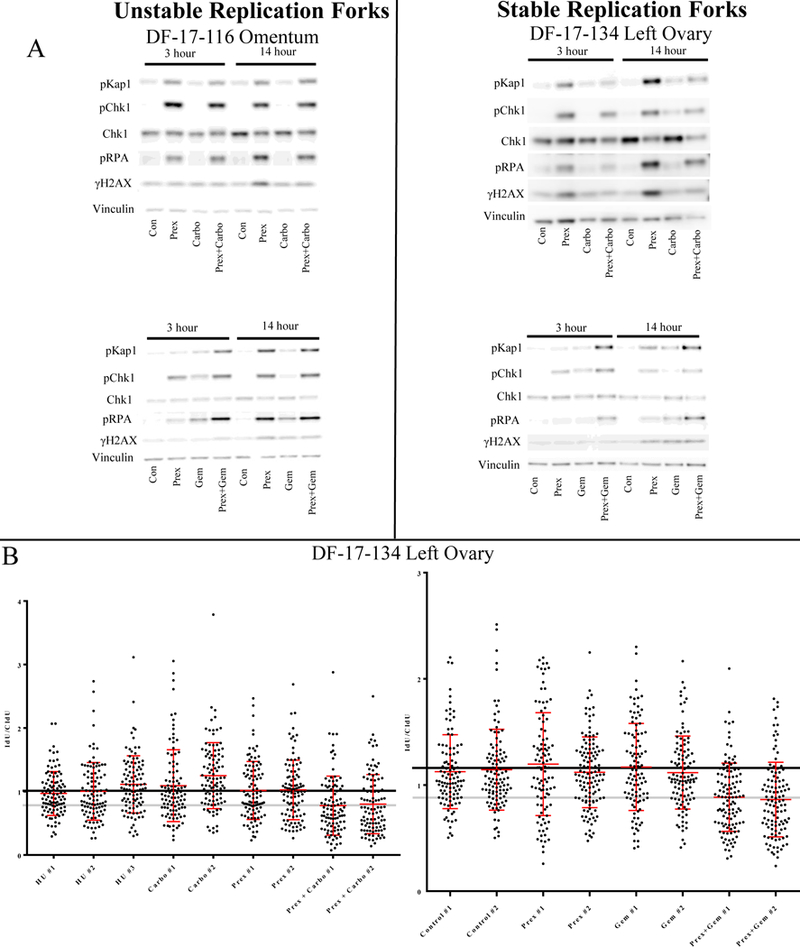
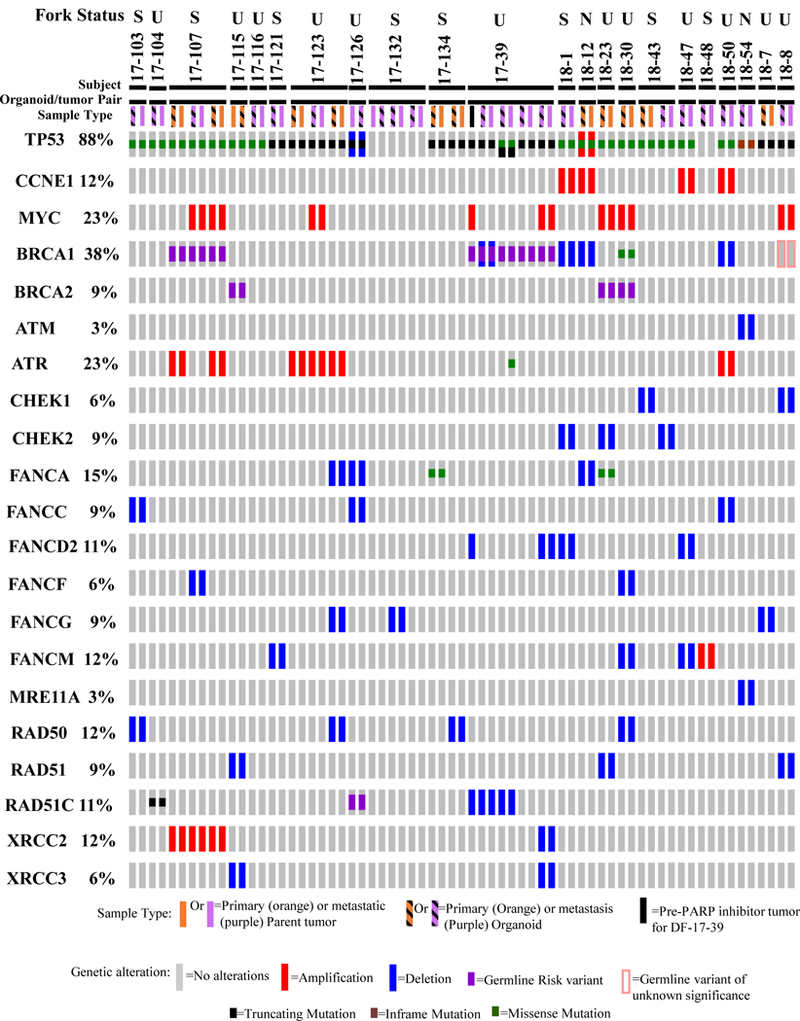
Based on genomic analysis, 50% of high-grade serous ovarian cancers (HGSC) are predicted to have DNA repair defects. Whether this substantial subset of HGSCs actually have functional repair defects remains unknown. Here, we devise a platform for functional profiling of DNA repair in short-term patient-derived HGSC organoids. We tested 33 organoid cultures derived from 22 patients with HGSC for defects in homologous recombination (HR) and replication fork protection. Regardless of DNA repair gene mutational status, a functional defect in HR in the organoids correlated with PARP inhibitor sensitivity. A functional defect in replication fork protection correlated with carboplatin and CHK1 and ATR inhibitor sensitivity. Our results indicate that a combination of genomic analysis and functional testing of organoids allows for the identification of targetable DNA damage repair defects. Larger numbers of patient-derived organoids must be analyzed to determine whether these assays can reproducibly predict patient response in the clinic.Significance: Patient-derived ovarian tumor organoids grow rapidly and match the tumors from which they are derived, both genetically and functionally. These organoids can be used for DNA repair profiling and therapeutic sensitivity testing and provide a rapid means of assessing targetable defects in the parent tumor, offering more suitable treatment options. Cancer Discov; 8(11); 1404-21. ©2018 AACR. This article is highlighted in the In This Issue feature, p. 1333.


Conflict of interest statement

For competing financial interests, two authors reported the following which is what Cancer Discovery reported for them: G.I. Shapiro reports receiving commercial research grants from Lilly, Sierra Oncology, and Merck/EMD Serono and is a consultant/advisory board member for Lilly, Sierra Oncology, Merck/EMD Serono, and Pfizer. A.D. D’Andrea reports receiving commercial research grants from Eli Lilly & Company, Sierra Oncology, and EMD Serono and is a consultant/advisory board member for Eli Lilly & Company, Sierra Oncology, and EMD Serono. No potential conflicts of interest were disclosed by the other authors.

Figures

Figure 1.
Figure 1.. HGSC organoids morphologically and molecularly mimic the parent tumors from which they were derived.
A) Illustration of organoid generation from tumor, to plating in Matrigel, to organoid growth (Brightfield image). B) Table of patient, treatment status at time of surgery where parent tumor was obtained, histology, number of lines established, tumor sites obtained for organoid generation, and known germline and copy number status. C and E) Histologic comparison of two separate parent tumors (left) to the matched organoid cultures (right) by morphology (H&E, top panel), and p53 and PAX8 expression (bottom two panels) paired with molecular comparison D and F) by analysis of mutant allele fractions of somatic mutations in the organoid versus parent tumors. Panels C and D compare parent tumor and organoids generated from a rectosigmoid colon metastasis from a recurrent HGSC. Panels E and F compare organoids and parent tumor from an omental metastasis of an untreated HGSC.
Figure 2.
Figure 2.. Most HGSC organoids are HR proficient and lack therapeutic sensitivity to agents targeting HR defects.
A) Sensitivity dose curves of organoid cultures from one tumor site (transverse colon mesentery) from a BRCA1 mutation carrier (DF-17–39) with acquired PARPi resistance to carboplatin, olaparib, prexasertib, and VE-822. A dashed black line marks 50% untreated and a dashed grey line marks our sensitivity standard for this assay for all organoid cultures. S= sensitive and R=resistant. B) RAD51 focus formation 4 hours post 10 Gy in DF-17–39 transverse colon mesentery metastasis organoids. The top left panel is an H&E stain of the organoids, the top right panel shows cells in S phase marked by Geminin, the middle left panel marks DNA damage with γH2AX, the middle right panel shows the presence of RAD51 foci, and the bottom panels are magnified areas of the RAD51 stain. C) Sensitivity dose curves of organoid cultures generated from an omental metastasis from an untreated HGSC patient, DF-17–126, to carboplatin, olaparib, prexasertib, and VE-822. The dose curves are configured as described for panel A. D) RAD51 focus formation 4 hours post 10 Gy in DF-17–126. The top left panel is an H&E stain, the top right panel shows cells in S phase marked by Geminin, the middle left panel marks DNA damage with γH2AX, the middle right panel shows a lack of RAD51 foci, and the bottom panels are magnified areas of the Rad51 stain.
Figure 3.
Figure 3.. Mutational signatures and repair gene mutation status in tumors and organoid cultures.
A) WES data from parent tumors and organoid cultures were analyzed for numbers of SNVs and long deletions to assess for HRD mutational signatures. Deletions per megabase (Mb) compared to fraction of deletions 5-bp or longer (top panel) and fraction of C to T substitutions (C > T) and SNVs per Mb (bottom panel) for each parent tumor and organoid culture are shown for all 34 patients. The organoids and parent tumors harboring components of the HRD mutational signature have a black box enclosing them in each panel. A color code for each patient is at the top of the panels. B-G) Germline and tumor allele mutation status and repair assay status for B) RAD51C/FANCO for DF-17–126. C) BRCA2 for patient DF-18–30. D) BRCA1 for patient DF-17–107. E) BRCA1 for patient DF-17–39. F) BRCA2 for patient DF-17–115. G) BRCA2 for patient DF-18–23.
Figure 4.
Figure 4.. Replication fork stability correlates with carboplatin sensitivity in HGSC organoids.
A) Sensitivity dose curves (left panel) and fiber assay results (right panel) of omental metastasis organoid cultures from a sporadic HGSC patient (DF-17–116). Dose curves for carboplatin, olaparib, prexasertib, and VE-822 show sensitivity compared to the untreated control. S stands for sensitive and R stands for resistant. A dashed black line marks 50% untreated and a dashed grey line marks the sensitivity cutoff for all organoid cultures. On the right, the ratio of IdU to CldU in three biologic replicates is shown for DF-17–116 organoids treated with hydroxyurea. A black line marks a ratio of 1, and a grey line marks the average ratio for this line. At the top of the panel is a representative fiber from this line denoting an unstable fork. B) Sensitivity dose curves (left panel) and fiber assay results (right panel) of organoid cultures from a sporadic HGSC patient post-neoadjuvant chemotherapy (DF-17–132). Dose curves for carboplatin, olaparib, prexasertib, and VE-822 show sensitivity compared to the untreated control. The graphs are designed as described in A. On the right, the ratio of IdU to CldU in three biologic replicates is shown for organoids treated with hydroxyurea. A black line marks a ratio of 1, and a grey line marks the average ratio for this line. At the top of the panel is a representative fiber from this line denoting a stable fork.
Figure 5.
Figure 5.. CHK1 inhibitors cause DNA damage in both sporadic and familial HGSCs and confer fork instability in the setting of carboplatin or gemcitabine treatment.
A) Western blots examining DNA damage in one replication fork unstable and one fork stable organoid line. Lines were treated with control (con) media with no drug or media containing in the top panels the CHK1 inhibitor Prexasertib (Prex) alone, Carboplatin (Carbo) alone, or Prexasertib+Carboplatin for either 3 hours or 14 hours; or in the bottom panels with media containing no drug (con), Prexasertib alone, Gemcitabine (Gem) alone, or Prexasertib+Gemcitabine for either 3 hours or 14 hours and then harvested for western analysis. DNA damage was queried by western blot for phosphorylated KAP1 (pKAP1), phosphorylated RPA (pRPA), and γH2AX. CHK1 expression and DNA damage induced phosphorylation are also shown. Vinculin is used as a loading control. B) Biologic replicates of the fiber assay for fork stability in a line with stable forks (DF-17–134 Left Ovary). In the left panel, the first three replicates show testing of the line using standard hydroxyurea (HU) alone. Next to the HU replicates are two replicates each of the line treated with carboplatin (carbo) alone, prexasertib (prex) alone, and a combination of prexasertib and carboplatin. In the panel on the right are shown two replicates each of the line treated with control media with no drug, prexasertib (prex) alone, gemcitabine (gem) alone, or prexasertib+gemcitabine. For the prex, carbo, prex+carbo, prex, gem, and prex+gem experiments, there is no HU in the media at any step, meaning that any fork instability observed is the result of the single drug or drug combination. A black line marks the average stable ratio, and a grey line marks the average of the prexasertib+carboplatin or prexasertib+gemcitabine biologic replicates.
Figure 6.
Figure 6.. Comparison of somatic mutations and copy number alterations to fork stability in parent tumor and organoid lines.
Somatic mutations and copy number alterations were identified in parent tumors and organoids. For driver mutations and alterations in DNA repair genes, there was high concordance of alterations, both between parent tumor and matched organoid, as well as between multiple tumors from the same patient. The full list of somatic alterations can be found in Table S3. Shown here are the most relevant DNA repair genes including TP53, BRCA1, and BRCA2, and the genes with numerous alterations across the dataset. The gene is listed on the left, followed by percentage of tumors or organoids in the dataset with an alteration in the gene, followed by the type of alteration in each sample. The samples are listed across the top with a sample and mutation key at the bottom of the figure. For comparison, the fork stability status of the tumor/organoids is at the top of the figure with the S standing for stable and the U standing for unstable overall. The exact order of the sample pairs from left to right is as follows: DF-17–103-Omentum, DF-17–104-Omentum, DF-17–107-Left ovary, DF-17–107-Omentum DF-17–107-Right ovary, DF-17–115-Left ovary, DF-17–116-Omentum, DF-17–121-Pleural effusion, DF-17–123-Left ovary, DF-17–123-Omentum, DF-17–123-Right ovary, DF-17–126-Omentum, DF-17–132-Post-neoadjuvant cecal mesentery, DF-17–132-Post-neoadjuvant omentum, DF-17–132-Untreated omentum, DF-17–134-Left ovary, DF-17–134-Right ovary, DF-17–39-Ovary prior to PARPi treatment, DF-17–39-Diaphragm, DF-17–39-Rectosigmoid mesentery, DF-17–39-Supracolic omentum, DF-17–39-Transverse colon, DF-18–1-omentum, DF-18–12 Left Ovary, DF-18–23 Right Ovary, DF-18–30 Left Ovary, DF-18–43 Left Ovary, DF-18–43 Omentum, DF-18–47 Omentum, DF-18–48 Omentum, DF-18–50 Omentum, DF-18–54 Omentum, DF-18–7 Right Ovary, DF-18–8 Colonic mesentery.

References

    1. Force USPST Grossman DC, Curry SJ Owens DK, Barry MJ Davidson KW, et al. Screening for Ovarian Cancer: US Preventive Services Task Force Recommendation Statement. JAMA 2018;319(6):588–94 doi 10.1001/jama.2017.21926. - DOI - PubMed
    1. Morphologic Ramalingam P., Immunophenotypic, and Molecular Features of Epithelial Ovarian Cancer. Oncology (Williston Park) 2016;30(2):166–76. - PubMed
    1. Narod S Can advanced-stage ovarian cancer be cured? Nat Rev Clin Oncol 2016;13(4):255–61 doi 10.1038/nrclinonc.2015.224. - DOI - PubMed
    1. Cancer Genome Atlas Research N. Integrated genomic analyses of ovarian carcinoma. Nature 2011;474(7353):609–15 doi 10.1038/nature10166. - DOI - PMC - PubMed
    1. Murai J Targeting DNA repair and replication stress in the treatment of ovarian cancer. Int J Clin Oncol 2017;22(4):619–28 doi 10.1007/s10147-017-1145-7. - DOI - PubMed

Publication types

MeSH terms