. 2018 Sep 10;11(9):dmm033704.
doi: 10.1242/dmm.033704.

Functional differences of short and long isoforms of spastin harboring missense mutation

Affiliations

Functional differences of short and long isoforms of spastin harboring missense mutation

Clément Plaud et al. Dis Model Mech. .

Abstract

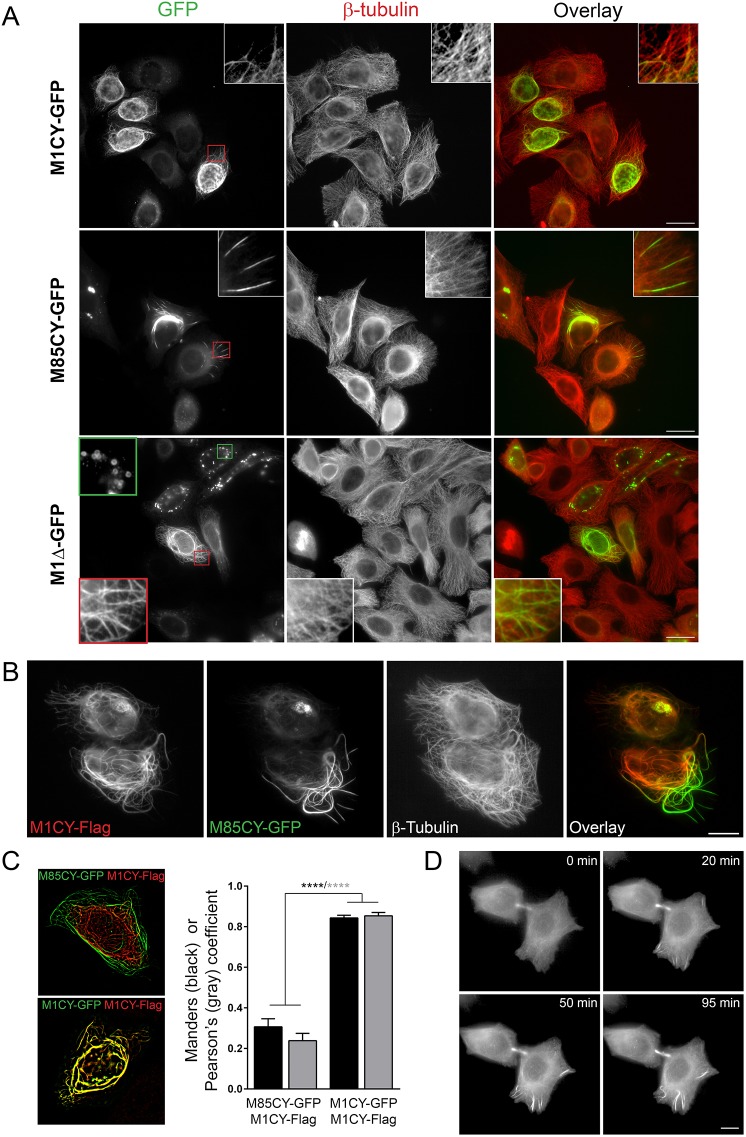
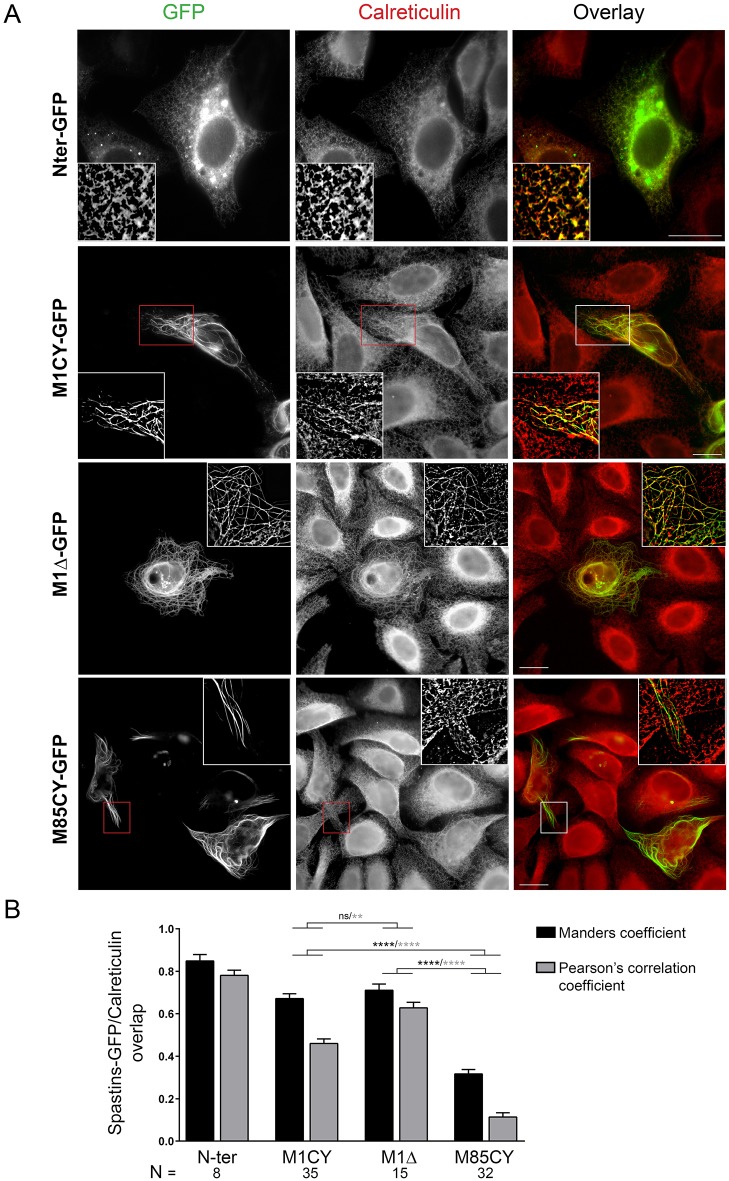
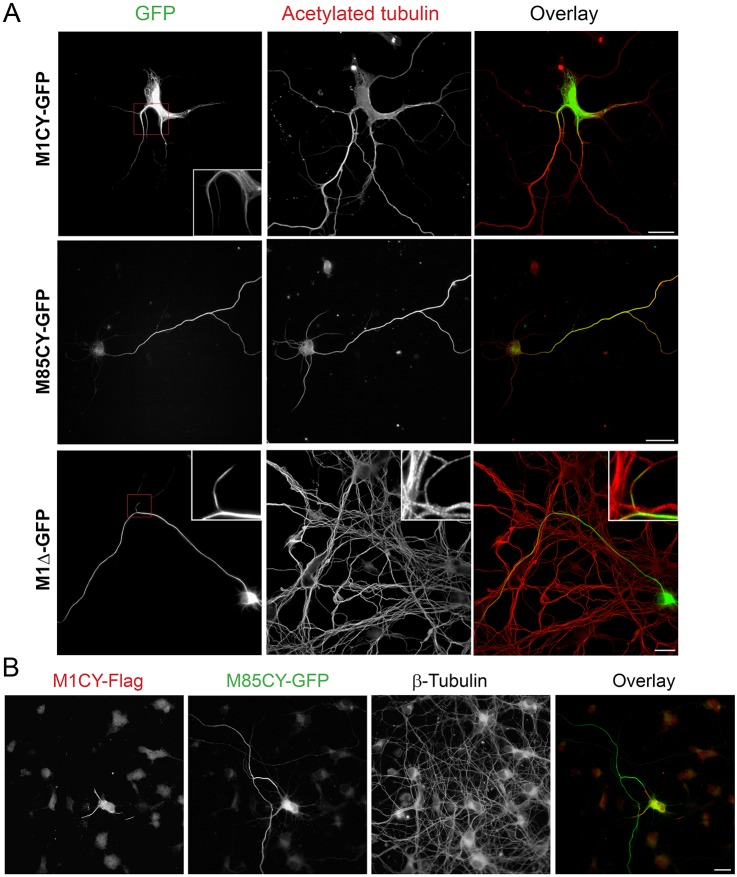
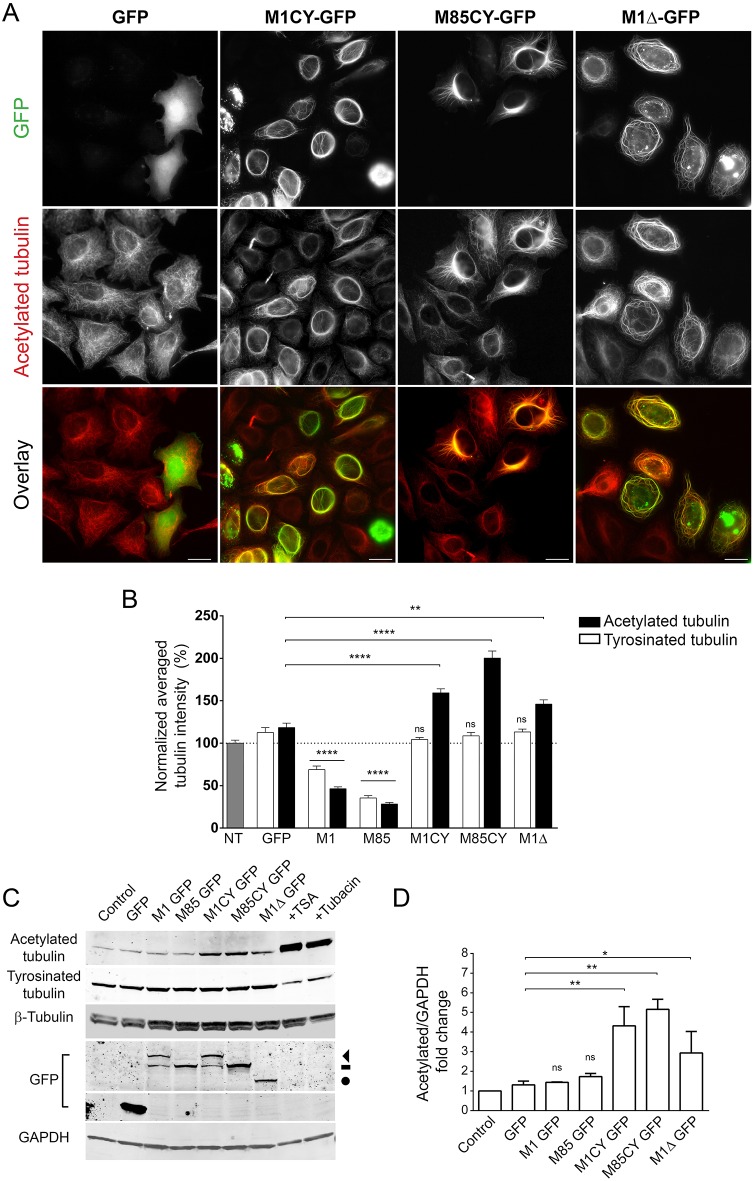
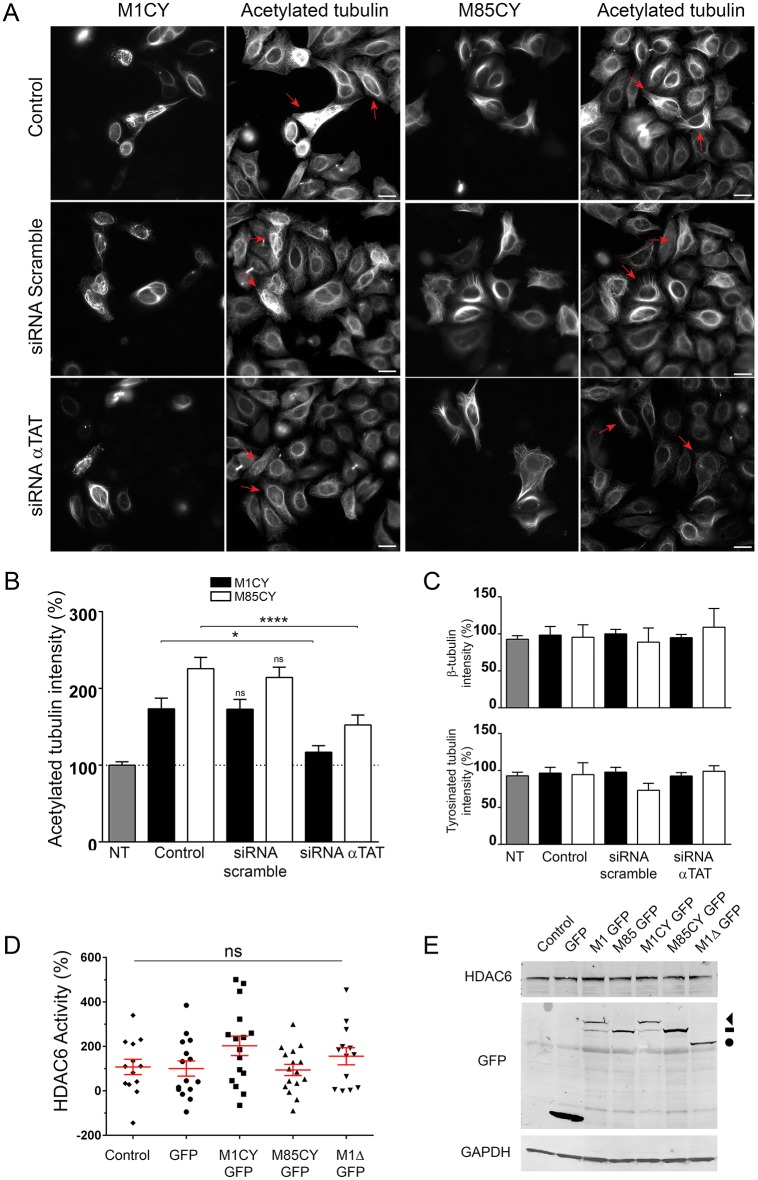
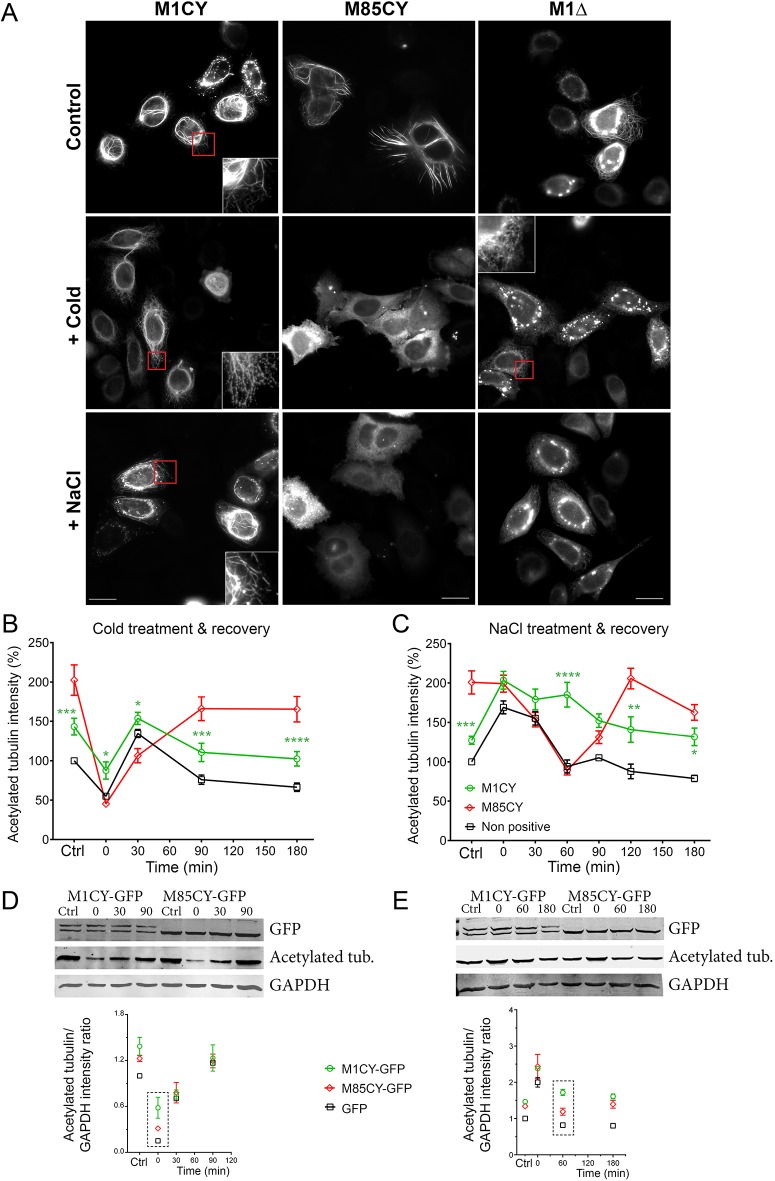
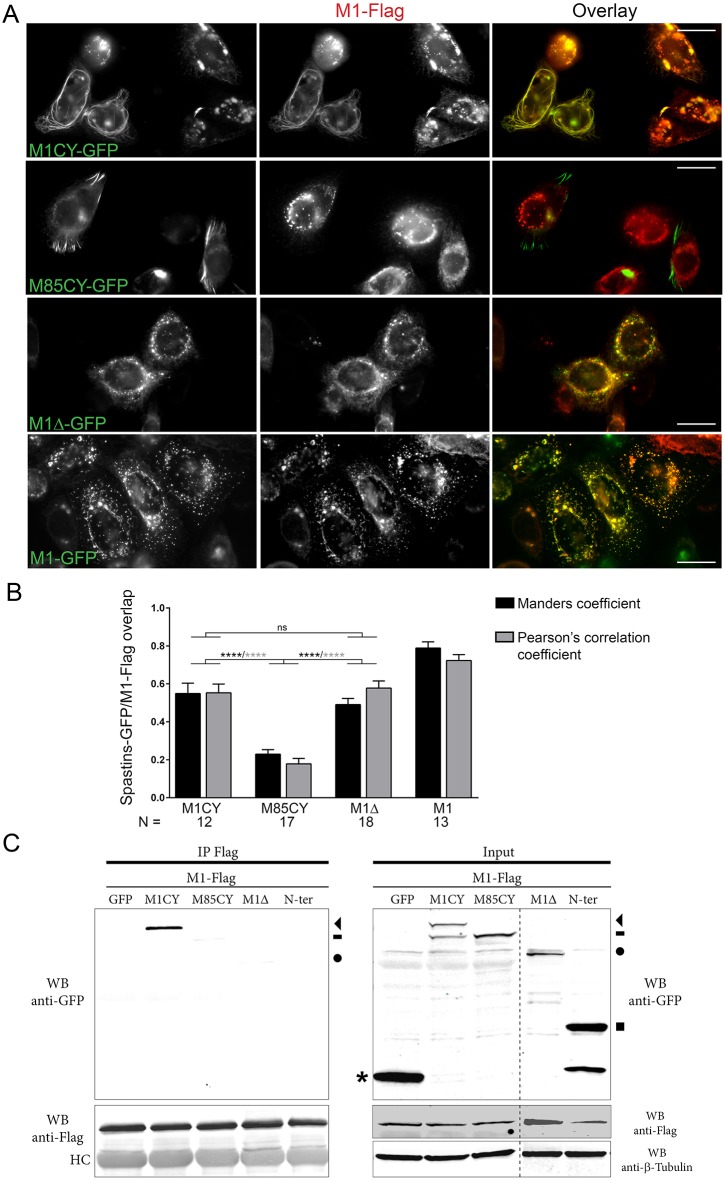
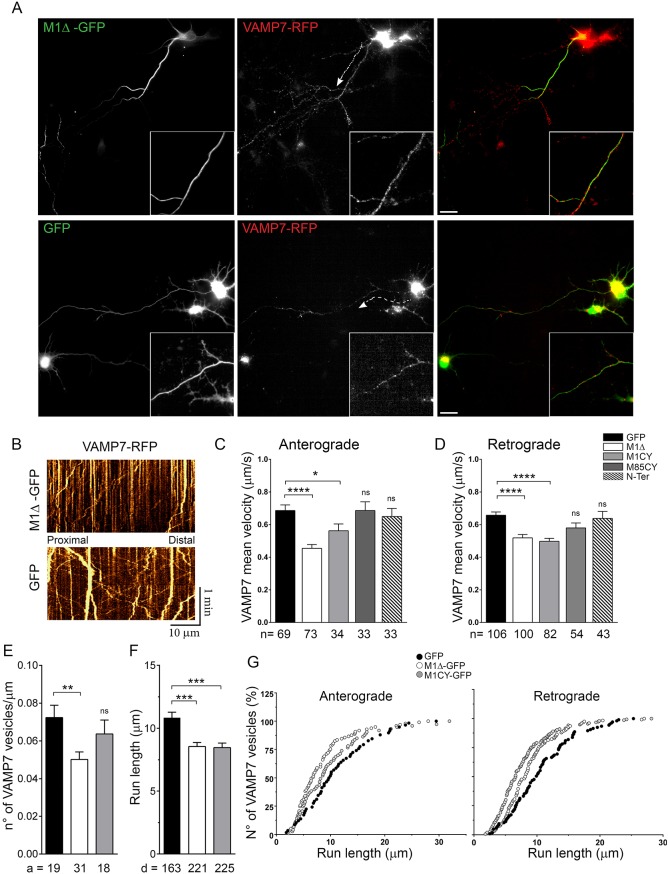
Mutations of the SPG4 (SPAST) gene encoding for spastin protein are the main causes of hereditary spastic paraplegia. Spastin binds to microtubules and severs them through the enzymatic activity of its AAA domain. Several missense mutations located in this domain lead to stable, nonsevering spastins that decorate a subset of microtubules, suggesting a possible negative gain-of-function mechanism for these mutants. Of the two main isoforms of spastin, only mutations of the long isoform, M1, are supposed to be involved in the onset of the pathology, leaving the role of the ubiquitously expressed shorter one, M87, not fully investigated and understood. Here, we show that two isoforms of spastin harboring the same missense mutation bind and bundle different subsets of microtubules in HeLa cells, and likely stabilize them by increasing the level of acetylated tubulin. However, only mutated M1 has the ability to interact with wild-type M1, and decorates a subset of perinuclear microtubules associated with the endoplasmic reticulum that display higher resistance to microtubule depolymerization and increased intracellular ionic strength, compared with those decorated by mutated M87. We further show that only mutated M1 decorates microtubules of proximal axons and dendrites, and strongly impairs axonal transport in cortical neurons through a mechanism likely independent of the microtubule-severing activity of this protein.

Keywords: HSP; Microtubules; Missense mutations; SPG4; Spastin.


Conflict of interest statement

Competing interestsThe authors declare no competing or financial interests.

Figures

Fig. 1.
Fig. 1.
Mutated spastins decorate different subset of MTs in HeLa cells. (A) HeLa cells expressing mutated GFP-tagged spastins were fixed and stained for β-tubulin. Magnifications of typical patterns are shown in the insets (red outline boxes). The green outlined inset in M1Δ-GFP shows typical empty ring-shaped structures observed with this construct. Scale bars: 20 µm. (B) HeLa cells that co-expressed M1CY-Flag and M85CY-GFP were fixed and stained for β-tubulin (not shown in the overlay). Scale bar: 10 µm. (C) Quantification of the overlap between GFP and Flag staining. Acquired images were processed as described in the Materials and Methods, and colocalization analysis between M85CY-GFP and M1CY-Flag (number of cells analyzed=11) was performed with ImageJ software. Colocalization coefficients between M1CY-GFP and M1CY-Flag are shown for comparison (number of cells analyzed=13). Data are shown as mean±s.e.m. Significance was determined by one-way ANOVA, Dunnett's post test. ****P<0.001. (D) HeLa cells transfected with the M85CY-GFP complementary DNA (cDNA) were subjected to live imaging at 37°C for 2 h. Images were acquired every 5 min. Scale bar: 10 µm.
Fig. 2.
Fig. 2.
WT and mutated M1 spastin co-localize with the ER. (A) HeLa cells expressing WT and mutated GFP-tagged spastin were fixed and stained with the ER marker calreticulin. Images in the insets were deconvoluted. Scale bars: 20 µm. (B) Quantification of the overlap between GFP and calreticulin staining. Acquired images were processed as described in the Materials and Methods, and analysis of colocalization between GFP-tagged spastin constructs and calreticulin was performed with ImageJ software. N, number of cells analyzed. Data are shown as mean±s.e.m. Significance was determined by one-way ANOVA, Dunnett's post test. **P<0.01; ****P<0.001; ns, not significant. Differences between N-Ter and the other mutants were always significant (data not shown).
Fig. 3.
Fig. 3.
Mutated M1, but not M85, decorates a subset of MTs in mouse cortical neurons. (A) Mouse cortical neurons at 4 DIV were transfected with GFP-tagged spastin mutants, fixed after 16 h and stained for acetylated tubulin. Magnifications show the MT pattern for M1CY and discontinuous MT decoration for M1Δ. (B) Mouse cortical neurons were transfected with M1CY-Flag and M85CY-GFP, fixed and stained for β-tubulin (not shown in the overlay). Scale bars: 20 µm.
Fig. 4.
Fig. 4.
Spastin mutants increase the level of acetylated tubulin in HeLa cells. (A) HeLa cells were transfected with GFP-tagged spastin mutants, fixed after 16 h and stained for acetylated tubulin. Scale bars: 20 µm. (B) Quantification of the average intensity of acetylated or tyrosinated tubulin in GFP-positive cells normalized to nontransfected cells (100%). The number of cells analyzed ranged between 40 and 200. (C) Representative western blot of HeLa cells transfected with the same GFP-tagged constructs as in panel B (note that the blot was stripped and re-probed for Fig. 5E). Increase of acetylated tubulin by treatment with the deacetylase inhibitors TSA or tubacin are shown for comparison. The arrowhead indicates M1CY-GFP, dash indicates M85CY-GFP and circle indicates M1Δ-GFP. (D) Quantification of the ratio between acetylated tubulin and GAPDH from three independent experiments. Data were normalized to untransfected cells (control). Data are shown as mean±s.e.m. Significance was determined by one-way ANOVA, Dunnett's post test. *P<0.05; **P<0.01; ****P<0.001; ns, not significant.
Fig. 5.
Fig. 5.
Spastin-induced tubulin acetylation depends on α-TAT activity. (A) HeLa cells were transfected for 24 h with siRNA against all isoforms of α-TAT or siRNA scramble, and co-transfected for 48 h with the same siRNA and GFP-tagged mutated spastin. Cells were fixed after 72-96 h of siRNA treatment and stained for acetylated tubulin. Red arrows indicate the effect of siRNA treatment on acetylated tubulin in mutated spastin-expressing cells. Scale bars: 20 µm. (B) Quantification of the average intensity of acetylated tubulin in the different experimental conditions. Data are normalized to untreated and nontransfected cells (100%). The number of cells analyzed ranged between 20 and 73. (C) Quantification of the average intensity of tyrosinated and β-tubulin in the same experimental conditions. (D) Quantification of HDAC6 catalytic activity. HeLa cells were transfected with GFP-tagged spastin mutants, GFP as control or mock transfected (control), and the catalytic activity of the enzyme HDAC6 was measured using a HDAC6 activity fluorometric assay (Biovision), according to the manufacturer's instructions. Data are the average of 13-16 replicates from four independent experiments and represented as a percentage of the control condition. (E) Representative immunoblot of HeLa cells transfected with spastin GFP-tagged constructs. The expression level of HDAC6 protein was not altered by spastin expression. The arrowhead indicates M1CY-GFP, dash indicates M85CY-GFP and circle indicates M1Δ-GFP. Blot from Fig. 2C was stripped and re-probed for the proteins shown; the same control blot is used in both figures. Data are shown as mean±s.e.m. Significance was determined by one-way ANOVA, Dunnett's post test. *P<0.05; ****P<0.001; ns, not significant. NT, not treated.
Fig. 6.
Fig. 6.
M1CY-positive bundles, but not M85CY-positive or M1Δ-positive bundles, are resistant to cold-shock or NaCl treatments. (A) HeLa cells expressing mutated spastin were subjected to cold shock for 30 min or incubated with 0.25 M NaCl for 30 min at 37°C and fixed. Scale bars: 20 µm. (B,C) HeLa cells expressing M1CY or M85CY were treated as described above and fixed after treatments (0 min), or at different time points (30, 60, 90, 120 and 180 min) after the recovery of temperature at 37°C (B) or the restoration of extracellular normal ionic strength (C). Untreated cells were taken as the control condition (Ctrl). HeLa cells were then stained for acetylated tubulin (see also Figs S5 and S7), and the average intensity of staining was measured in spastin-positive or nontransfected cells (nonpositive) and plotted over time. Values were normalized to untransfected cells before treatments. The number of cells analyzed ranged between 20 and 115. Data are shown as mean±s.e.m. Significance differences between M1CY and M85CY curves were determined by two-way ANOVA, Dunnett's post test. *P<0.05; **P<0.01; ***P<0.005; ****P<0.001. (D,E) Representative immunoblot of HEK cells expressing GFP-tagged spastins or GFP as a control (data not shown) and treated by cold shock (D) or incubated with 0.25 M NaCl (E), as described above for HeLa cells. The lower panels show the quantification of acetylated tubulin/GAPDH ratio based on the integrated fluorescence intensity of the respective western blot bands and normalized to the values measured in GFP-expressing cells without treatment. Data represent the average of two independent experiments (mean±s.e.m.). Acetylated tub., acetylated tubulin.
Fig. 7.
Fig. 7.
M1CY interacts with M1WT and re-localizes it to a filamentous pattern. HeLa or HEK cells were co-transfected with GFP-tagged mutated spastins and Flag-tagged M1WT for 16 h. (A) HeLa cells were fixed and stained with anti-Flag mAb. Scale bars: 20 µm. (B) Quantification of the overlap between Flag and GFP staining. Acquired images were processed as described in the Materials and Methods. For colocalization analysis between M1-Flag and M1CY-GFP, only cells with filamentous pattern of M1-Flag were selected. N, number of cells analyzed. Data are shown as mean±s.e.m. Significance was determined by one-way ANOVA, Dunnett's post test. ****P<0.001. ns, not significant. Differences between M1 and the other mutants were always significant (data not shown). (C) HEK cells were lysed and protein extract was incubated with Anti-Flag M2 magnetic beads at 4°C for 12-16 h. Only M1CY-GFP co-immunoprecipitates with M1WT. HC, heavy chains; WB, western blot. The arrowhead indicates M1CY-GFP, dash indicates M85CY-GFP, circle indicates M1Δ-GFP, square indicates N-Ter-GFP and asterisk indicates GFP.
Fig. 8.
Fig. 8.
Mutated M1 spastin alter axonal transport in cortical neurons. (A) Cortical neurons at 5 DIV were co-transfected with GFP-tagged mutated spastin and RFP-VAMP7 and imaged live after 16-20 h. The dynamics of VAMP7-positive vesicles were analyzed along the longer proximal axonal segment decorated by mutated M1 using a kymograph. (B) In GFP-, N-Ter- or M85CY-expressing cells, a similar region of axons was analyzed. (C,D) Quantification of anterograde (C) and retrograde (D) average speeds of RFP-VAMP7-containing vesicles in the different experimental conditions. n, number of moving vesicles analyzed. (E) Quantification of the number of moving VAMP7-positive vesicles normalized to the length of the axonal segment analyzed in GFP-, M1Δ- and M1CY-expressing neurons. a, number of axons analyzed. (F) Quantification of run length average of anterograde and retrograde VAMP7 moving vesicles (over 3 µm). d, number of vesicle displacements between two pauses analyzed. (G) Cumulative frequency distribution (%) of vesicle run lengths moving in anterograde (left) or retrograde (right) directions. Data are shown as mean±s.e.m. Significance was determined by one-way ANOVA, Dunnett's post test. *P<0.05; **P<0.01; ***P<0.005; ****P<0.001; ns, not significant. Scale bars: 20 µm.

Similar articles

Cited by

References

    1. Abal M., Piel M., Bouckson-Castaing V., Mogensen M., Sibarita J. B. and Bornens M. (2002). Microtubule release from the centrosome in migrating cells. J. Cell Biol. 159, 731-737. 10.1083/jcb.200207076 - DOI - PMC - PubMed
    1. Ahmad F. J. and Baas P. W. (1995). Microtubules released from the neuronal centrosome are transported into the axon. J. Cell Sci. 108, 2761-2769. - PubMed
    1. Akella J. S., Wloga D., Kim J., Starostina N. G., Lyons-Abbott S., Morrissette N. S., Dougan S. T., Kipreos E. T. and Gaertig J. (2010). MEC-17 is an alpha-tubulin acetyltransferase. Nature 467, 218-222. 10.1038/nature09324 - DOI - PMC - PubMed
    1. Allison R., Edgar J. R., Pearson G., Rizo T., Newton T., Günther S., Berner F., Hague J., Connell J. W., Winkler J. et al. (2017). Defects in ER-endosome contacts impact lysosome function in hereditary spastic paraplegia. J. Cell Biol. 216, 1337-1355. 10.1083/jcb.201609033 - DOI - PMC - PubMed
    1. Atherton J., Houdusse A. and Moores C. (2013). MAPping out distribution routes for kinesin couriers. Biol. Cell 105, 465-487. 10.1111/boc.201300012 - DOI - PubMed

Publication types