. 2018 Sep 13;9(1):3723.
doi: 10.1038/s41467-018-06040-4.

Extreme-ultraviolet high-harmonic generation in liquids

Affiliations

Extreme-ultraviolet high-harmonic generation in liquids

Tran Trung Luu et al. Nat Commun. .

Abstract

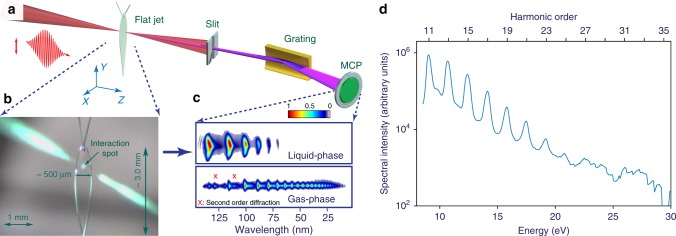
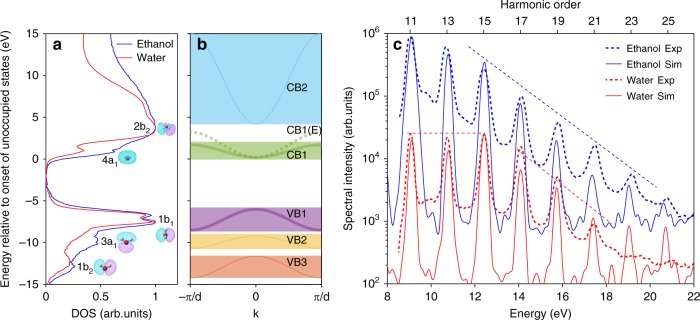
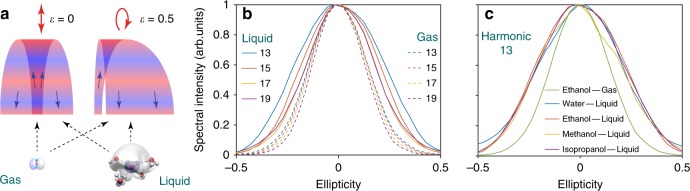
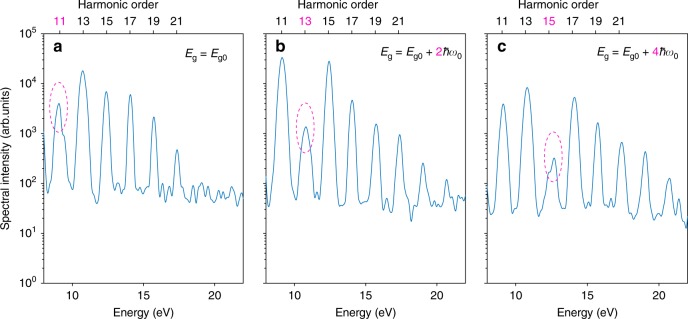
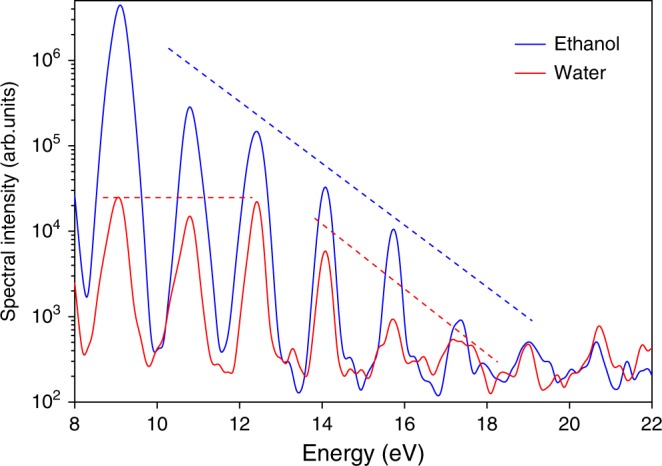
High-harmonic generation (HHG) in gases has been the main enabling technology of attosecond science since its discovery. Recently, HHG from solids has been demonstrated, opening a lively area of research. In contrast, harmonic generation from liquids has so far remained restricted to low harmonics in the visible regime. Here, we report the observation and detailed characterization of extreme ultraviolet HHG from liquid water and several alcohols extending beyond 20 eV. This advance was enabled by the implementation of the recent liquid flat-microjet technology, which we show to facilitate the spatial separation of HHG from the bulk liquid and the surrounding gas phase. We observe striking differences between the HHG spectra of water and several alcohols. A comparison with a strongly-driven few-band model establishes the sensitivity of HHG to the electronic structure of liquids. Our results suggest liquid-phase high-harmonic spectroscopy as a new method for studying the electronic structure and ultrafast scattering processes in liquids.


Conflict of interest statement

The authors declare no competing interests.

Figures

Fig. 1
Fig. 1
Extreme–ultraviolet high–order harmonic generation from liquid samples. a Experimental apparatus consisting of a liquid flat microjet and a flat–field spectrometer with a multi-channel plate (MCP). b Photograph of the laser–liquid interaction. The scattering of third harmonic (green) can be clearly observed. c Typical spatio–spectrally resolved far–field images of EUV emission from the liquid and gas–phase ethanol. The two spectra are individually normalized to the maximum peak intensities, as displayed in the color bar. d HHG spectrum recorded from interaction of laser pulses (30 fs, 1.5 μm, 1.2 mJ at 1 kHz, effective peak electric field strength of ≈1.5 V/Å inside the medium) with liquid ethanol
Fig. 2
Fig. 2
Non–perturbative high–order–harmonic generation from liquids. a Cut–off photon-energy dependence on peak electric field strength inside the medium (red dots). A typical absolute (total, approximated, propagated value of multiple measurements performed under identical experimental conditions) error bar of the electric field strength is displayed as a horizontal solid red line. Relative error bars are displayed as horizontal solid green lines. A linear fit of the high harmonic cut-off photon energy (Hcut-off) performed on a double-logarithmic scale is shown as the solid blue curve on a double-linear scale. b Dependence of the emitted intensity of individual harmonic orders on the peak–electric–field strength. A linear fit to the first four and the last three data points of H13 and H21 are shown on a double-logarithmic scale. Dashed lines represent the scaling law expected for a perturbative response. Liquid ethanol was used as a sample for all data shown here
Fig. 3
Fig. 3
Comparison of HHG from liquid water and several alcohols. HHG spectra recorded from water and three alcohols under individually optimized  experimental conditions. The dashed straight lines are guides to the eye
Fig. 4
Fig. 4
Sensitivity of HHG to the electronic structure of liquids. a Density of states extracted from X–ray absorption and emission spectra of liquid ethanol and water. The assignments of the bands to orbitals of isolated molecules are shown only for water. The orbitals are displayed as corresponding insets. b Adapted model band structure used in the numerical solution of the semiconductor Bloch equations. The modified first conduction band CB1(E) is used instead of CB1 in the case of ethanol. c Comparison of experimentally measured spectra (dashed curves) and calculated spectra using only the VB1 and CB1/CB1(E) (solid curves). Dashed straight lines are guides to the eye
Fig. 5
Fig. 5
Ellipticity dependence of HHG from liquids. a Schematic illustration of valence orbitals of a water monomer and a water pentamer cluster (representative sub–unit of liquid water) and the laser–driven continuum–electron wave packet for different ellipticities of the driving field. The color gradient illustrates the wave nature and propagation of the electronic wavepacket. ϵ is the ellipticity, with 0, 1 corresponding to linearly and circularly polarized electric fields, respectively. b Ellipticity dependence of the high–harmonic intensities, for different harmonic orders (H13 to H19) emitted from liquid–phase or gas–phase ethanol (solid and dashed lines, respectively) under identical experimental conditions. c Ellipticity dependence of H13 emitted from different liquids in comparison to gas–phase ethanol
Fig. 6
Fig. 6
Separating HHG from liquid and gas. a Schematic illustration of the optical path of the infrared laser pulses through the liquid flat microjet. The EUV emission from the bulk liquid is not refracted as it leaves the jet because the change in refractive index ni,t (i: incident, t: transmitted) is negligible, in contrast to the driving infrared beam that is strongly refracted, resulting in b, spatial separation of the emissions from the liquid and gas phases. The red and green lines delineate the areas of integration. c, Illustration of the laser–beam–flat–microjet interaction at partial lateral overlap. d Typical HHG spectra integrated over the y–dimension of the detector, obtained by scanning the jet position in the x–dimension. Inset drawings illustrate where the laser beam hits the flat–microjet spatially. eg Cross cuts of the HHG spectra when the laser beam hits the center of the flat microjet (f), or the surrounding gas phase on either side of the jet (e, g). Note the different scales on the vertical axes. Liquid ethanol is used as a sample in all data shown here
Fig. 7
Fig. 7
Sensitivity of HHG spectra to the band gap. ac, Spectra calculated from the numerical solution of the SBE, using the water electronic structure with the band gap changed from Eg0 = 6.2 eV to Eg0 + 2ħω0 and Eg0 + 4ħω0. Destructive interference  resulting in a local minimum at harmonic 11, 13, 15, can be clearly observed. For clarity of the demonstration, spatial integration was turned off in these calculations and a weaker electric field strength of 0.7 V/Å has been used
Fig. 8
Fig. 8
Propagation and phase-matching effects in liquid water  obtained by solving the coupled Maxwell–semiconductor Bloch equations. a Complex refractive index and b, electric field utilized in our simulations. ce Spectral intensity build-up at different positions inside the liquid water flat microjet for three cases: c, keeping only the real part of the refractive index,  while setting the imaginary part to zero; d keeping only the imaginary part of the refractive index while setting the real part to one; e using the complete complex refractive index. f, g Spectral intensity of H11 and H15 integrated over the vertical dimension of the rectangles in ce. Their absolute intensities are scaled as indicated. The orange rectangles in eg highlight the build-up length of the HHG intensity
Fig. 9
Fig. 9
Weak dependence of HHG spectra on propagation effects. HHG spectra retrieved from coupled Maxwell-SBE calculations including propagation over the thickness of the jet using the band structures of water (solid red line) and ethanol (solid blue line) described in the main text. Dashed straight lines are guides to the eye. All characteristic features obtained from the SBE calculations (Fig. 4 of the main text) are preserved, including the uniform decrease in the ethanol HHG spectrum, as well as the plateau and the dip at H13 in the water HHG spectrum

References

    1. McPherson A, et al. Studies of multiphoton production of vacuum-ultraviolet radiation in the rare gases. J. Opt. Soc. Am. B. 1987;4:595. doi: 10.1364/JOSAB.4.000595. - DOI
    1. Ferray M, et al. Multiple-harmonic conversion of 1064 nm radiation in rare gases. J. Phys. B. 1988;21:L31–L35. doi: 10.1088/0953-4075/21/3/001. - DOI
    1. Krausz F, Ivanov M. Attosecond physics. Rev. Mod. Phys. 2009;81:163–234. doi: 10.1103/RevModPhys.81.163. - DOI
    1. Calegari F, Sansone G, Stagira S, Vozzi C, Nisoli M. Advances in attosecond science. J. Phys. B. 2016;49:062001. doi: 10.1088/0953-4075/49/6/062001. - DOI
    1. Ghimire S, et al. Observation of high-order harmonic generation in a bulk crystal. Nat. Phys. 2011;7:138–141. doi: 10.1038/nphys1847. - DOI

Publication types