. 2018 Sep 13;8(1):13739.
doi: 10.1038/s41598-018-31726-6.

High-Reynolds Microfluidic Sorting of Large Yeast Populations

Affiliations

High-Reynolds Microfluidic Sorting of Large Yeast Populations

Eliezer Keinan et al. Sci Rep. .

Abstract

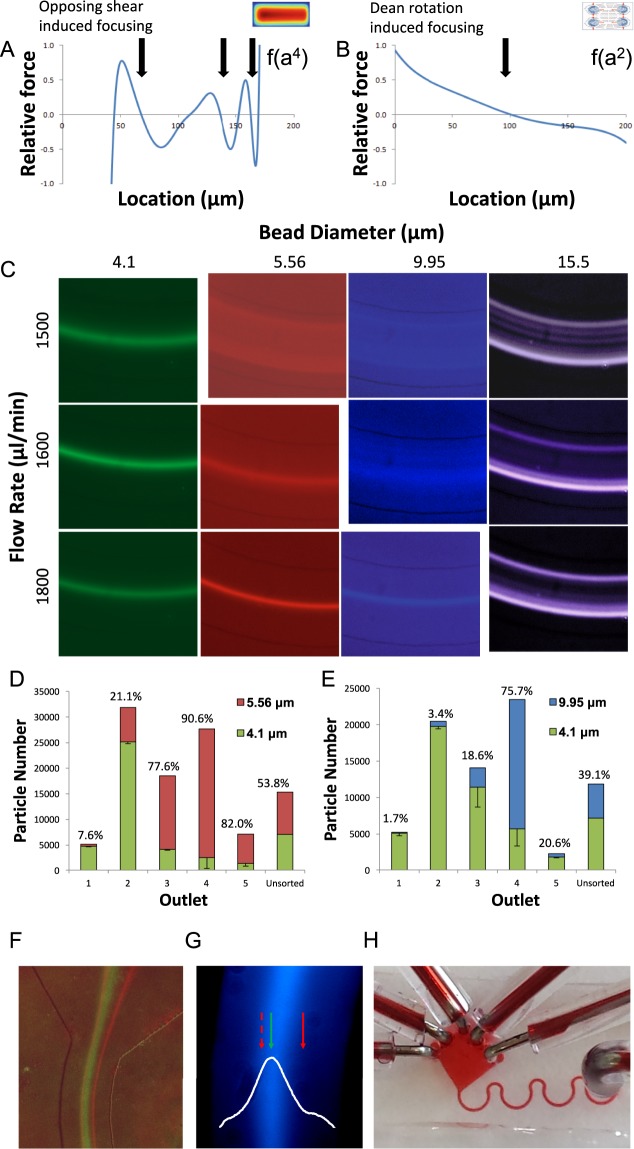
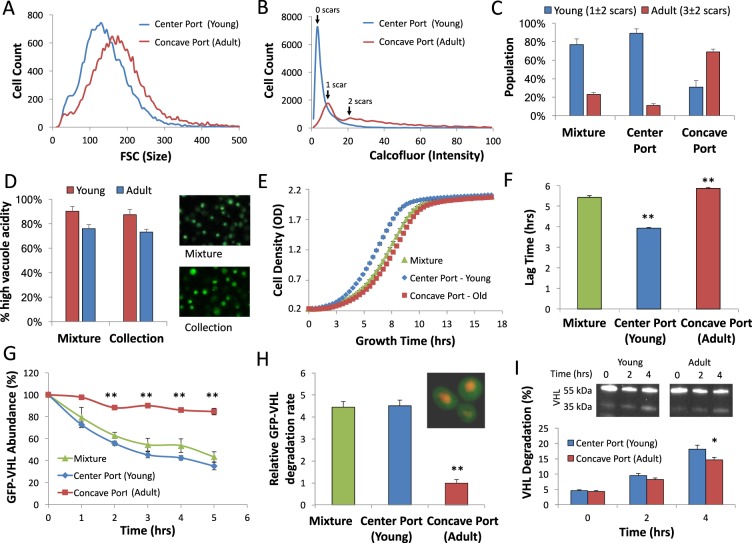
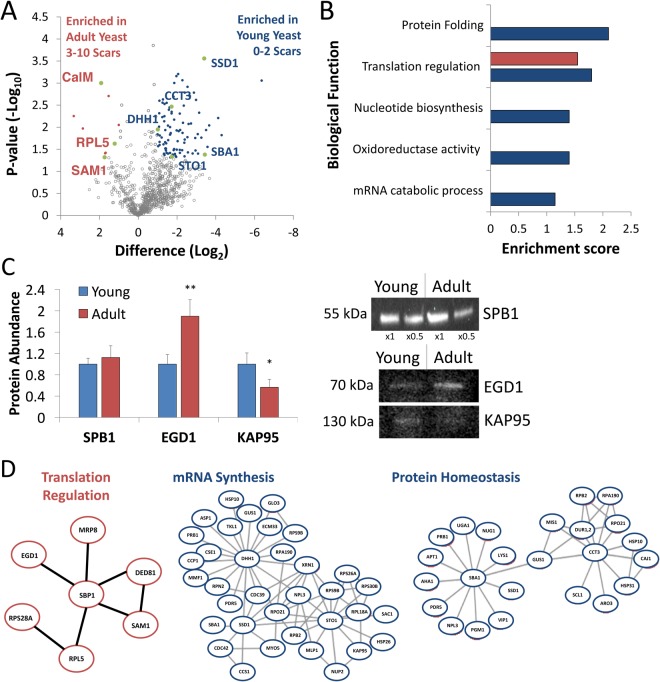
Microfluidic sorting offers a unique ability to isolate large numbers of cells for bulk proteomic or metabolomics studies but is currently limited by low throughput and persistent clogging at low flow rates. Recently we uncovered the physical principles governing the inertial focusing of particles in high-Reynolds numbers. Here, we superimpose high Reynolds inertial focusing on Dean vortices, to rapidly isolate large quantities of young and adult yeast from mixed populations at a rate of 107 cells/min/channel. Using a new algorithm to rapidly quantify budding scars in isolated yeast populations and system-wide proteomic analysis, we demonstrate that protein quality control and expression of established yeast aging markers such as CalM, RPL5, and SAM1 may change after the very first replication events, rather than later in the aging process as previously thought. Our technique enables the large-scale isolation of microorganisms based on minute differences in size (±1.5 μm), a feat unmatched by other technologies.


Conflict of interest statement

The authors declare no competing interests.

Figures

Figure 1
Figure 1
Single cell characterization of replicative aging in yeast (A) Combined image set of single yeast cells showing 0 to 10 budding scars. Chitin scars are stained with calcofluor white (blue), membranes with rhodamine-concanavalin A (red), and nuclei tagged with Htb2-GFP (green). Bar = 5 μm. (B) Image of rhodamine-concanavalin A stained yeast cells. (C) Single yeast cells identified using our algorithm. Objects touching image borders were discarded. (D) Budding scars identified using our algorithm. (E) Quantification of average membrane diameter as a function of scar number calculated from over 5000 yeast cells using our algorithm. Yeast shows a linear growth rate of 0.8 ± 0.1 μm/scar, and clear overlap between age groups. (F) Replicative age distribution in an exponential growth culture and in a high-density culture (methods). (G) Percent of yeast with GFP-tagged HSP104 foci as function of replicative age, calculated using image processing of 930 cells. **p < 0.01.
Figure 2
Figure 2
Microfluidic high Reynolds inertial sorting (A) Analytical calculation of shear-induced lift forces acting on 15 μm particle, in a horizontal cross-section of a rectangular channel, as previously shown. Stable equilibrium points are indicated by black arrows. Numerically derived velocity profile is superimposed. (B) Illustration of centrifugal forces acting on a dense 4 μm particle exposed to two Dean vortices. Stable equilibrium point indicated by black arrows. (C) Long-exposure images of fluorescent beads focused in curved microfluidic channels with 0.9 mm radius of curvature. Inertia focusing predominates in large particles, pushing beads to the concave side of the channel, while Dean vortices traps small particles in the center of the channel. Particle size threshold for inertial focusing increases with fluid velocity. (D,E) Cytometry-based particle analysis of microfluidic outflow compared to unsorted particle mixture. Particles were isolated at 1.5 mL/min flow rate (Re = 215). High purity of small 4.1 μm particles was obtained at convex side (outlet 1) but at low 12 ± 1% yield. Small 4.1 μm particles were primarily focused by Dean vortices to the channel center (outlet 2) with a yield of 55 ± 5%. Purity of 4.1 μm ranged from 79 ± 1% compared to similarly sized 5.56 μm particles, with overlapping distribution (D) to 97 ± 1% when separated from larger 9.95 μm particles (E). Large 5.56 and 9.95 μm particles were primarily pushed toward the concave side of the channel (outlet 4) by opposing shear-induced forces. Purity of larger particles ranged from 76 ± 9% to 90 ± 5% for 9.95 μm and 5.56 μm particles, respectively, with similar yields of 60 ± 9%. (F) Long exposure image of 4.1 μm (green) and 5.56 μm (red) particle streaklines. The green particles are focused to the center of the channel, and red particles are primarily pushed toward the concave edge of the channel. (G) Long exposure image of a heterogeneous yeast sample (blue). The streakline’s highest intensity location (white histogram) coincides with the small bead streakline (4.1 μm, green arrow) rather than the large bead streakline (5.56 μm, red arrows). (H) Photo of the microfluidic device composed of 4 repeats of curved microfluidic channels.
Figure 3
Figure 3
Analysis of isolated age-dependent yeast sub-populations. (A) Histogram of forward scatter (FCS) of microfluidic-sorted yeast populations collected from the center and concave ports. Forward scatter is correlated to particle size, 34% shift in FCS shows that yeast collected from the concave port are larger. (B) Histogram of calcofluor white intensity of microfluidic-sorted yeast populations. Yeast collected from the center port show minimal staining correlating to 0 to 1 replication scars (blue). Yeast collected from the concave port showed 3-fold higher intensity, correlating with 1 or more replication scar (red). (C) Single cell analysis of replicative age distribution in original yeast population (mixture) and cells isolated from the center and concave ports. Cells isolated from center port had an average scar number of 1.3 ± 1.6, and thus are labeled young. Cells from concave port had an average scar number of 3.4 ± 1.7, and thus are labeled adult. (D) Reduced vacuolar acidity is an early aging marker. Yeast sorted using our microfluidic device showed similar distribution of vacuolar acidity compared to unsorted mixture (p = 0.452, n = 3), showing that shear stress had no effect on traditional age-related properties of yeast. (E) Growth rates of microfluidic sorted yeast populations compared to the original mixture. (F) Lag time to exponential stage was 27% shorter in young yeast (0–2 scars) and 8% longer in adult yeast (3–10 scars) compared to the original mixture and adult yeast. **p < 0.01. (G) Relative GFP-VHL abundance normalized to NLS-tRFP measured for adult, young and heterogeneous mixture. VHL is a recognized misfolded protein in yeast. Adult cells show a significant delay in GFP-VHL degradation. **p < 0.01. (H) Relative GFP-VHL degradation rate was 4.5-fold lower in adult (3–10 scars) yeast than the original mixture or young yeast. In the corner: fluorescent micrograph of yeast expressing GFP-VHL and NLS-tRFP superimposed. **p < 0.01. (I) VHL degradation levels measured with western-blot image processing. The degraded proteins increased from 4-fold in the central port collection, while in the concave port collection it increased only by 3.4-fold over the same time period (p = 0.02, n = 3).
Figure 4
Figure 4
Proteomics analysis of the young and adult yeast cells (A) Volcano plot shows the (−log10) Welch t-Test P-value of each protein versus the Welch t-Test difference (log 2) between the two samples. Proteins that changed significantly (FDR = 0.05, S0 = 0.1) by at least two-folds with p-value < 0.05 are colored in blue (upregulated in young cells) or red (upregulated in adult cells). The complete list of the significantly different proteins can be found in Table S4. (B) Annotation of significantly different proteins and their enrichment over yeast proteome, showing differences in protein folding and translation. (C) Quantitative western blot validation of selected proteins. SPB1 is equally abundant in both populations and its quantity did not change significantly (p = 0.44, n = 3). EGD1 was enriched by 2-folds in the adult population (p = 0.02, n = 3), while KAP95 was enriched by 2-folds in the young population (p = 0.049, n = 3). ×0.5 notes 2-fold dilution of ×1. (D) Interactions of significantly different subset of proteins between young and adult cell cultures. Interaction map of upregulated proteins in young culture (blue) and adult cells (red) was derived by using STRING database of interactions and visualized by Cytoscape. To reduce complexity, subnetworks were selected for presentation. On right, subnetworks of proteins upregulated in young cells interacting with chaperones CCT3 and SBA1, and mRNA associated proteins DHH1, SSD1. Central panel presents subnetwork of translation regulators in young cells.

References

    1. Nyström T, Liu B. The mystery of aging and rejuvenation—a budding topic. Current opinion in microbiology. 2014;18:61–67. doi: 10.1016/j.mib.2014.02.003. - DOI - PubMed
    1. Henderson KA, Gottschling DE. A mother’s sacrifice: what is she keeping for herself? Current opinion in cell biology. 2008;20:723–728. doi: 10.1016/j.ceb.2008.09.004. - DOI - PMC - PubMed
    1. Amen T, Kaganovich D. Dynamic droplets: the role of cytoplasmic inclusions in stress, function, and disease. Cellular and Molecular Life Sciences. 2015;72:401–415. doi: 10.1007/s00018-014-1740-y. - DOI - PMC - PubMed
    1. Lindstrom DL, Gottschling DE. The mother enrichment program: a genetic system for facile replicative life span analysis in Saccharomyces cerevisiae. Genetics. 2009;183:413–422. doi: 10.1534/genetics.109.106229. - DOI - PMC - PubMed
    1. Woldringh C, Fluiter K, Huls P. Production of senescent cells of Saccharomyces cerevisiae by centrifugal elutriation. Yeast. 1995;11:361–369. doi: 10.1002/yea.320110409. - DOI - PubMed

Publication types

MeSH terms

LinkOut - more resources