. 2018 Aug 28:11:5239-5252.
doi: 10.2147/OTT.S171539. eCollection 2018.

miR-361-5p inhibits glioma migration and invasion by targeting SND1

Affiliations

miR-361-5p inhibits glioma migration and invasion by targeting SND1

Jing Liu et al. Onco Targets Ther. .

Abstract

Background: Downregulation of miR-361-5p contributes to epithelial-mesenchymal transition of glioma cells. However, the relevance of miR-361-5p to migration and invasion of gliomas remains unknown.

Materials and methods: The relationship between miR-361-5p and SND1 expression was analyzed in 120 human gliomas and 8 glioma cell lines by in situ hybridization, immunohistochemistry, and Western blot. Dual-luciferase reporter assay was used to identify SND1 as a target of miR-361-5p. The mechanisms through which miR-361-5p inhibits glioma cell migration and invasion were studied by in vitro assays.

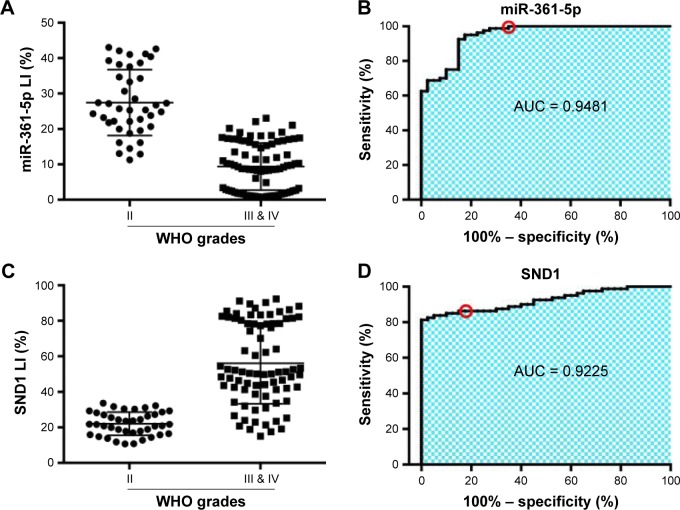
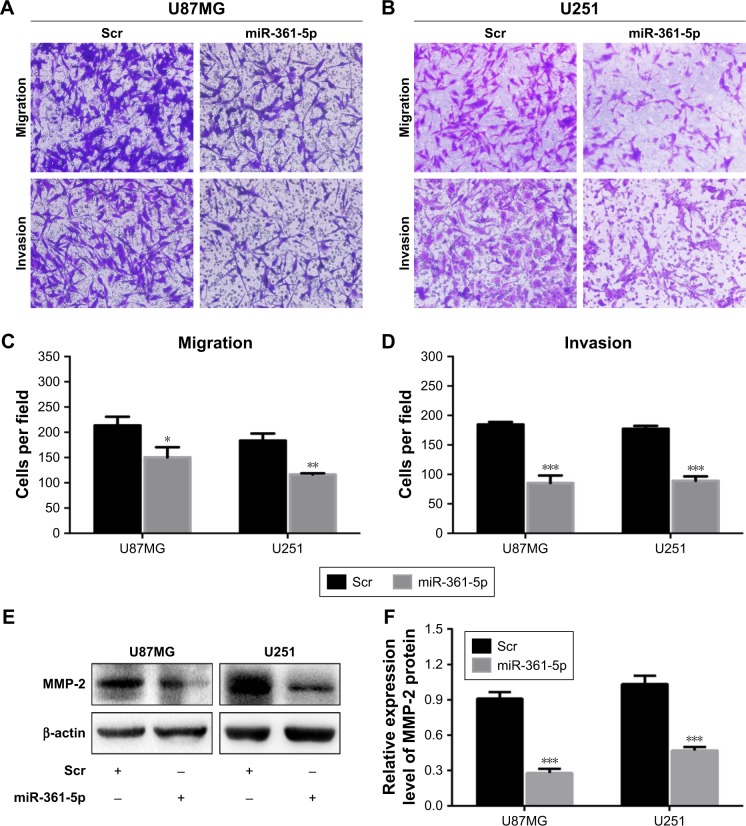
Results: miR-361-5p expression was significantly downregulated in glioma tissues and glioma cell lines, and was inversely correlated with glioma grades. However, SND1 expression was positively correlated with glioma grades and inversely correlated with miR-361-5p expression. miR-361-5p overexpression suppressed glioma cell migration and invasion through targeting SND1 and subsequently decreasing MMP-2 expression. In glioma cell lines, SND1 overexpression could partly reverse the antitumor effects of miR-361-5p.

Conclusion: The findings provide evidence that miR-361-5p directly targets SND1 to degradation and then reduces MMP-2 gene transcription, thus inhibiting glioma migration and invasion. miR-361-5p is an important tumor suppressor and a novel diagnostic biomarker of glioma, and miR-361-5p and SND1 are potential therapeutic candidates for malignant gliomas.

Keywords: SND1; glioma; invasion; miR-361-5p; migration.


Conflict of interest statement

Disclosure The authors report no conflicts of interest in this work.

Figures

Figure 1
Figure 1
miR-361-5p downregulation in gliomas and its correlation with SND1 expression. (A) Representative images of miR-361-5p ISH detection. Scale bar, 50 μm. (B) Comparisons among groups of miR-361-5p expression level (LI, %) in the FFPE samples of 120 gliomas and 20 nontumoral control brain tissues. The miR-361-5p LI (%) of each sample was calculated with Leica Image Pro Plus 5.0 software according to the percentage ratio of positive cell number to the total cell number. The data in (B) are presented as the mean ± SD. ***P < 0.001. (C) Representative images of SND1 IHC detection. Scale bar, 50 μm. (D) Comparisons among groups of SND1 expression level (LI, %) in the above FFPE samples. The SND1 LI (%) of each sample was calculated as described in (B). The data in (D) are presented as the mean ± SD. ***P < 0.001. (E) Pearson’s correlation analysis between SND1 and miR-361-5p expressions in the above FFPE samples. (F) qRT-PCR detection of miR-361-5p expression in 8 glioma cell lines and 1 immortalized normal human astrocyte cell line UC2. (G and H) Western blot analysis of SND1 protein expression in the cells as indicated. The relative expression level of SND1 was normalized against β-actin. (I) Pearson’s correlation analysis between miR-361-5p and SND1 protein expression in the above-described cell lines. All experiments were performed at least in triplicate, and the data in (F and G) are presented as the mean ± SD. *P < 0.05; **P < 0.01; ***P < 0.001. Abbreviations: ISH, in situ hybridization; LI, labeling index; FFPE, formalin-fixed, paraffin-embedded; IHC, immunohistochemistry; qRT-PCR, quantitative reverse transcription PCR.
Figure 1
Figure 1
miR-361-5p downregulation in gliomas and its correlation with SND1 expression. (A) Representative images of miR-361-5p ISH detection. Scale bar, 50 μm. (B) Comparisons among groups of miR-361-5p expression level (LI, %) in the FFPE samples of 120 gliomas and 20 nontumoral control brain tissues. The miR-361-5p LI (%) of each sample was calculated with Leica Image Pro Plus 5.0 software according to the percentage ratio of positive cell number to the total cell number. The data in (B) are presented as the mean ± SD. ***P < 0.001. (C) Representative images of SND1 IHC detection. Scale bar, 50 μm. (D) Comparisons among groups of SND1 expression level (LI, %) in the above FFPE samples. The SND1 LI (%) of each sample was calculated as described in (B). The data in (D) are presented as the mean ± SD. ***P < 0.001. (E) Pearson’s correlation analysis between SND1 and miR-361-5p expressions in the above FFPE samples. (F) qRT-PCR detection of miR-361-5p expression in 8 glioma cell lines and 1 immortalized normal human astrocyte cell line UC2. (G and H) Western blot analysis of SND1 protein expression in the cells as indicated. The relative expression level of SND1 was normalized against β-actin. (I) Pearson’s correlation analysis between miR-361-5p and SND1 protein expression in the above-described cell lines. All experiments were performed at least in triplicate, and the data in (F and G) are presented as the mean ± SD. *P < 0.05; **P < 0.01; ***P < 0.001. Abbreviations: ISH, in situ hybridization; LI, labeling index; FFPE, formalin-fixed, paraffin-embedded; IHC, immunohistochemistry; qRT-PCR, quantitative reverse transcription PCR.
Figure 2
Figure 2
ROC curve to determine the specificity and sensitivity of miR-361-5p and SND1 for diagnosis of glioma. (A) The expression of miR-361-5p in glioma. (B) The area under the ROC curve was 0.9388 (95% CI: 0.8956–0.9819, P < 0.0001). The optimal cutoff value for glioma diagnosis using miR-361-5p LI was ≤12.78% (sensitivity 68.75%; specificity 97.5%). (C) The expression of SND1 in glioma. (D) The area under the ROC curve was 0.9225 (95% CI: 0.8760–0.9690, P < 0.0001). The optimal cutoff value for glioma diagnosis using miR-361-5p LI was ≥33.93% (sensitivity 681.25%; specificity 100%). Abbreviations: ROC, receiver operating characteristic; LI, labeling index; AUC, area under the curve.
Figure 3
Figure 3
SND1 is a direct target of miR-361-5p. (A) miR-361-5p binding site in SND1 3′-UTR predicted with TargetScan. Wild (SND1-3′-UTR-WT) and mutant (SND1-3′-UTR-MT) SND1 3′-UTRs carried in recombinant luciferase mRNAs transcribed by p-WT and p-MT. (B and C) Luciferase reporter assays in U87MG and U251 cells transfected with p-WT or p-MT (Mock), and cotransfected with p-WT or p-MT and Scr or miR-361-5p mimics. (D) qRT-PCR analysis of SND1 mRNA expression in the cells as indicated. Their relative expression levels were normalized against GAPDH. The ratios of SND1/GAPDH in transfected with Scr were arbitrarily set to 1.0. (E and F) Western blot analysis of SND1 protein expression in the cells as indicated. The relative expression level of SND1 was normalized against β-actin. All experiments were performed at least in triplicate, and the data in (BF) are presented as the mean ± SD. *P < 0.05; **P < 0.01. Abbreviation: qRT-PCR, quantitative reverse transcription PCR.
Figure 4
Figure 4
miR-361-5p inhibits the migration and invasion of glioblastoma cell lines. (A and B) Transwell-chamber migration and invasion assay. The migratory and invasive capabilities were reflected by the number of cells per microscopic field that had migrated to or invaded the underside of the membrane. (C and D) Quantification of the transmembrane migration and invasion abilities of cells as indicated. (E and F) Western blot analysis of MMP-2 protein expression in the cells as indicated. The relative expression level of MMP-2 was normalized against β-actin. All experiments were performed at least in triplicate, and the data in (CF) are presented as the mean ± SD. *P < 0.05; **P < 0.01; ***P < 0.001.
Figure 5
Figure 5
Cell-based scratch assays showed that miR-361-5p inhibits the migration of glioblastoma cell lines. (A and C) In cell-based scratch assays, the miR-361-5p-treated U87MG group showed significantly decreased cell migration compared to the control group (U87MG-Scr) at 12 and 24 h, respectively. (B and D) miR-361-5p-treated U251 group showed decreased cell migration at 24 h. All experiments were performed at least in triplicate, and the data in (C and D) are presented as the mean ± SD. ***P < 0.001.
Figure 6
Figure 6
SND1 promotes MMP-2 expression via gene transcription. (A and B) Western blot analysis of SND1 and MMP-2 protein expression in the cells as indicated. The relative expression levels of SND1 and MMP-2 were normalized against β-actin. (CF) ChIP assays were carried out with U87MG-pSG5, U87MG-pSG5-SND1, U251-pSG5, and U251-pSG5-SND1 cells. Chromatin fragments of the cells were immunoprecipitated with anti-SND1 antibody or normal IgG and subjected to PCR. (C and E) Ten percent of the total cell lysates was subjected to PCR before immunoprecipitation as input. (D and F) The relative band intensity was calculated as the ratio between precipitate and input DNA from each cell line. All experiments were performed at least in triplicate, and the data in (B, D, and F) are presented as the mean ± SD. **P < 0.01; ***P < 0.001. Abbreviation: ChIP, chromatin immunoprecipitation.
Figure 7
Figure 7
Exogenous SND1 compromises the migration- and invasion-suppressive effects of miR-361-5p. (AC) Western blot analysis of SND1 and MMP-2 protein expression in the cells as indicated. The relative expression levels of SND1 and MMP-2 were normalized against β-actin. (DG) Exogenous SND1 partially restored the migrated and invaded cell numbers of the miR-361-5p + pSG5-SND1 groups. All experiments were performed at least in triplicate, and the data in (B, C, E, and G) are presented as the mean ± SD. *P < 0.05; **P < 0.01; ***P < 0.001.

Similar articles

Cited by

References

    1. Wen PY, Kesari S. Malignant gliomas in adults. N Engl J Med. 2008;359(5):492–507. - PubMed
    1. Dardevet L, Rani D, Aziz TA, et al. Chlorotoxin: a helpful natural scorpion peptide to diagnose glioma and fight tumor invasion. Toxins (Basel) 2015;7(4):1079–1101. - PMC - PubMed
    1. Clarke J, Butowski N, Chang S. Recent advances in therapy for glioblastoma. Arch Neurol. 2010;67(3):279–283. - PubMed
    1. Carthew RW, Sontheimer EJ. Origins and mechanisms of miRNAs and siRNAs. Cell. 2009;136(4):642–655. - PMC - PubMed
    1. Galasso M, Sandhu SK, Volinia S. MicroRNA expression signatures in solid malignancies. Cancer J. 2012;18(3):238–243. - PubMed

LinkOut - more resources