. 2018 Sep 10:18:135.
doi: 10.1186/s12935-018-0633-9. eCollection 2018.

Membrane expression of thymidine kinase 1 and potential clinical relevance in lung, breast, and colorectal malignancies

Affiliations

Membrane expression of thymidine kinase 1 and potential clinical relevance in lung, breast, and colorectal malignancies

Evita G Weagel et al. Cancer Cell Int. .

Erratum in

Abstract

Background: Lung, breast, and colorectal malignancies are the leading cause of cancer-related deaths in the world causing over 2.8 million cancer-related deaths yearly. Despite efforts to improve prevention methods, early detection, and treatments, survival rates for advanced stage lung, breast, and colon cancer remain low, indicating a critical need to identify cancer-specific biomarkers for early detection and treatment. Thymidine kinase 1 (TK1) is a nucleotide salvage pathway enzyme involved in cellular proliferation and considered an important tumor proliferation biomarker in the serum. In this study, we further characterized TK1's potential as a tumor biomarker and immunotherapeutic target and clinical relevance.

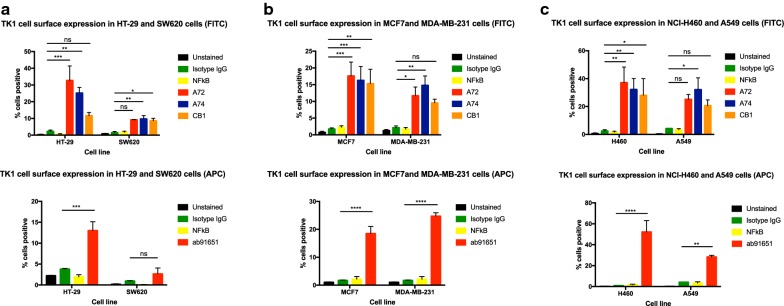
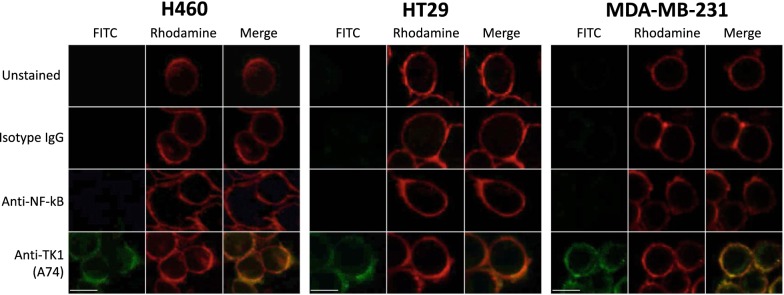
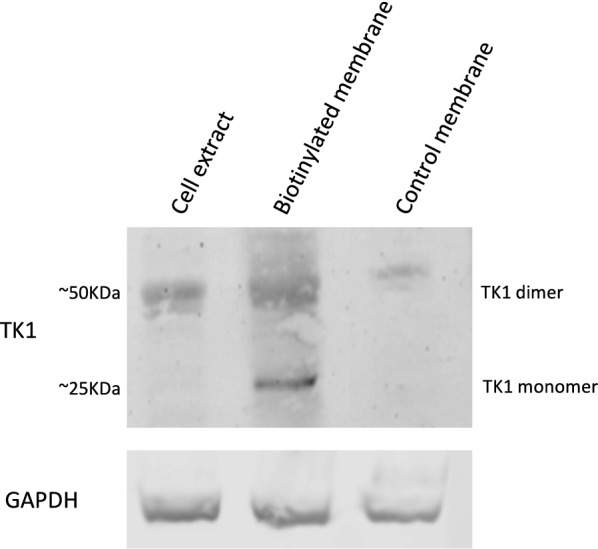
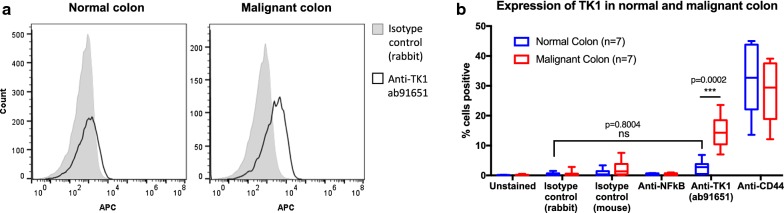
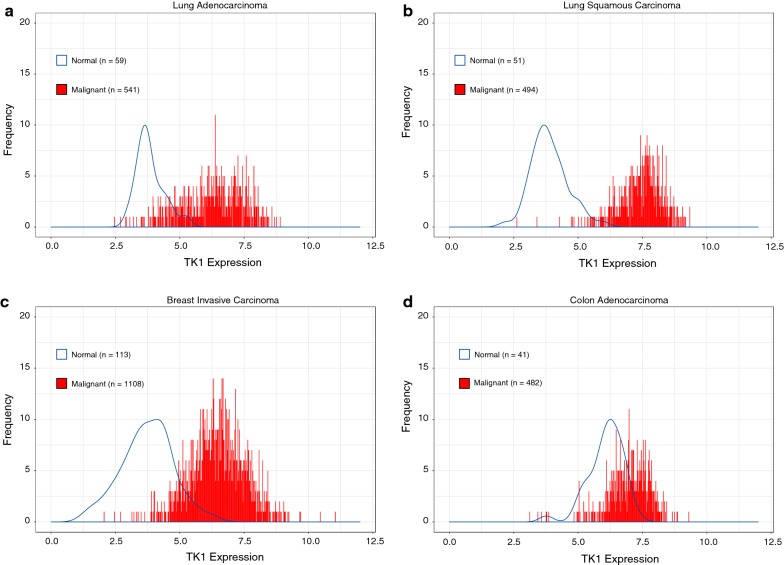
Methods: We assessed TK1 surface localization by flow cytometry and confocal microscopy in lung (NCI-H460, A549), breast (MDA-MB-231, MCF7), and colorectal (HT-29, SW620) cancer cell lines. We also isolated cell surface proteins from HT-29 cells and performed a western blot confirming the presence of TK1 on cell membrane protein fractions. To evaluate TK1's clinical relevance, we compared TK1 expression levels in normal and malignant tissue through flow cytometry and immunohistochemistry. We also analyzed RNA-Seq data from The Cancer Genome Atlas (TCGA) to assess differential expression of the TK1 gene in lung, breast, and colorectal cancer patients.

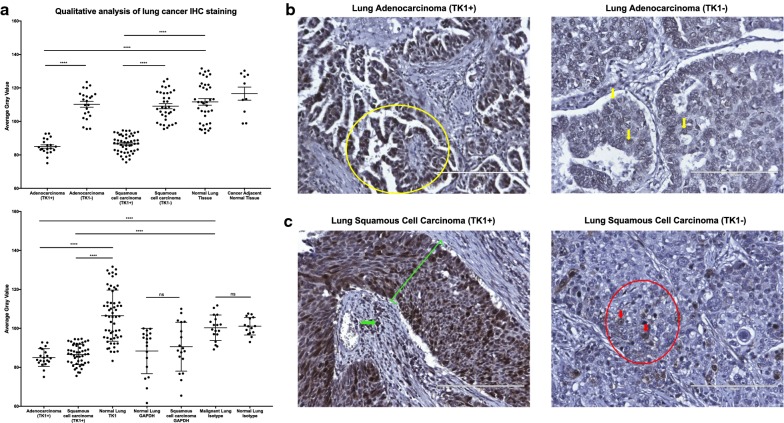
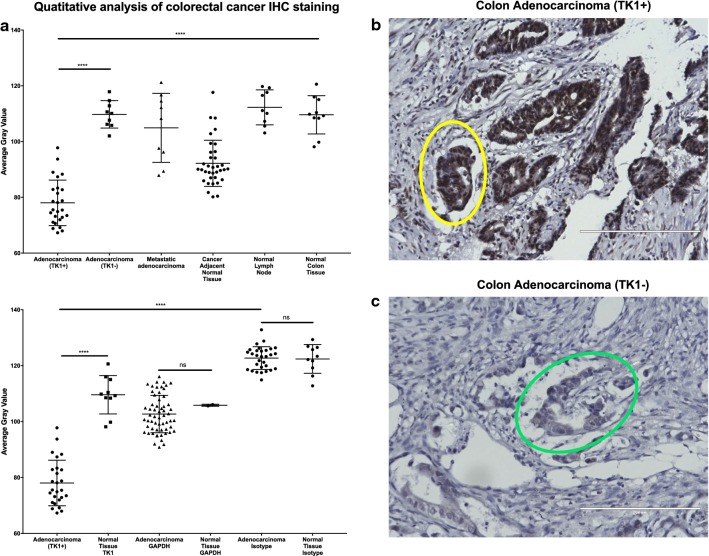
Results: We found significant expression of TK1 on the surface of NCI-H460, A549, MDA-MB-231, MCF7, and HT-29 cell lines and a strong association between TK1's localization with the membrane through confocal microscopy and Western blot. We found negligible TK1 surface expression in normal healthy tissue and significantly higher TK1 expression in malignant tissues. Patient data from TCGA revealed that the TK1 gene expression is upregulated in cancer patients compared to normal healthy patients.

Conclusions: Our results show that TK1 localizes on the surface of lung, breast, and colorectal cell lines and is upregulated in malignant tissues and patients compared to healthy tissues and patients. We conclude that TK1 is a potential clinical biomarker for the treatment of lung, breast, and colorectal cancer.

Keywords: Breast cancer; Colon cancer; Lung cancer; Membrane TK1; Surface expression; TK1; Thymidine kinase 1.


Figures

Fig. 1
Fig. 1
Membrane TK1 expression in of colon, breast, and lung cancer cell lines. Flow cytometry analysis of cell lines treated with anti-TK1 antibodies. a Quantification of TK1 expression on the cell membrane of HT-29 and SW620 cell lines stained with FITC or APC-conjugated anti-TK1 antibodies. b Quantification of TK1 expression on the cell membrane of MCF7 and MDA-MB-231 cell lines. The top bar graph shows MCF7 and MDA-MB-231 cell lines stained with FITC or APC-conjugated anti-TK1 antibodies. c Quantification of TK1 expression on the cell membrane of NCI-H460 and A549 cell lines stained with FITC or APC-conjugated anti-TK1 antibodies. Statistical analysis was performed by comparing the mouse isotype control fluorescent levels to those of A72, A74, CB1, or ab91651. *P ≤ 0.05; **P ≤ 0.005; ***P ≤ 0.001; ns = P > 0.05
Fig. 2
Fig. 2
TK1 co-localizes with the plasma membrane of lung, breast, and colon cell lines. NCI-H460, HT-29, and MD-MBA-231 cells were stained with FITC-conjugated antibodies and a cell membrane specific dye (Rhodamine). Unstained cells, cells stained with isotype antibody, and cells stained with anti-NFkB antibody (FITC) were used as controls to determine the viability of cells and the non-internalization of the antibodies to prevent false positives. FITC images show staining on cells treated with anti-TK1 antibody A74. The FITC images were merged with the Rhodamine images, which show the plasma membrane. The images show a clear co-localization of TK1 with the plasma membrane of these cells
Fig. 3
Fig. 3
Western blot of membrane proteins isolated from HT-29 cells probed with anti-TK1 antibody ab91651. Membrane proteins from HT-29 were biotinylated and isolated for Western blot analysis. Controls included membrane protein isolation from non-biotinylated cells and cell extracts. The results show TK1 is found in the membrane of HT-29 cells in monomeric (~ 25 kDa) and dimeric forms (~ 50 kDa)
Fig. 4
Fig. 4
Flow cytometry evaluation of TK1 expression on the surface of colorectal patient tissue. Healthy normal and malignant colon tissue was dissociated into a single cell suspension solution and stained with anti-TK1 antibody 91651, isotype control, anti-CD44 (positive control), and anti-NFkB (negative control). Unstained cells were also used as a negative control. a Flow cytometry histograms showing normal and malignant colon tissue stained with isotype control (gray area) and anti-TK1 antibody ab91651 (black line). There is a definitive shift in fluorescence in the malignant cells treated with ab91651, whereas there is no shift in fluorescence in the normal colon cells treated with the same antibody. b Quantification and analysis of flow cytometry data on the expression of TK1 on the surface of normal and malignant colon. Malignant colon tissues show a significantly higher expression of TK1 on their membrane compared to normal colon tissues (P = 0.002). Normal colon tissues show comparable results to those of the isotype control (P = 0.8004), suggesting TK1 expression on the surface of normal colon tissues is negligible
Fig. 5
Fig. 5
Immunohistochemistry analysis of TK1 expression in lung cancer tissue. Lung cancer tissue arrays were stained with anti-TK1 antibody ab91651, GAPDH, or isotype antibody. Tissues were imaged in a light microscope at 20×. Analysis was conducted using a gray scale. The lower the gray value, the darker the staining. a Quantitative analysis of lung cancer IHC staining. The top graph shows that there is a statistically significant expression of TK1 in ~ 53% of the lung adenocarcinoma tissues and in ~ 58% of the lung squamous cell carcinoma tissues. The bottom graph shows the TK1 expression next to GAPDH and isotype controls. Background levels show no statistical difference between malignant and normal healthy tissues. Malignant and normal healthy tissue showed non-statistical difference in GAPDH expression, whereas TK1 expression did show a statically significant difference between TK1+ and TK1− tissues. b Images showing lung adenocarcinoma tissue positive and weakly positive for TK1, which we classified as TK1− with gray value quantification. The yellow circle in adenocarcinoma TK1+ image corresponds to lung papillary adenocarcinoma formed by abnormal proliferation of glanduli form structures of papillary disposition. The adenocarcinoma TK1− image shows pulmonary adenocarcinoma tissue with acinar pattern conformed by cells of convoluted nuclei, irregular membrane, and prominent central macronucleoli. The yellow arrows correspond to a diffuse weak positive nuclear staining for TK1. c Images showing lung squamous cell carcinoma tissue positive and weakly positive for TK1, which we classified as TK1− with gray value quantification. In the squamous cell carcinoma TK1+ image, the green line shows strong diffuse positive nuclear staining for TK1. The green arrow shows cytoplasmic background where there is evidence of infiltration in the underlying stroma shown by positive immunostaining against TK1. In the squamous cell carcinoma TK1− image, the red circle and arrows show weakly positive nuclear focal staining in poorly differentiated lung squamous carcinoma with solid pattern. ***P ≤ 0.001; ns = P > 0.05
Fig. 6
Fig. 6
Immunohistochemistry analysis of TK1 expression in breast cancer tissue. Breast cancer tissue arrays were stained with anti-TK1 antibody ab91651, GAPDH, or isotype antibody. GAPDH was used as a positive control to account for housekeeping gene expression. The isotype antibody was used to account for background noise and non-specific binding. Tissues were imaged in a light microscope at 20×. Analysis was conducted using a gray scale. The lower the gray value, the darker the staining. a Quantitative analysis of breast cancer IHC staining. The top graph shows that there is a statistically significant expression of TK1 in 20% of the ductal carcinoma tissues. The bottom graph shows the TK1 expression next to GAPDH and isotype controls. Background levels show no statistical difference between malignant and normal healthy tissues. Malignant and normal healthy tissue showed non-statistical difference in GAPDH expression, whereas TK1 expression did show a statically significant difference between TK1+ and TK1− tissues. b Image showing breast ductal carcinoma positive for TK1. The yellow circle encloses a malignant gland structure corresponding to a moderately differentiated ductal carcinoma, and the arrow shows strong nuclear staining against TK1 in approximately 25% of the cells. c Image showing breast ductal carcinoma negative for TK1. The green circle shows an atypical gland structure corresponding to moderately differentiated ductal carcinoma negative for staining against TK1. The green arrow shows the tumor stroma conformed by fibrotic tissue also negative for TK1. Overall, the tissues shown in Fig. 5b, c show what we observed in the tissue’s average gray values represented in Fig. 5a, that some ductal carcinoma showed strong TK1 staining and some showed negative TK1 staining. ***P ≤ 0.001; ns = P > 0.05
Fig. 7
Fig. 7
Immunohistochemistry analysis of TK1 expression in colon cancer tissue. Colon cancer tissue arrays were stained with anti-TK1 antibody ab91651, GAPDH, or isotype antibody. GAPDH was used as a positive control to account for housekeeping gene expression. The isotype antibody was used to account for background noise and non-specific binding. Tissues were imaged in a light microscope at 20×. Analysis was conducted using a gray scale. The lower the gray value, the darker the staining. a Quantitative analysis of colorectal cancer IHC staining. The top graph shows that there is a statistically significant expression of TK1 in ~ 74% of the colon adenocarcinoma tissues. The bottom graph shows the TK1 expression next to GAPDH and isotype controls. Background levels show no statistical difference between malignant and normal healthy tissues. Malignant and normal healthy tissue showed non-statistical difference in GAPDH expression, whereas TK1 expression did show a statically significant difference between TK1+ and TK1− tissues. b Image showing colorectal adenocarcinoma positive for TK1. The yellow circle encloses an atypical glandular structure positive for TK1 in over 90% of the cells. c Image showing colorectal adenocarcinoma negative for TK1. The circle an atypical glandular structure negative for TK1. Overall, the tissues shown in (b, c) show what we observed in the tissue’s average gray values represented in a, that some colorectal adenocarcinoma tissues showed strong TK1 staining and some showed negative TK1 staining. ***P ≤ 0.001; ns = P > 0.05
Fig. 8
Fig. 8
Lung, breast, and colorectal cancer patients show upregulated TK1 gene expression compared to normal patients. a TK1 gene expression in lung adenocarcinoma vs. normal lung patients. b TK1 gene expression in lung squamous cell carcinoma vs. normal lung patients. c TK1 gene expression in breast invasive carcinoma vs. normal breast patients. d TK1 gene expression in colon adenocarcinoma vs. normal colon patients
Fig. 9
Fig. 9
Boxplot of RNA-Sequencing data from The Cancer Genome Atlas showing TK1 gene expression in HER2+ breast tumors and triple negative breast cancer (TNBC) tumors. The boxplot shows there is a significant upregulation in TK1 expression in TNBC tumors compared to HER2+ tumors
Fig. 10
Fig. 10
Scatterplots of RNA-sequencing data from The Cancer Genome Atlas comparing TK1 expression to six stemness and EMT markers in HER2+ breast tumors and triple negative (TNBC) tumors. a Cell stemness marker CD44 is positively correlated to TK1 in TNBC tumors and negatively correlated to TK1 in HER2+ breast tumors. b EMT marker SNAI1 is positively correlated to TK1 in TNBC tumors and negatively correlated to TK1 in HER2+ breast tumors. c EMT marker SNAI2 is negatively correlated to TK1 in TNBC tumors and in HER2+ breast tumors. d EMT marker TWIST1 is negatively correlated to TK1 in TNBC tumors and in HER2+ breast tumors. e EMT marker ZEB1 is negatively correlated to TK1 in TNBC tumors and in HER2+ breast tumors. f Stemness and EMT marker TGFB1 negatively correlated to TK1 in TNBC tumors and in HER2+ breast tumors

Similar articles

Cited by

References

    1. Stewart BW, Wild CP. World cancer report 2014. World Health Organization. 2014. http://www.videnza.org/wp-content/uploads/World-Cancer-Report-2014.pdf. Accessed 2 Sept 2016.
    1. Torre LA, Bray F, Siegel RL, Ferlay J, Lortet-Tieulent J, Jemal A. Global cancer statistics, 2012. CA Cancer J Clin. 2015;65:87–108. doi: 10.3322/caac.21262. - DOI - PubMed
    1. Siegel RL, Miller KD, Jemal A. Cancer statistics, 2016. CA Cancer J Clin. 2016;66:7–30. doi: 10.3322/caac.21332. - DOI - PubMed
    1. Pepe MS, Etzioni R, Feng Z, Potter JD, Thompson ML, Thornquist M, et al. Phases of biomarker development for early detection of cancer. J Natl Cancer Inst. 2001;93:1054–1061. doi: 10.1093/jnci/93.14.1054. - DOI - PubMed
    1. Dalton WS, Friend SH. Cancer biomarkers—an invitation to the table. Science (80-) 2006;312:1165–1168. doi: 10.1126/science.1125948. - DOI - PubMed

LinkOut - more resources