

[18F]Fludarabine-PET as a promising tool for differentiating CNS lymphoma and glioblastoma: Comparative analysis with [18F]FDG in human xenograft models
- PMID: 30214639
- PMCID: PMC6134939
- DOI: 10.7150/thno.26754
[18F]Fludarabine-PET as a promising tool for differentiating CNS lymphoma and glioblastoma: Comparative analysis with [18F]FDG in human xenograft models
Abstract
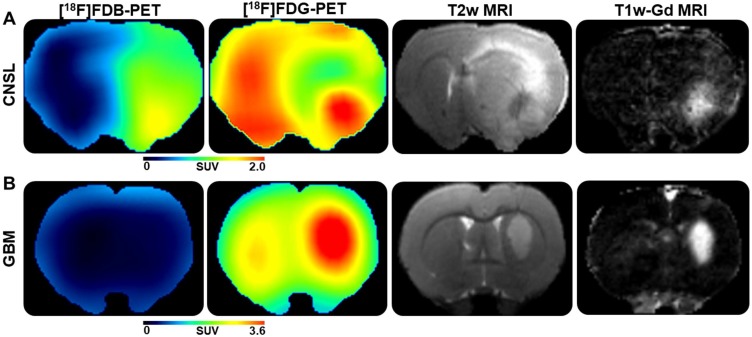
This paper investigated whether positron emission tomography (PET) imaging with [18F]fludarabine ([18F]FDB) can help to differentiate central nervous system lymphoma (CNSL) from glioblastoma (GBM), which is a crucial issue in the diagnosis and management of patients with these aggressive brain tumors. Multimodal analyses with [18F]fluorodeoxyglucose ([18F]FDG), magnetic resonance imaging (MRI) and histology have also been considered to address the specificity of [18F]FDB for CNSL. Methods: Nude rats were implanted with human MC116 lymphoma-cells (n = 9) or U87 glioma-cells (n = 4). Tumor growth was monitored by MRI, with T2-weighted sequence for anatomical features and T1-weighted with gadolinium (Gd) enhancement for blood brain barrier (BBB) permeability assessment. For PET investigation, [18F]FDB or [18F]FDG (~11 MBq) were injected via tail vein and dynamic PET images were acquired up to 90 min after radiotracer injection. Paired scans of the same rat with the two [18F]-labelled radiotracers were investigated. Initial volumes of interest were manually delineated on T2w images and set on co-registered PET images and tumor-to-background ratio (TBR) was calculated to semi-quantitatively assess the tracer accumulation in the tumor. A tile-based method for image analysis was developed in order to make comparative analysis between radiotracer uptake and values extracted from immunohistochemistry staining. Results: In the lymphoma model, PET time-activity curves (TACs) revealed a differential response of [18F]FDB between tumoral and healthy tissues with average TBR varying from 2.45 to 3.16 between 5 to 90 min post-injection. In contrast, [18F]FDG demonstrated similar uptake profiles for tumoral and normal regions with TBR varying from 0.84 to 1.06 between these two time points. In the glioblastoma (GBM) model, the average TBRs were from 2.14 to 1.01 for [18F]FDB and from 0.95 to 1.65 for [18F]FDG. Therefore, inter-model comparisons showed significantly divergent responses (p < 0.01) of [18F]FDB between lymphoma and GBM, while [18F]FDG demonstrated overlap (p = 0.04) between the groups. Tumor characterization with histology (based mainly on Hoechst and CD79), as well as with MRI was overall in better agreement with [18F]FDB-PET than [18F]FDG with regard to tumor selectivity. Conclusions: [18F]FDB-PET demonstrated considerably greater specificity for CNSL when compared to [18F]FDG. It also permitted a more precise definition of target volume compared to contrast-enhanced MRI. Therefore, the potential of [18F]FDB-PET to distinguish CNSL from GBM is quite evident and will be further investigated in humans.
Keywords: CNS lymphoma; [18F]FDG; [18F]fludarabine-PET; differential diagnosis; glioblastoma.
Conflict of interest statement
Competing Interests: The authors have declared that no competing interest exists.
Figures


References
-
- Hoang-Xuan K, Bessell E, Bromberg J, Hottinger AF, Preusser M, Rudà R. et al. Diagnosis and treatment of primary CNS lymphoma in immunocompetent patients: guidelines from the european association for neuro-oncology. Lancet Oncol. 2015;16:e322–32. - PubMed
-
- Baraniskin A, Deckert M, Schulte-Altedorneburg G, Schlegel U, Schroers R. Current strategies in the diagnosis of diffuse large B-cell lymphoma of the central nervous system. Br J Haematol. 2012;156:421–32. - PubMed
Publication types
MeSH terms
Substances
LinkOut - more resources
Full Text Sources
Other Literature Sources
Medical
