. 2017 Dec;6(4):http://www.rroij.com/open-access/quantitative-and-qualitative-assessment-methods-for-biofilm-growth-a-minireview-.pdf.
Epub 2017 Oct 24.

Quantitative and Qualitative Assessment Methods for Biofilm Growth: A Mini-review

Affiliations

Quantitative and Qualitative Assessment Methods for Biofilm Growth: A Mini-review

Christina Wilson et al. Res Rev J Eng Technol. 2017 Dec.

Abstract

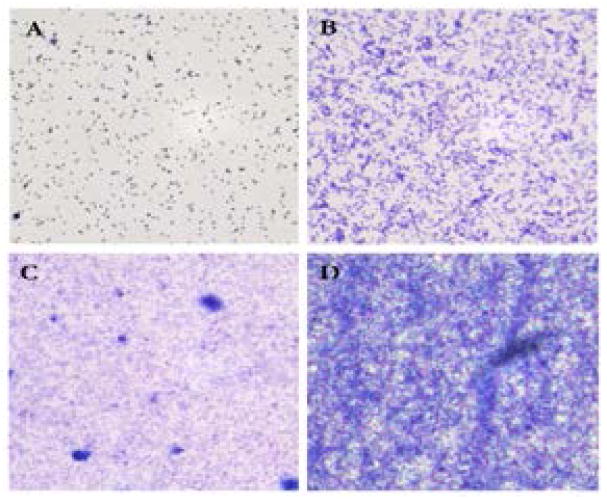
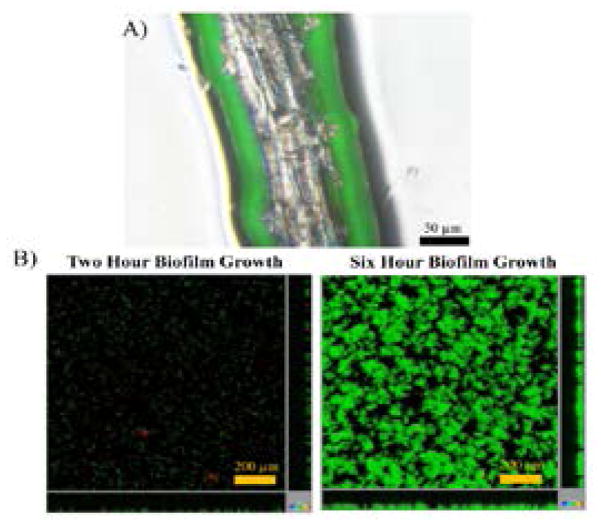
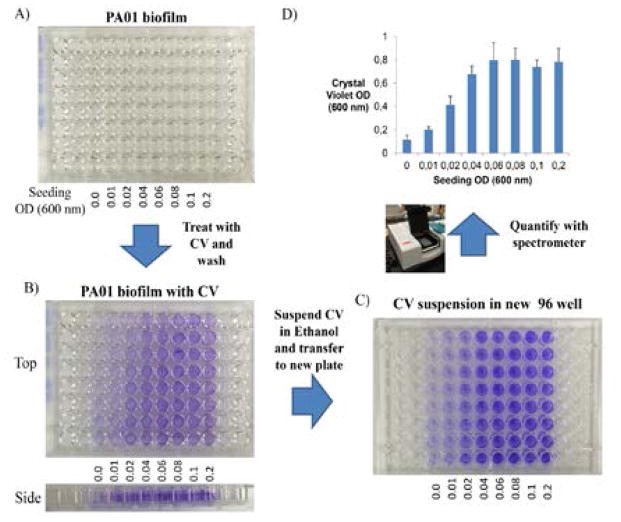
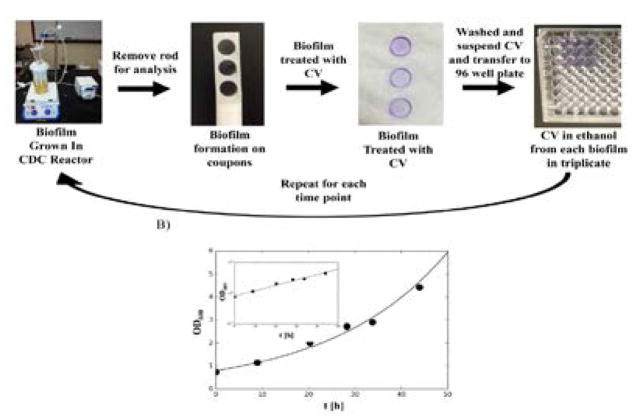
Biofilms are microbial communities attached to a surface and embedded in an extracellular polymeric substance which provides for the protection, stability and nutrients of the various bacterial species indwelling. These communities can build up in a variety of different environments from industrial equipment to medical devices resulting in damage, loss of productivity and disease. They also have great potential for economic and societal benefits as bioremediation agents and renewable energy sources. The great potential benefits and threats of biofilms has encouraged researchers across disciplines to study biofilm characteristics and antibiofilm strategies resulting in chemists, physicists, material scientists, and engineers, to develop beneficial biofilm applications and prevention methods. The ultimate outcome is a wealth of knowledge and innovative technology. However, without extensive formal training in microbes and biofilm research, these scientists find a daunting array of established techniques for growing, quantifying and characterizing biofilms while trying to design experiments and develop innovative laboratory protocols. This mini-review focuses on enriching interdisciplinary efforts and understanding by overviewing a variety of quantitative and qualitative biofilm characterization methods to assist the novice researcher in assay selection. This review consists of four parts. Part 1 is a brief overview of biofilms and the unique properties that demand a highly interdisciplinary approach. Part 2 describes the classical quantification techniques including colony forming unit (CFU) counting and crystal violet staining, but also introduces some modern methods including ATP bioluminescence and quartz crystal microbalance. Part 3 focuses on the characterization of biofilm morphology and chemistry including scanning electron microscopy and spectroscopic methods. Finally, Part 4 illustrates the use of software, including ImageJ and predictive modeling platforms, for biofilm analysis. Each section highlights the most common methods, including literature references, to help novice biofilm researchers make choices which commensurate with their study goals, budget and available equipment.

Keywords: Biofilms; Interdisciplinary research; Qualitative biofilm characterization; Quantitative biofilm characterization.


Conflict of interest statement

CONFLICTS OF INTEREST DISCLOSURE The authors have no conflicts of interested to disclose related to the contents of this work.

Figures

Figure 1
Figure 1
Light microscopy of biofilms. Microscopy images of Pseudomonas aeruginosa (PA01) biofilm growth over time. Light microscopy images show the morphology of PA01 biofilm growth in a tissue culture plate with complete FAB media stained with crystal violet at 1 (A), 3 (B), 6 (C) and 24 (D) hrs after seeding in a static culture. Although light microscopy allows for the visualization of biofilm at all growth stages it has limitations to counting ability as the 3D structure of the film begins to form in later stages as can be observed in these images. Unpublished images by Christina Wilson at Doane University 2016.
Figure 2
Figure 2
Fluorescent microscopy of biofilms. Fluorescent images of biofilms. (A) Merged phase and fluorescent image of Arabidopsis thaliana roots colonized with EGFP expressing PA14. Overlays of fluorescence (green) and phase contrast (gray) images of A. thaliana roots infected with PA14 are shown. Unpublished Image by Cat Foster at Doane University 2014. (B) Confocal microscopy image of Pseudomonas aeruginosa (PA14) biofilm. PA14 growth in vitro two and six hours after inoculation under flow conditions. Viable cells are green (EGFP) and dead cells are red (stained with propidium iodide). Confocal allows for the monitor of x and y plane (central panel) and z axis (bottom and right panel) to characterize biofilm growth. Unpublished Image by Barbara Clement at the Helmholtz Institute for Infectious Disease Research, Susanne Häussler Lab 2014.
Figure 3
Figure 3
Schematic crystal violet assay on biofilms in a microtiter plate. Schematic of crystal violet assay on PA01 biofilm in a microtiter plate at 5 hr after inoculation. Biofilm formulation is difficult to distinguish with the naked eye (A) However CV is an unspecific dye which colocalizes with bacteria making it visible (B). An especially dense region of the biofilm will be formed on the outside edge of each well where the plate, media, and air intersect. This can be seen by a thin dark purple ring (side plate view). The crystal violet absorbed by the bacteria is proportional to the number of cells in the biofilm. Therefore when removed from the biofilm by ethanol and transferred to a clean 96 well plate (C) can be quantified by a UV-Vis plate reader (D). Unpublished data obtained by Christina Wilson at Doane University 2016.
Figure 4
Figure 4
Schmatic crystal violet assay of biofilms in a CDC reactor. Crystal Violet (CV) Assay of PA01 biofilm in a CDC Reactor. (A) Schematic of the assay repeated at each time point for development of growth curve. First, the biofilm is grown on coupons in the CDC reactor. After removal, the biofilm is treated with CV which clings to the bacteria surface until washed with ethanol. The absorbance (optical density) of the ethanol wash is measured at 600 nm as a surrogate for biofilm growth. Unpublished images obtained by Christina Wilson and Helena Valquier-Flynn at Doane University 2016. (B) Optical density (OD)-time data for the growth of a biofilm cell culture of PA01 on a glass surface. The cells are in the exponential growth (“log”) phase. Uncertainty in the OD measurements is less than or equal to the circle size. The solid line is a fit to an exponential function. The inset shows the same data and fit using a semi-log plot demonstrating how the exponential growth curve becomes linear when the log of optical density is plotted against time. The Pseudomonas aeruginosa (PA) biofilm was grown in 0.25% glucose (GL) and minimal media (MM). Unpublished data obtained by Chris Wentworth and Jeniffer Caballero at Doane University 2015.
Figure 5
Figure 5
Images of biofilm stained with tetrazolium salt. Representative images of biofilm growth visualized with insoluble formazan derived from tetrazolium salt, CTC. Growth of biofilm on glass slide (A) has visible to the naked eye biofilm formation after 48 hrs growth in the drip flow biofilm reactor and staining with CTC (red) and DAPI (yellow). The biofilm can further be observed with fluorescent microscopy to qualitatively characterize biofilm shape and quantify area of coverage on glass slide (B) at low magnification and viability quantification with CTC derived fluorescent formazan only staining live cells (C) and DAPI staining all cells (D) at high magnification. Scale Bar C and D=200 μm. Unpublished images obtained by Jasmin Sandoval at Doane University 2016.
Figure 6
Figure 6
Quartz crystal microbalance biofilm reactor. The openQCM© test chamber with attached inflow and outflow tubing for media. Pictures of the (A) top, (B) front view and (C) inside the flow chamber including the quartz crystal and holder of the openQCM© test chamber. The chamber contains the required electronics in its base. (D) A cartoon of the flow cell configuration where biofilm would deposit on the crystal for biofilm quantification [100].
Figure 7
Figure 7
Image J quantification of bacterial colonies from a biofilm (A) Schematic of biofilm collection from a drip flow reactor on a glass slide suspended in media and plated for colony counting. (B) Photograph of an agar plate with bacterial colonies. The photograph was analyzed with ImageJ so that colonies are black and the background is white in order to achieve maximum contrast between background and colony (left). In this case the program determined that the average size of a single colony was 108.16 pixels. The largest single colony was 135 pixels. If clusters were divided by average size of a colony, 91 colonies were counted. ImageJ was set up so that colonies are black and the background is grey in order to achieve minimal reflectance and uniformity between the background and the colony (right). In this case, if colony clusters were divided by the average size of a colony, 93 colonies were counted.

References

    1. McBain AJ. In vitro Biofilm Models: An Overview. Adv Appl Microbiol. 2009;69:99–132. - PubMed
    1. Vert M, et al. Terminology for biorelated polymers and applications. Pure Appl Chem. 2012;84:377–410.
    1. Atela M, et al. In-situ biological water treatment technologies for environmental remediation: A review. J Bioremediation Biodegrad. 2016;7:1–5.
    1. Amulya K, et al. Bioremediation Bioeconomy. Elsevier; Netherlands: 2016. Building a bio-based economy through waste remediation: Innovation towards sustainable future; pp. 497–521.
    1. Singh R, et al. Biofilms: Implications in bioremediation. Trends Microbiol. 2006;14:389–397. - PubMed

LinkOut - more resources