. 2018 Jun 1;2(2):218-240.
doi: 10.1162/netn_a_00043. eCollection 2018.

Using network analysis to localize the epileptogenic zone from invasive EEG recordings in intractable focal epilepsy

Affiliations

Using network analysis to localize the epileptogenic zone from invasive EEG recordings in intractable focal epilepsy

Adam Li et al. Netw Neurosci. .

Abstract

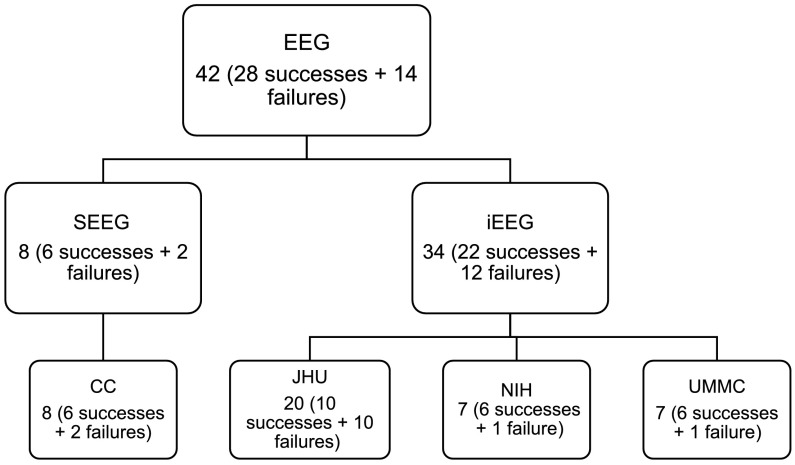
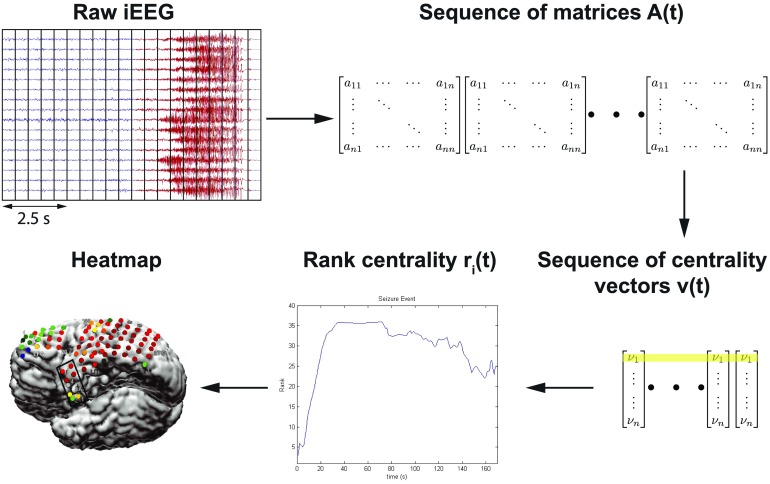
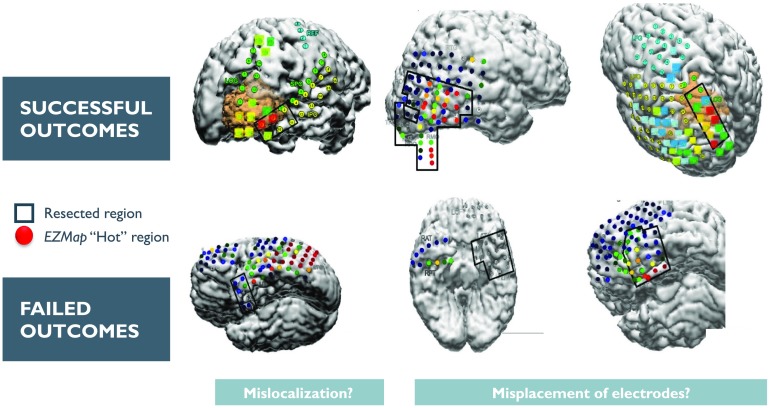
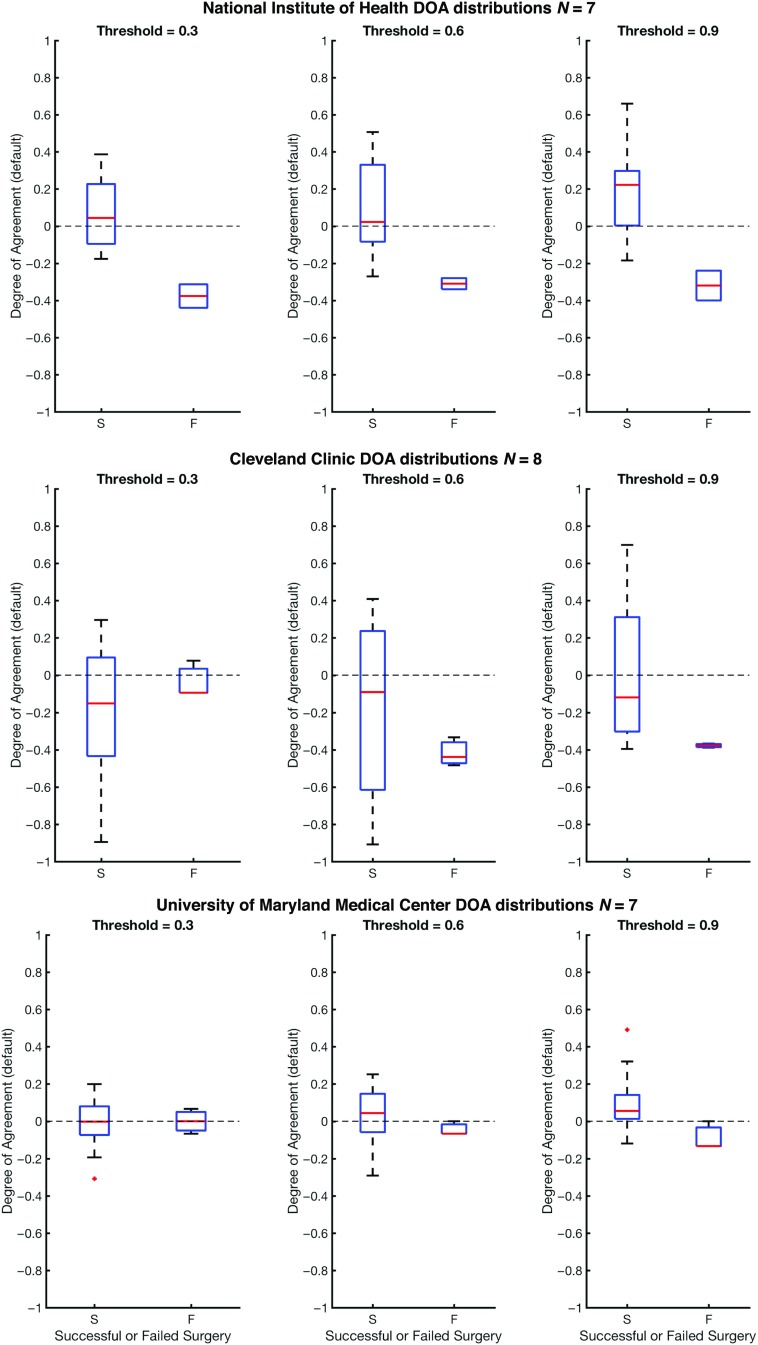
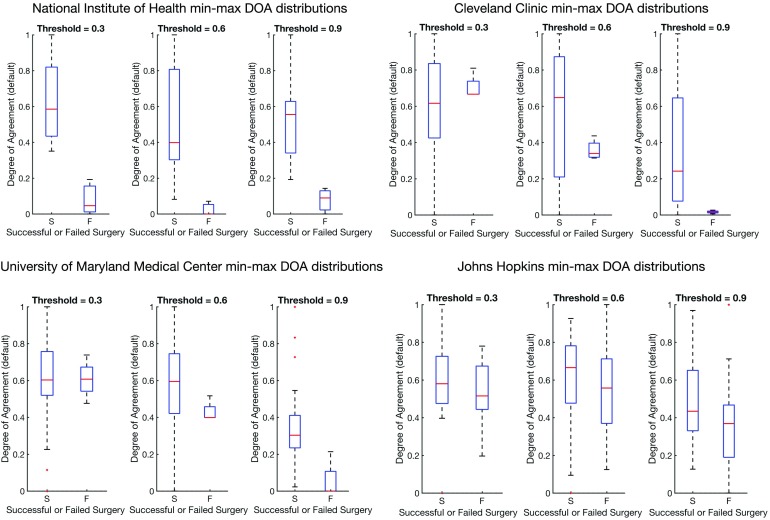
Treatment of medically intractable focal epilepsy (MIFE) by surgical resection of the epileptogenic zone (EZ) is often effective provided the EZ can be reliably identified. Even with the use of invasive recordings, the clinical differentiation between the EZ and normal brain areas can be quite challenging, mainly in patients without MRI detectable lesions. Consequently, despite relatively large brain regions being removed, surgical success rates barely reach 60-65%. Such variable and unfavorable outcomes associated with high morbidity rates are often caused by imprecise and/or inaccurate EZ localization. We developed a localization algorithm that uses network-based data analytics to process invasive EEG recordings. This network algorithm analyzes the centrality signatures of every contact electrode within the recording network and characterizes contacts into susceptible EZ based on the centrality trends over time. The algorithm was tested in a retrospective study that included 42 patients from four epilepsy centers. Our algorithm had higher agreement with EZ regions identified by clinicians for patients with successful surgical outcomes and less agreement for patients with failed outcomes. These findings suggest that network analytics and a network systems perspective of epilepsy may be useful in assisting clinicians in more accurately localizing the EZ.

Keywords: Eigenvector centrality; Focal epilepsy; Intracranial EEG; Network analysis; Seizure onset localization; Spectral models.


Figures

<b>Figure 1.</b>
Figure 1.. Clinical process for implantation of SDE and seizure onset localization. Clinicians expose the brain through a craniotomy, then implant electrodes on the cortical surface of the brain, monitor patient electrocorticography (ECoG) for days/weeks, and then attempt to localize the EZ visually. Clinical teams look at recorded data on computers and annotate signals from certain electrodes and time periods.
<b>Figure 2.</b>
Figure 2.. Patient cohort population for different recording systems, and across different hospital centers. Shows the distribution of successful and failed outcomes for each center.
<b>Figure 3.</b>
Figure 3.. Computational steps for seizure onset localization: the algorithm processes raw ECoG to compute the sequence of adjacency matrix A(t). From this sequence, A(t), it computes the sequence of leading eigenvectors, v(t), as a network centrality measure, the EVC. Algorithm then converts EVC into the sequence of rank centrality r(t). From this sequence, r(t), algorithm computes a heatmap that generates predictions of the EZ. Yellow shading indicates the EVC of the first electrode evolving in time whose rank centrality, r1(t), is illustrated in the plot.
<b>Figure 4.</b>
Figure 4.. (A) First and second PCA component distribution. Points in PC space: 1. Green +: resected electrodes in successful outcomes, 2. Red •: nonresected electrodes in successful outcomes, 3. Black +: resected electrodes in failed outcomes, and 4. Black •: nonresected electrodes in failed outcomes. The plots in each of the four insets show the mean normalized rank centrality signal for points in the regions bounded by orange rectangles. The shaded regions in the plots indicate the 1 standard deviation bounds. The green and red lines in the plots indicate the start and end of a seizure episode, respectively. The yellow circle highlights the region of interest, where there are many green markers. (B) An example of the Gaussian weighting function, where the color represents the weight of an electrode being within the EZ. The four plots in the left-hand side represent the Gaussian weighting function for each quadrant, respectively. The right-hand plot is the sum of the four Gaussian functions, which gives the final Gaussian weighting function.
<b>Figure 5.</b>
Figure 5.. This figure shows an example overlay of the algorithm’s heatmap of likelihood on a brain scan for six patients (three successful and three failed outcomes). The red region shows our predicted onset zone and the black outlines represent where the clinicians performed a resection. The orange, yellow, green, and blue regions represent lower likelihoods for that specific electrode being within the EZ set as predicted by the algorithm.
<b>Figure 6.</b>
Figure 6.. This figure shows degrees of agreement using the degree of agreement index between our algorithm and clinical annotations for successful and failed surgical resections. The dashed line at DOA = 0 represents neither agreement nor disagreement. The red line is the average DOA, and the blue box is the box plot of the DOA; −1 is a perfect disagreement between the algorithm and clinical set, while 1 is a perfect agreement between the algorithm and clinical set.
<b>Figure 7.</b>
Figure 7.. This figure shows distributions of the degree of agreement for every center including JHU after min-max normalization to compare each center on the same scale of success versus failure. Note that min-max normalization scales all distributions between 0 and 1.

References

    1. Bassett D. S., & Bullmore E. (2006). Small-world brain networks. The Neuroscientist, 12(6), 512–523. 10.1177/1073858406293182 - DOI - PubMed
    1. Begley C. E., Famulari M., Annegers J. F., Lairson D. R., Reynolds T. F., Coan S., … Rocca W. A. (2000). The cost of epilepsy in the United States: An estimate from population-based clinical and survey data. Epilepsia, 41(3), 342–351. 10.1111/j.1528-1157.2000.tb00166.x - DOI - PubMed
    1. Berg A. T. (2009). Identification of pharmacoresistant epilepsy. Neurologic Clinics, 27(4), 1003–1013. 10.1016/j.ncl.2009.06.001 - DOI - PMC - PubMed
    1. Berg A. T., & Kelly M. M. (2006). Defining intractability: Comparisons among published definitions. Epilepsia, 47(2), 431–436. 10.1111/j.1528-1167.2006.00440.x - DOI - PubMed
    1. Boonyapisit K., Najm I., Klem G., Ying Z., Burrier C., LaPresto E., … Lüders H. (2003). Epileptogenicity of focal malformations due to abnormal cortical development: Direct electrocorticographic-histopathologiccorrelations. Epilepsia, 44(1), 69–76. 10.1046/j.1528-1157.2003.08102.x - DOI - PubMed

LinkOut - more resources