. 2018 Jun 1;2(2):241-258.
doi: 10.1162/netn_a_00048. eCollection 2018.

Functional and structural connectome properties in the 5XFAD transgenic mouse model of Alzheimer's disease

Affiliations

Functional and structural connectome properties in the 5XFAD transgenic mouse model of Alzheimer's disease

Shelli R Kesler et al. Netw Neurosci. .

Abstract

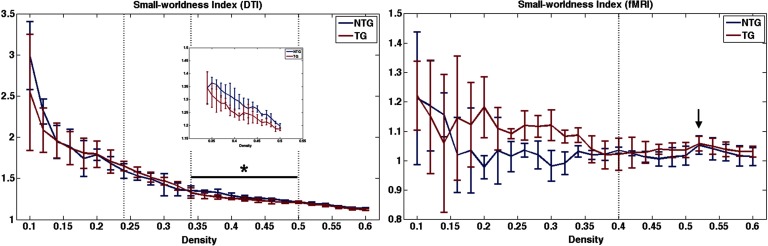
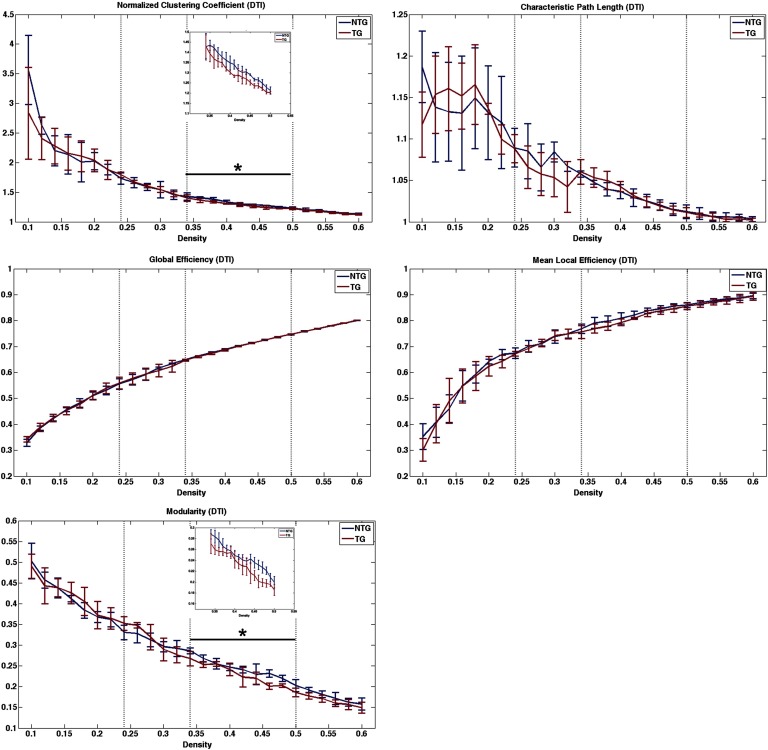
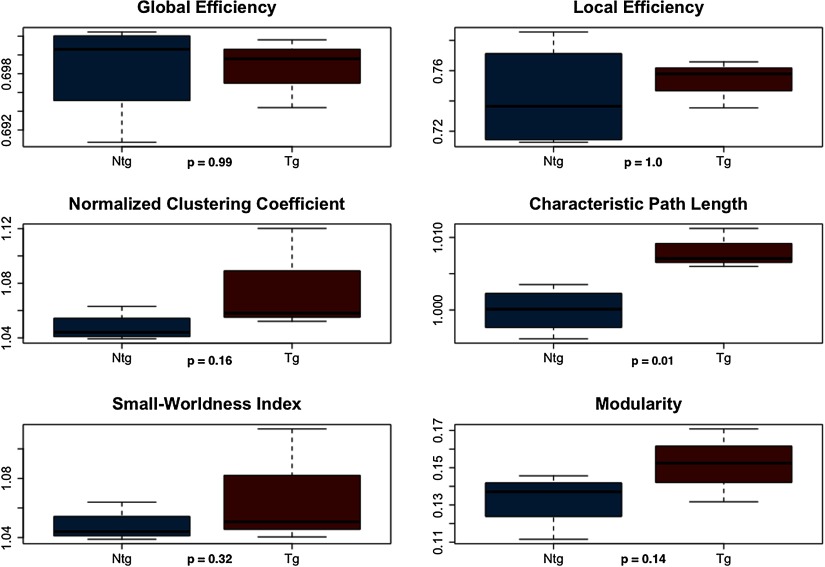
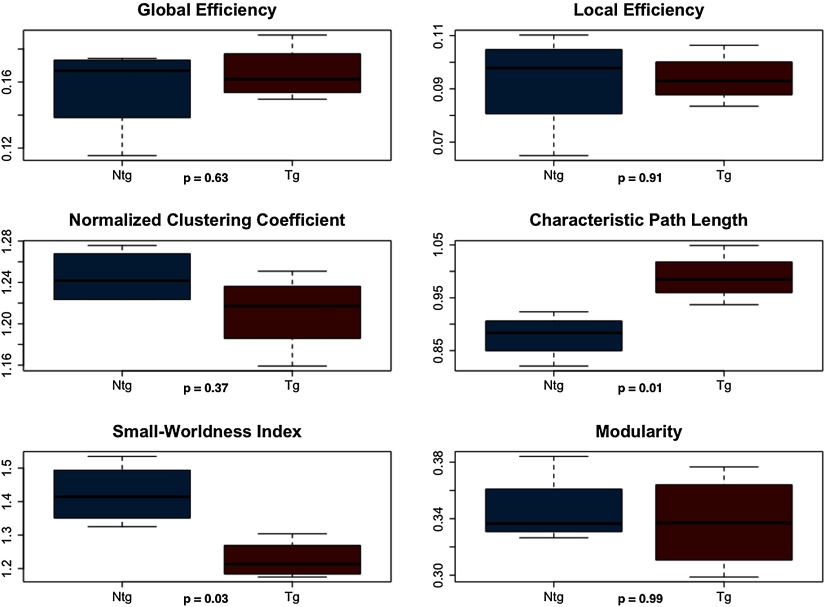
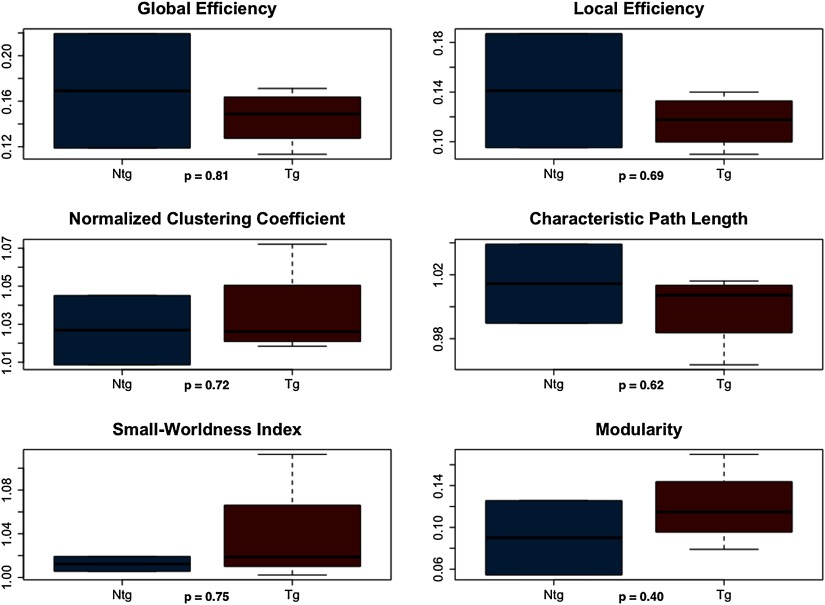
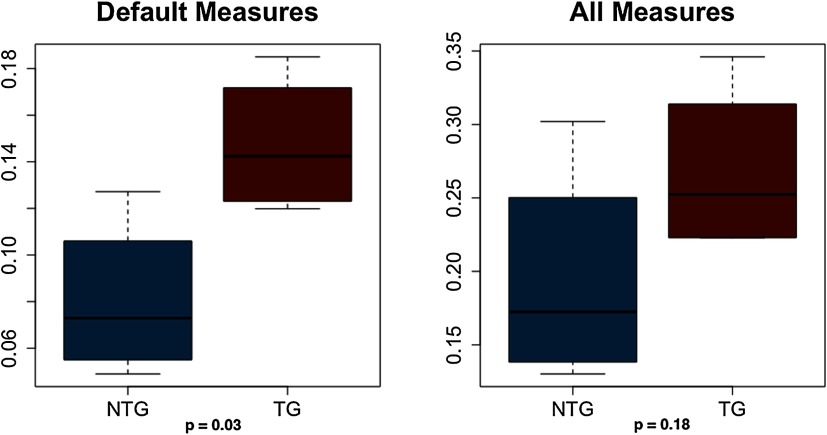
Neurodegeneration in Alzheimer's disease (AD) is associated with amyloid-beta peptide accumulation into insoluble amyloid plaques. The five-familial AD (5XFAD) transgenic mouse model exhibits accelerated amyloid-beta deposition, neuronal dysfunction, and cognitive impairment. We aimed to determine whether connectome properties of these mice parallel those observed in patients with AD. We obtained diffusion tensor imaging and resting-state functional magnetic resonance imaging data for four transgenic and four nontransgenic male mice. We constructed both structural and functional connectomes and measured their topological properties by applying graph theoretical analysis. We compared connectome properties between groups using both binarized and weighted networks. Transgenic mice showed higher characteristic path length in weighted structural connectomes and functional connectomes at minimum density. Normalized clustering and modularity were lower in transgenic mice across the upper densities of the structural connectome. Transgenic mice also showed lower small-worldness index in higher structural connectome densities and in weighted structural networks. Hyper-correlation of structural and functional connectivity was observed in transgenic mice compared with nontransgenic controls. These preliminary findings suggest that 5XFAD mouse connectomes may provide useful models for investigating the molecular mechanisms of AD pathogenesis and testing the effectiveness of potential treatments.

Keywords: Alzheimer’s disease; Connectome; Diffusion tensor imaging; Neuroimaging; fMRI.


Figures

<b>Figure 1.</b>
Figure 1.. Small-worldness index across network densities. For structural connectomes (DTI), vertical lines indicate area under the curve (AUC) windows. Minimum connection density was 0.24 (first dotted vertical line). At a density of 0.34 (second dotted vertical line), the group curves appear to cross over, and therefore this is where we defined the first AUC window. Maximum density was set at 0.5 (third dotted vertical line) for both modalities based on previous research. For functional connectomes (fMRI), the dotted vertical line indicates minimum connection density (0.4). The black bar and asterisk indicate the significant AUC window, and the inset figure shows the curve on a smaller scale for easier viewing. The arrow indicates the only density where all mice showed small-worldness greater than 1. NTG = nontransgenic; TG = transgenic.
<b>Figure 2.</b>
Figure 2.. Structural connectome properties. Dotted vertical lines indicate area under the curve (AUC) windows. The black bar and asterisk indicate the significant AUC window, and the inset figure shows the curve on a smaller scale for easier viewing. NTG = nontransgenic; TG = transgenic.
<b>Figure 3.</b>
Figure 3.. Functional connectome properties at minimum connection density. NTG = nontransgenic; TG = transgenic.
<b>Figure 4.</b>
Figure 4.. Weighted structural connectome properties. NTG = nontransgenic; TG = transgenic.
<b>Figure 5.</b>
Figure 5.. Weighted functional connectome properties. NTG = nontransgenic; TG = transgenic.
<b>Figure 6.</b>
Figure 6.. Power-law fit of cumulative degree distributions. Power-law fit is shown as a plot of log degree (x-axis) by log cumulative degree distribution (y-axis). Left column = nontransgenic (NTG), right column = transgenic (TG), top row = weighted structural connectomes, bottom row = weighted functional connectomes.
<b>Figure 7.</b>
Figure 7.. Correlation coefficients for structural and functional connectivity. Default measures = shortest path length, search information of shortest path length; all measures = default measures plus path transitivity, column-wise z-scored mean first passage time, neighborhood overlap, and matching index. NTG = nontransgenic; TG = transgenic.

References

    1. Achard S., & Bullmore E. (2007). Efficiency and cost of economical brain functional networks. PLoS Computational Biology, 3(2), e17 10.1371/journal.pcbi.0030017 - DOI - PMC - PubMed
    1. Achard S., Salvador R., Whitcher B., Suckling J., & Bullmore E. (2006). A resilient, low-frequency, small-world human brain functional network with highly connected association cortical hubs. Journal of Neuroscience, 26(1), 63–72. 10.1523/JNEUROSCI.3874-05.2006 - DOI - PMC - PubMed
    1. Bai F., Watson D. R., Shi Y., Wang Y., Yue C., YuhuanTeng, … Zhang Z. (2011). Specifically progressive deficits of brain functional marker in amnestic type mild cognitive impairment. PLoS ONE, 6(9), e24271 10.1371/journal.pone.0024271 - DOI - PMC - PubMed
    1. Bassett D. S., & Bullmore E. (2006). Small-world brain networks. The Neuroscientist, 12(6), 512–523. 10.1177/1073858406293182 - DOI - PubMed
    1. Bassett D. S., Bullmore E., Verchinski B. A., Mattay V. S., Weinberger D. R., & Meyer-Lindenberg A. (2008). Hierarchical organization of human cortical networks in health and schizophrenia. Journal of Neuroscience, 28(37), 9239–9248. 28/37/9239 10.1523/JNEUROSCI.1929-08.2008 - PMC - PubMed

LinkOut - more resources