. 2018;14(12):2049-2064.
doi: 10.1080/15548627.2018.1495681. Epub 2018 Sep 14.

The autophagy receptor SQSTM1/p62 mediates anti-inflammatory actions of the selective NR3C1/glucocorticoid receptor modulator compound A (CpdA) in macrophages

Affiliations

The autophagy receptor SQSTM1/p62 mediates anti-inflammatory actions of the selective NR3C1/glucocorticoid receptor modulator compound A (CpdA) in macrophages

Viacheslav Mylka et al. Autophagy. 2018.

Abstract

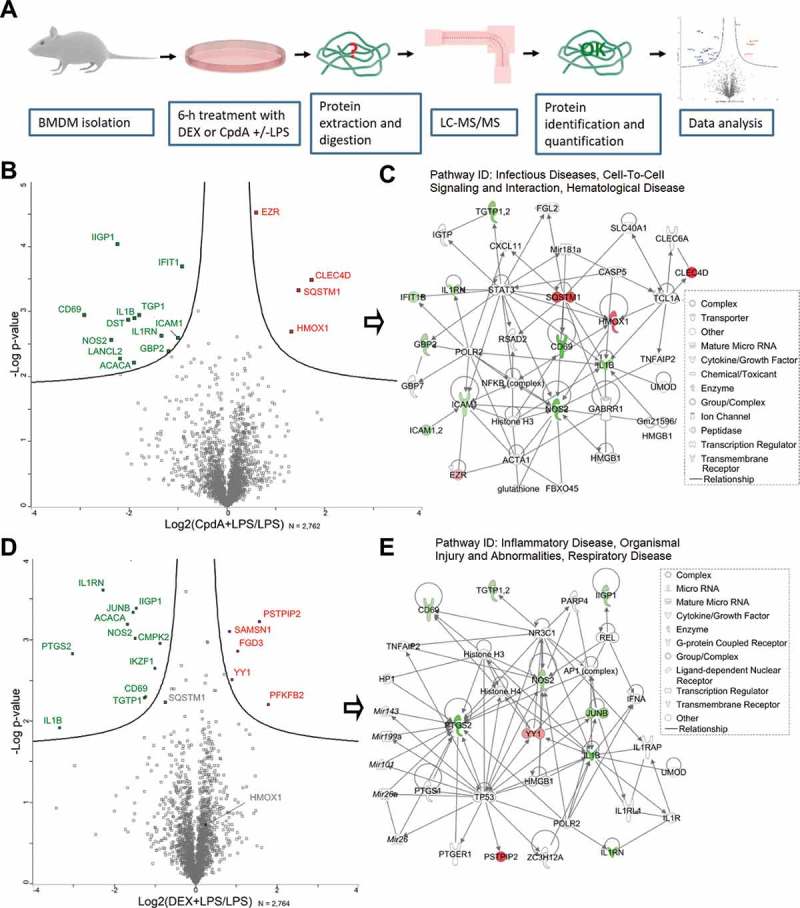
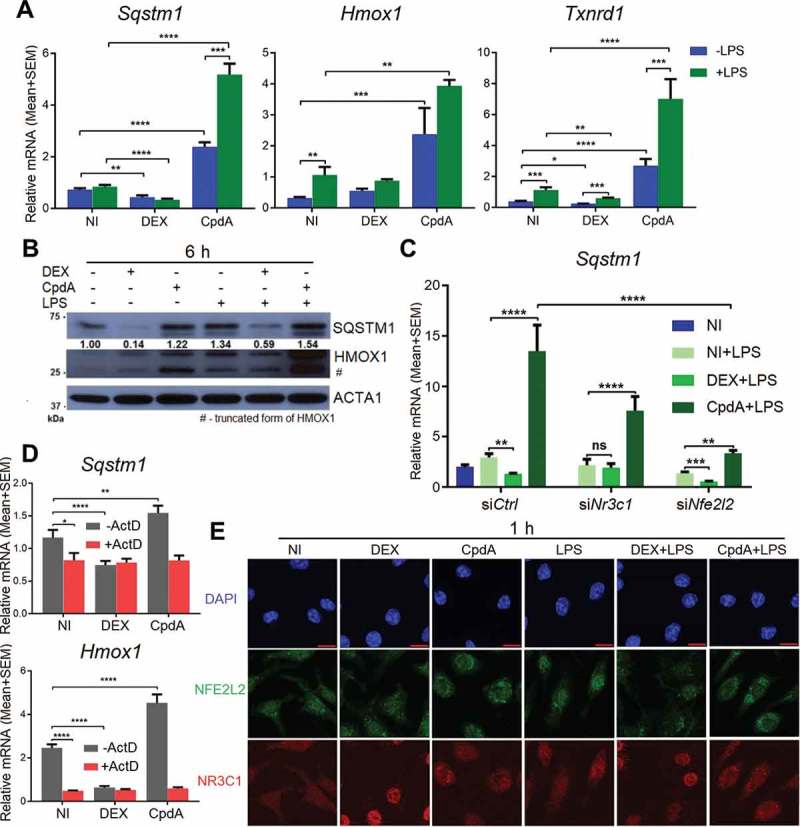
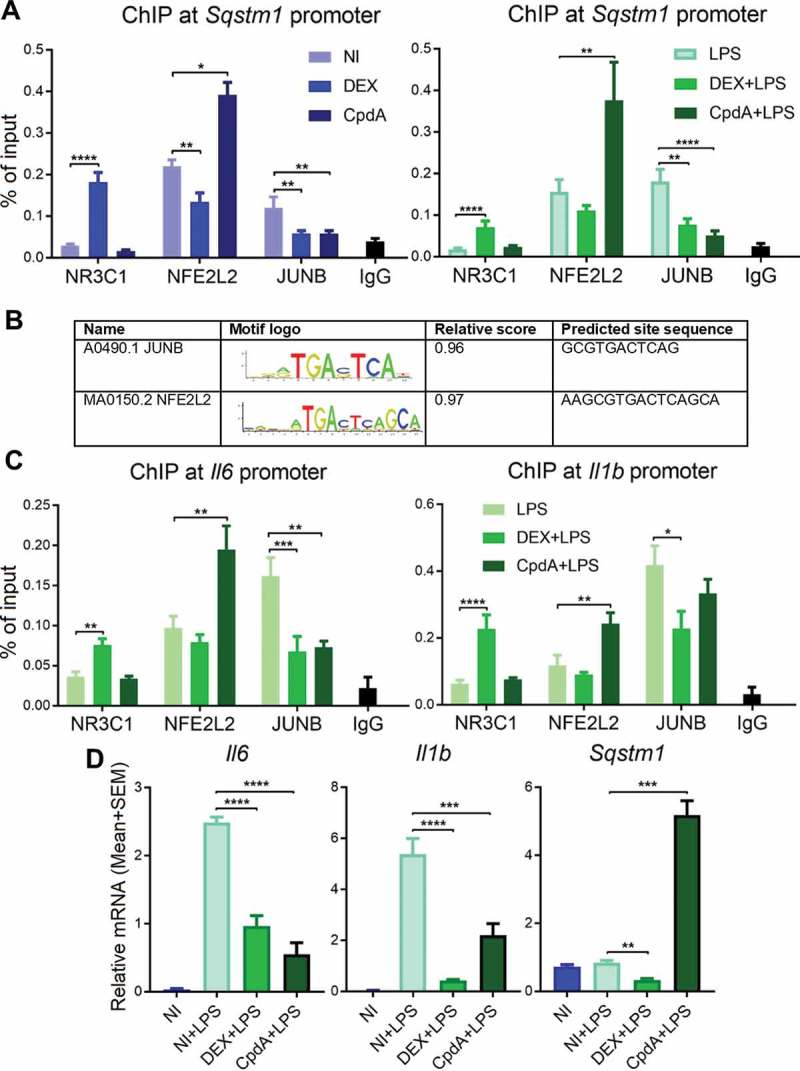
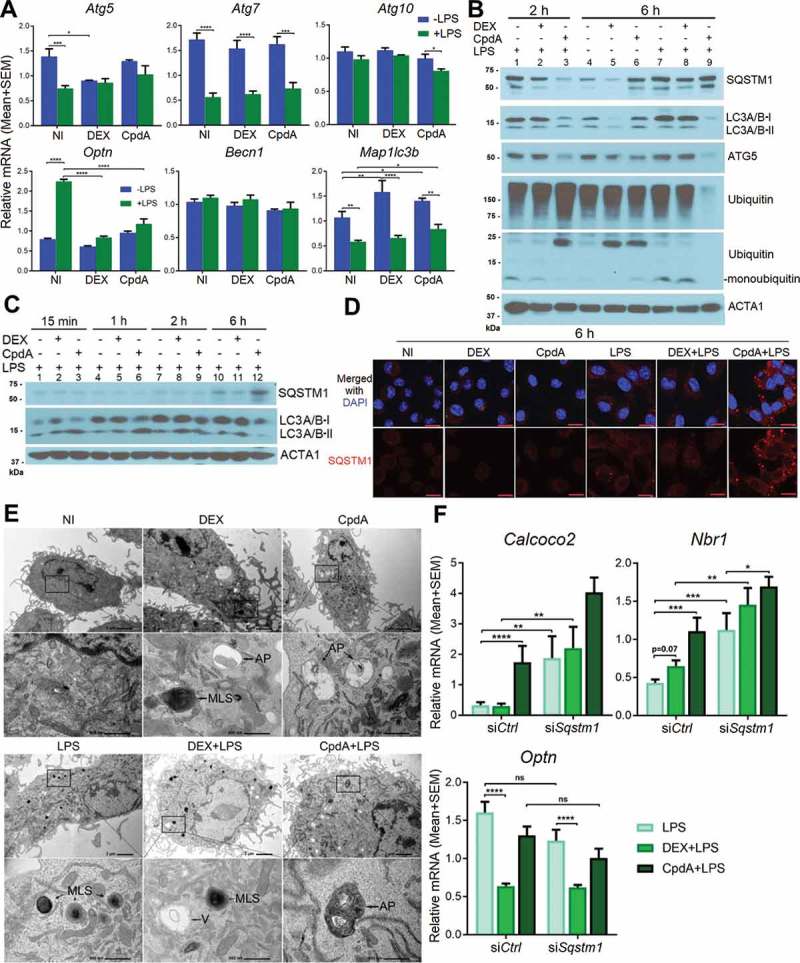
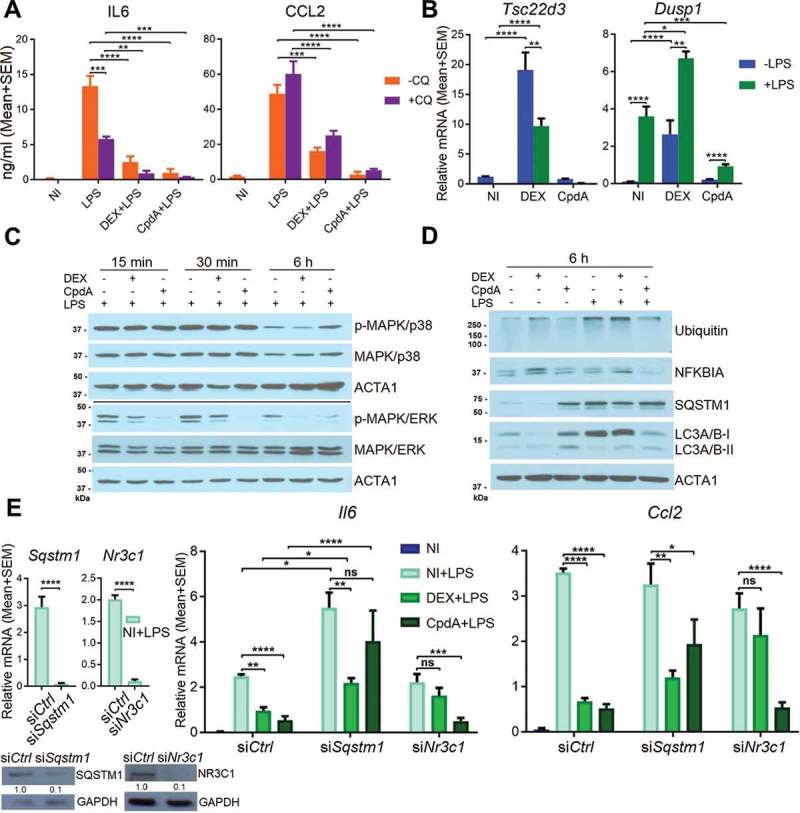
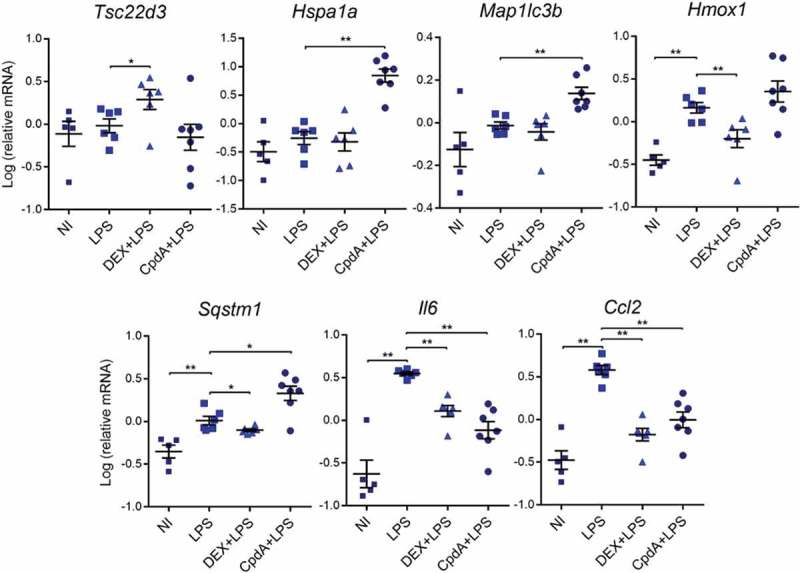
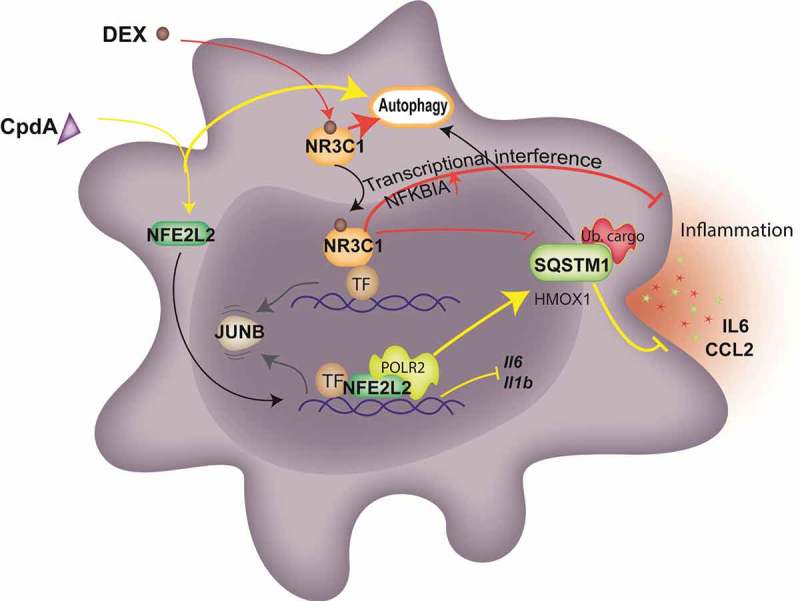
Glucocorticoids are widely used to treat inflammatory disorders; however, prolonged use of glucocorticoids results in side effects including osteoporosis, diabetes and obesity. Compound A (CpdA), identified as a selective NR3C1/glucocorticoid receptor (nuclear receptor subfamily 3, group C, member 1) modulator, exhibits an inflammation-suppressive effect, largely in the absence of detrimental side effects. To understand the mechanistic differences between the classic glucocorticoid dexamethasone (DEX) and CpdA, we looked for proteins oppositely regulated in bone marrow-derived macrophages using an unbiased proteomics approach. We found that the autophagy receptor SQSTM1 but not NR3C1 mediates the anti-inflammatory action of CpdA. CpdA drives SQSTM1 upregulation by recruiting the NFE2L2 transcription factor to its promoter. In contrast, the classic NR3C1 ligand dexamethasone recruits NR3C1 to the Sqstm1 promoter and other NFE2L2-controlled gene promoters, resulting in gene downregulation. Both DEX and CpdA induce autophagy, with marked different autophagy characteristics and morphology. Suppression of LPS-induced Il6 and Ccl2 genes by CpdA in macrophages is hampered upon Sqstm1 silencing, confirming that SQSTM1 is essential for the anti-inflammatory capacity of CpdA, at least in this cell type. Together, these results demonstrate how off-target mechanisms of selective NR3C1 ligands may contribute to a more efficient anti-inflammatory therapy.

Keywords: Autophagy; CpdA; NFE2L2/NRF2; SQSTM1/p62; autophagy receptors; glucocorticoids; inflammation.


Figures

Figure 1.
Figure 1.
LC-MS/MS analysis reveals differentially expressed proteins in BMD macrophages treated with DEX or CpdA under the inflammatory condition. (A) Schematic overview of the mass spectrometry-based shotgun proteomics experiment. (B) Volcano plot with significantly up- (red) or downregulated (green) proteins in CpdA + LPS versus LPS alone. CpdA (10 μM) and 100 ng/ml LPS treatments were used. Statistics by multiple two-sample t-tests, each with a permutation-based FDR of 0.05 and S0 value of 0.1 for truncation. (N = 3). (C) Ingenuity pathway analysis (www.qiagenbioinformatics.com) of significantly regulated proteins from CpdA+ LPS versus LPS comparison. (D) Volcano plot with significantly up- (red) or downregulated (green) proteins in DEX + LPS versus LPS. DEX (1 μM) and 100 ng/ml LPS treatments were used. Statistics by multiple two-sample t-tests, each with a permutation-based FDR of 0.05 and S0 value of 0.1 for truncation. (N = 3). (E) Ingenuity pathway analysis of significantly regulated proteins from DEX+ LPS versus LPS comparison.
Figure 2.
Figure 2.
CpdA induces while DEX suppresses a subset of NRF2-dependent genes in macrophages. (A) qPCR analysis of BMDMs treated with vehicle, 1 μM DEX, 10 μM CpdA and 100 ng/ml LPS for 6 h. Gene expression levels were normalized to Ppia/cyclophilin and Rn18s using qbase+ . Statistical analysis was done using two-way ANOVA and Dunnett’s test (*p < 0.05, **p < 0.01, ***p < 0.001, ****p < 0.0001, N = 4). NI, non-induced. (B) Immunoblotting of BMDMs treated with 1 μM DEX, 10 μM CpdA and 100 ng/ml LPS for 6 h. Densitometry was done using ImageJ. The SQSTM1 signal is normalized to ACTA1/actin. kDa, kilodaltons. (C) qPCR analysis of BMDMs treated with 1 μM DEX, 10 μM CpdA and 100 ng/ml LPS for 6 h after Nr3c1 and Nfe2l2 were knocked down for 50 h. Statistics by two-way ANOVA and Dunnett’s test (*p < 0.05, **p < 0.01, ***p < 0.001, ****p < 0.0001, N = 4, bars represent mean+ SEM). (D) qPCR analysis of BMDMs treated with 1 μM DEX, 10 μM CpdA and 10 μg/ml of the transcriptional inhibitor actinomycin D for 6 h. Statistics by two-way ANOVA and Dunnett’s test (**p < 0.01, ****p < 0.0001, N = 4). (E) Representative NFE2L2 (green) and NR3C1 (red) staining in BMDM cells after 1 h treatment with vehicle, 1 μM DEX, 10 μM CpdA and 100 ng/ml LPS (scale bar: 10 μm).
Figure 3.
Figure 3.
DEX recruits NR3C1 whereas CpdA recruits NFE2L2 to Sqstm1, Il6 and Il1b promoters. BMDMs were treated with vehicle, 1 μM DEX, 10 μM CpdA and 100 ng/ml LPS for 1 h. Recruitment of NR3C1, JUNB and NFE2L2 to (A) Sqstm1 or (C) Il6 and Il1b promoters was measured using qPCR after immunoprecipitation with the respective antibodies. Normal rabbit IgG (pool of chromatin from NI, DEX and CpdA treatments) served as a negative control. Statistical analysis was done using two-way ANOVA and Dunnett’s test (*p < 0.05, **p < 0.01, ***p < 0.001, ****p < 0.0001, N = 3 or 4, bars represent mean+ SEM). NI, non-induced. (B) in silico analysis of murine and human Sqstm1 promoter binding sites from ChIP-qPCR using JASPAR database (jaspar.genereg.net). (D) qPCR analysis of BMDMs treated with vehicle, 1 μM DEX, 10 μM CpdA and 100 ng/ml LPS for 6 h. Gene expression levels were normalized to Ppia/cyclophilin and Gapdh using qbase+ . Statistical analysis was done using one-way ANOVA and Dunnett’s test (**p < 0.01, ***p < 0.001, ****p < 0.0001, N = 5) .
Figure 4.
Figure 4.
DEX and CpdA induce autophagy in macrophages. (A) qPCR analysis of BMDM treated with vehicle, 1 μM DEX, 10 μM CpdA and 100 ng/ml LPS for 6 h. Gene expression levels were normalized to Ppia/cyclophilin and Gapdh using qbase+ . Statistical analysis was done using two-way ANOVA and Dunnett’s test (*p < 0.05, **p < 0.01, ***p < 0.001, ****p < 0.0001, N = 4). NI, non-induced. (B, C) Immunoblotting of BMDM treated with 1 μM DEX, 10 μM CpdA and 100 ng/ml LPS for 15 min, 1 h, 2 h and 6 h. ACTA1/actin served as a loading control. kDa, kilodaltons. (D) Representative SQSTM1 (red) imaging in BMDM cells after 6-h treatment with vehicle, 1 μM DEX, 10 μM CpdA and 100 ng/ml LPS (scale bar: 10 μm). (E) Ultrastructural investigation of BMDM by TEM after 2-h treatment with 1 μM DEX, 10 μM CpdA and 100 ng/ml LPS. Autophagic phenotypes upon DEX treatment were characterized by the presence of myelin-like structures and autophagosomes. Autophagic phenotypes upon CpdA treatment were characterized by a strong vacuolization and presence of autophagosomes. V, vacuoles; MLS, myelin-like structures; AP, autophagosomes. (F) qPCR analysis of BMDMs treated with 1 μM DEX, 10 μM CpdA and 100 ng/ml LPS for 6 h after Sqstm1 was knocked down for 50 h. Statistical analysis was done using two-way ANOVA and Dunnett’s test (*p < 0.05, **p < 0.01, ***p < 0.001, ****p < 0.0001, N = 6). .
Figure 5.
Figure 5.
Sqstm1 knockdown partially abolishes CpdA-induced suppression of Ccl2 and Il6 genes. (A) CCL2 and IL6 ELISA from the medium of BMDMs after 30 min 10 μM chloroquine (CQ) pretreatment and then 6 h treatment with 1 μM DEX, 10 μM CpdA, 100 ng/ml LPS and 10 μM CQ for 6 h. (N = 3). NI, non-induced. (B) qPCR analysis of BMDMs treated with 1 μM DEX, 10 μM CpdA and 100 ng/ml LPS for 6 h. (C, D) Immunoblotting of BMDM treated with 1 μM DEX, 10 μM CpdA and 100 ng/ml LPS for 15 min, 30 min or 6 h. ACTA1/actin served as a loading control. kDa, kilodaltons. (E) qPCR analysis of BMDMs treated with 1 μM DEX, 10 μM CpdA and 100 ng/ml LPS for 6 h after Sqstm1 and Nr3c1 were knocked down for 50 h. Gene expression levels were normalized to Ppia/cyclophilin and Gapdh using qbase+ . Statistical analysis was done using one two-way ANOVA and Dunnett’s test (A, B, E) (*p < 0.05, **p < 0.01, ***p < 0.001, ****p < 0.0001, N = 4 or 5) .
Figure 6.
Figure 6.
The regulation of a subset of stress response genes by CpdA and DEX in acutely inflamed peritoneal macrophages in vivo. qPCR analysis of FACS-sorted peritoneal macrophages. Mice were treated i.p. with vehicle, 2 mg/kg DEX, 15 mg/kg CpdA and 1 mg/kg LPS for 6 h. Gene expression levels were normalized to Ppia/cyclophilin and Gapdh using qbase+ . Statistical analysis was done using a Mann-Whitney test (*p < 0.05, **p < 0.01, N = 5–7). NI, non-induced.
Figure 7.
Figure 7.
The model of NFE2L2- and NR3C1-dependent transcriptional regulation of SQSTM1 following CpdA and DEX and its link to autophagy and inflammation in macrophages. CpdA supports recruitment of NFE2L2 and a transcriptional, NR3C1-independent, upregulation of a subset of NFE2L2 pathway genes. One of those, encoding SQSTM1, is involved in CpdA-mediated suppression of inflammation. Oppositely, NFE2L2 recruitment at Il6 and Il1b promoters results in the downregulation of these genes. DEX mediates NR3C1-dependent transcriptional suppression of Il6 and Il1b genes as a main driver of its potent anti-inflammatory properties, yet is assisted by the upregulation of anti-inflammatory genes and the stabilization of NFKBIA/IκBα. The above-described transcriptional events result in a release of the transcription factor JUNB. Both compounds are able to induce autophagy with slightly different characteristics. CpdA leads to stronger ubiquitination of proteins at early time points, linking to aggregate-autophagy receptor binding [52]. Ub. cargo, ubiquitinated cargo; yellow lines depict activation or suppression by CpdA; red lines depict activation or suppression by DEX; black and gray arrows depict movement and sequence of events.

References

    1. Chatzidionysiou K, Emamikia S, Nam J, et al. Efficacy of glucocorticoids, conventional and targeted synthetic disease-modifying antirheumatic drugs: A systematic literature review informing the 2016 update of the EULAR recommendations for the management of rheumatoid arthritis. Ann Rheum Dis. 2017;76:1102–1107. - PubMed
    1. Fardet L, Petersen I, Nazareth I.. Monitoring of patients on long-term glucocorticoid therapy. Medicine (Baltimore). 2015;94:e647. - PMC - PubMed
    1. Barnes PJ. Glucocorticosteroids. Handb Exp Pharmacol. 2016;237:93–115. - PubMed
    1. Ratman D, Vanden Berghe W, Dejager L, et al. How glucocorticoid receptors modulate the activity of other transcription factors: A scope beyond tethering. Mol Cell Endocrinol. 2013;380:41–54. - PubMed
    1. Desmet SJ, De Bosscher K. Glucocorticoid receptors: finding the middle ground. J Clin Invest. 2017;127:1136–1145. - PMC - PubMed

Publication types

MeSH terms