. 2018 Nov 1;28(11):4090-4104.
doi: 10.1093/cercor/bhy223.

Priority Switches in Visual Working Memory are Supported by Frontal Delta and Posterior Alpha Interactions

Affiliations

Priority Switches in Visual Working Memory are Supported by Frontal Delta and Posterior Alpha Interactions

Ingmar E J de Vries et al. Cereb Cortex. .

Abstract

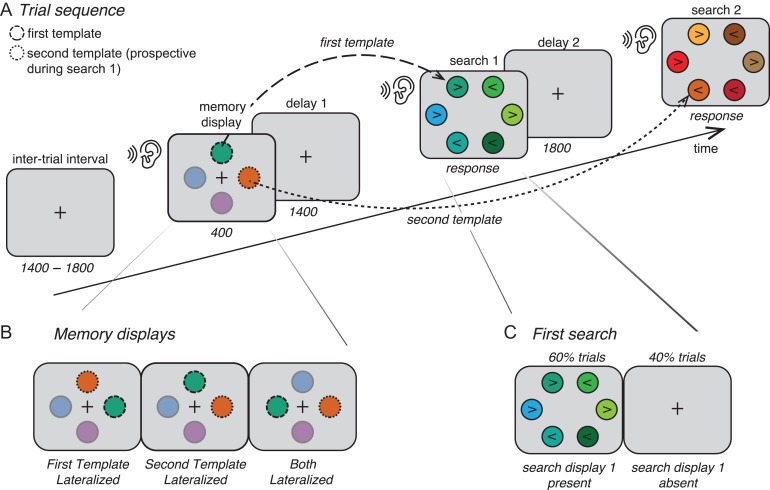
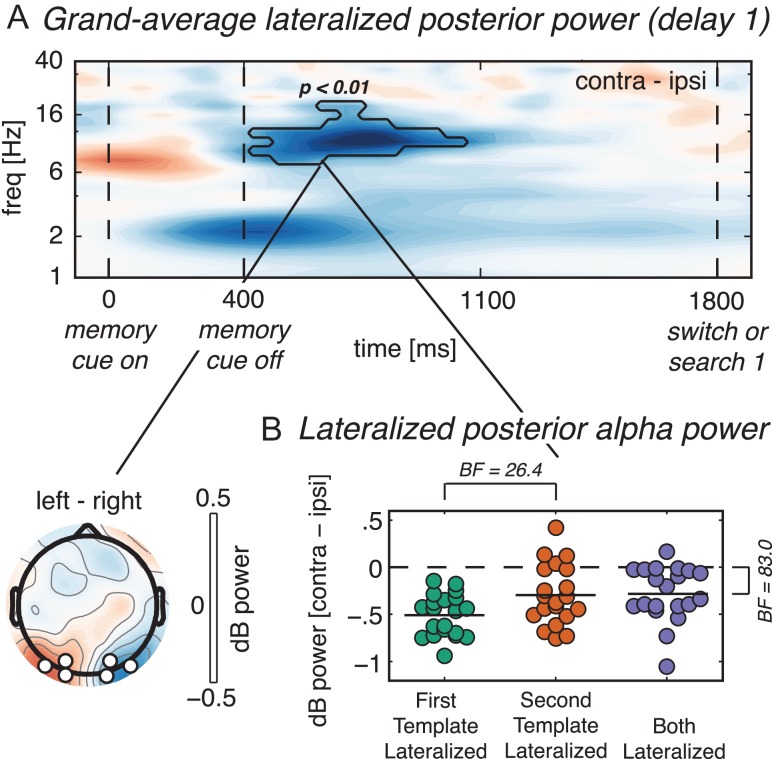
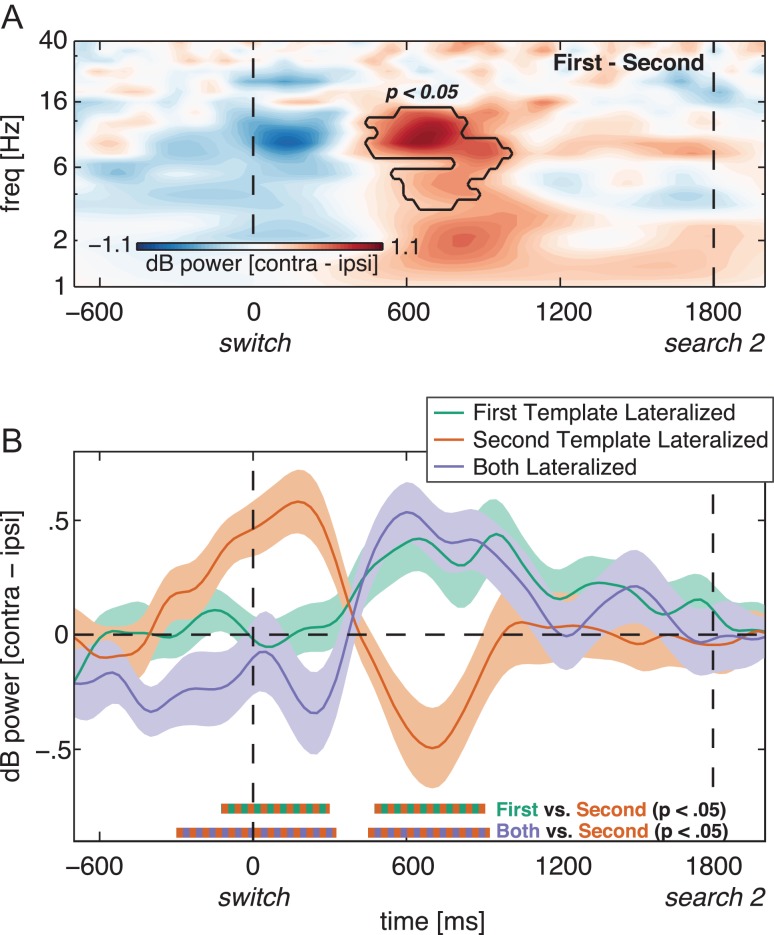
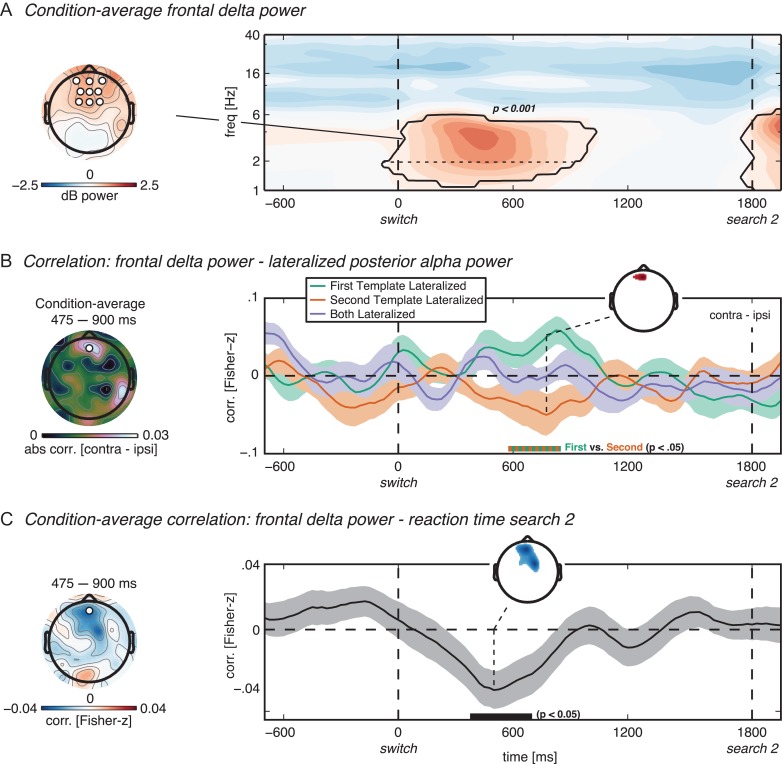
Visual working memory (VWM) distinguishes between representations relevant for imminent versus future perceptual goals. We investigated how the brain sequentially prioritizes visual working memory representations that serve consecutive tasks. Observers remembered two targets for a sequence of two visual search tasks, thus making one target currently relevant, and the other prospectively relevant. We show that during the retention interval prior to the first search, lateralized parieto-occipital EEG alpha (8-14 Hz) suppression is stronger for current compared with prospective search targets. Crucially, between the first and second search task, this difference in posterior alpha lateralization reverses, reflecting the change in priority states of the two target representations. Connectivity analyses indicate that this switch in posterior alpha lateralization is driven by frontal delta/low-theta (2-6 Hz) activity. Moreover, this frontal low-frequency signal also predicts task performance after the switch. We thus obtained evidence for large-scale network interactions underlying the flexible shifting between the priority states of multiple memory representations in VWM.


Figures

Figure 1.
Figure 1.
Task design. (A) Trial sequence. Observers were given two targets to remember for two consecutive search tasks; one for the first search task (first template; dashed outline), and one for the second search task (second template; dotted outline). The onset of every stimulus display was accompanied by an auditory cue (sound/ear symbol). (B) In the First Template Lateralized condition, the first template was presented lateralized (left or right), while the second template was presented on the meridian (up or down). In the Second Template Lateralized condition this was the other way around. In the Both Lateralized condition, both memory items were presented lateralized, at opposite sides (left/right positions were counterbalances across trials in all conditions). (C) In 60% of trials subjects first conducted the first search, followed by the second. In 40% of trials, the first delay period was not followed by the first search display, and the screen remained blank (with a fixation cross) as the second delay period started. However, the auditory cue still sounded, thus indicating that the first search could be abandoned and that observers should switch to the second search task, and look for the second target instead. For illustrative reasons, object sizes and colors differ from the real experiment and the opacity for the irrelevant colors in the memory displays is set at 50%.
Figure 2.
Figure 2.
Behavioral results. Dots represent single subject behavioral data (percentage correct and reaction time in upper and lower panel, respectively), averaged over the 3 possible memory displays (see Fig. 1B). Horizontal line segments represent the mean across subjects. BF = Bayes factor for H1 over H0, with H1 and H0 being a difference or no difference between conditions, respectively.
Figure 3.
Figure 3.
Priority in VWM is reflected in lateralized posterior alpha suppression. (A) Time–frequency plot of lateralized (contralateral minus ipsilateral) power at the average of O1/2, PO3/4 and PO7/8 during the memory display and the first delay period, averaged across all conditions. Black outline indicates a significant difference between contra- and ipsilateral power in the condition average at P < 0.01, cluster corrected. The topography indicates the condition-average scalp distribution of alpha power in the significant time–frequency cluster, on trials with the memory item on the right subtracted from trials with the memory item on the left; black-bordered white disks mark the pre-selected electrodes. (B) Dots represent single subject data of lateralized power averaged over the time–frequency cluster highlighted in (a), with each condition indicated by a different color. Horizontal lines in the dot clouds represent the mean across subjects. BF = Bayes factor for H1 over H0, with H1 and H0 being a condition difference or no condition difference, respectively. The BF of 26.4 indicates a difference between First Template Lateralized and Second Template Lateralized, whereas the BF of 83.0 indicates that Both Lateralized is significantly different from baseline.
Figure 4.
Figure 4.
Neural signature of priority switches between VWM representations. (A) Time–frequency plot of lateralized (contralateral minus ipsilateral) power at the average of O1/2, PO3/4 and PO7/8 during the second delay period (time-locked to the auditory switch cue), for the First Template Lateralized versus Second Template Lateralized condition-contrast. Black outline indicates a significant difference in lateralized power between First Template Lateralized and Second Template Lateralized at P < 0.05, cluster corrected. (B) Time series of lateralized alpha (8–14 Hz) power at the above-mentioned electrodes for First Template (green), Second Template (orange) and Both (purple) Lateralized memory display conditions. The thick lines and shaded areas denote subject mean and standard error of the mean, respectively. Standard errors are calculated for normalized data, i.e., corrected for between-subject variability (Cousineau 2005; Morey 2008). Double-colored thick lines on the x-axis indicate time points with a significant difference between the respective conditions after cluster correction at P < 0.05. Only data from the trials where the first search display was absent (40% of all trials) are depicted in this figure.
Figure 5.
Figure 5.
Frontal delta power exerts top-down control during priority switch in VWM. (A) Condition-average frontal delta/low-theta (hereafter: delta) power. The topography illustrates delta power averaged over the time–frequency cluster indicated by the black outline in the time–frequency plot. The time–frequency plot illustrates power at an average of AFz/3/4, Fz/1/2 and FCz/1/2 (black-bordered white disks in topography) during the second delay period. Only data from the trials where the first search display was absent (40% of all trials) are depicted in this figure, and activity is time-locked to the auditory switch cue. The black outline indicates power significantly different from baseline at P < 0.001, cluster corrected. The black horizontal dotted line within the cluster indicates which part of the cluster (i.e., above 2 Hz, see main text subsection Electrode, Frequency and Time Window Selection) was used for all subsequent analyses involving frontal delta power. (B) Single-trial correlation between frontal delta power (at example electrode AFz as indicated with disc in the topography on the left, and averaged over the significant time–frequency cluster in panel a) and lateralized posterior alpha power (electrodes and frequency range as in Fig. 4B), calculated per time point. Memory display conditions are indicated by color as in Figures 3B and 4B. The topography in the left column shows absolute condition-average correlation values. (C) Within-subject condition-average correlation between frontal delta power (at example electrode AFz, frequency range as in the cluster in panel a) and the reaction time on the second search task. In every time series plot, the lines and shaded areas denote subject mean and standard error of the mean for normalized data, respectively. Horizontal double-colored (B) and black (C) thick lines on the x-axis illustrate the time points with a significant condition-difference (B) or a significant difference from zero (C) after cluster correction at P < 0.05, for the example electrodes used for the time series plots (see main text subsection Results for complete time intervals of the significant clusters). The colored data in the small inset topographies in (B) and (C) indicate which electrodes were part of the significant cluster (P < 0.05) for the condition difference (B) or the condition average (D) at an example time point indicated by the dashed line. The time intervals selected for the large topographies in the left column in b and c were selected for illustrative purposes. Importantly, for panel C all time-points and all 64 electrodes were included in the permutation test. For panel B, only the 9 a priori selected frontal electrodes were included in the permutation test.

Similar articles

Cited by

References

    1. Alekseichuk I, Turi Z, De Lara A, Antal A, Alekseichuk I, Turi Z, De Lara GA, Antal A, Paulus W. 2016. Spatial working memory in humans depends on theta and high gamma synchronization in the prefrontal cortex article spatial working memory in humans depends on theta and high gamma synchronization in the prefrontal cortex. Curr Biol. 26:1513–1521. - PubMed
    1. Bonnefond M, Jensen O. 2012. Alpha oscillations serve to protect working memory maintenance against anticipated distracters. Curr Biol. 22:1969–1974. - PubMed
    1. Bundesen C. 1990. A theory of visual attention. Psychol Rev. 97:523–547. - PubMed
    1. Buzsáki G, Draguhn A. 2004. Neural oscillations in cortical networks. Sci. 304: 1926–1929. - PubMed
    1. Canolty RT, Knight RT. 2010. The functional role of cross-frequency coupling. Trends Cogn Sci. 14:506–515. - PMC - PubMed

Publication types