. 2018 Nov 16;46(20):11030-11047.
doi: 10.1093/nar/gky802.

Non-canonical translation initiation of the spliced mRNA encoding the human T-cell leukemia virus type 1 basic leucine zipper protein

Affiliations

Non-canonical translation initiation of the spliced mRNA encoding the human T-cell leukemia virus type 1 basic leucine zipper protein

C Joaquín Cáceres et al. Nucleic Acids Res. .

Erratum in

Abstract

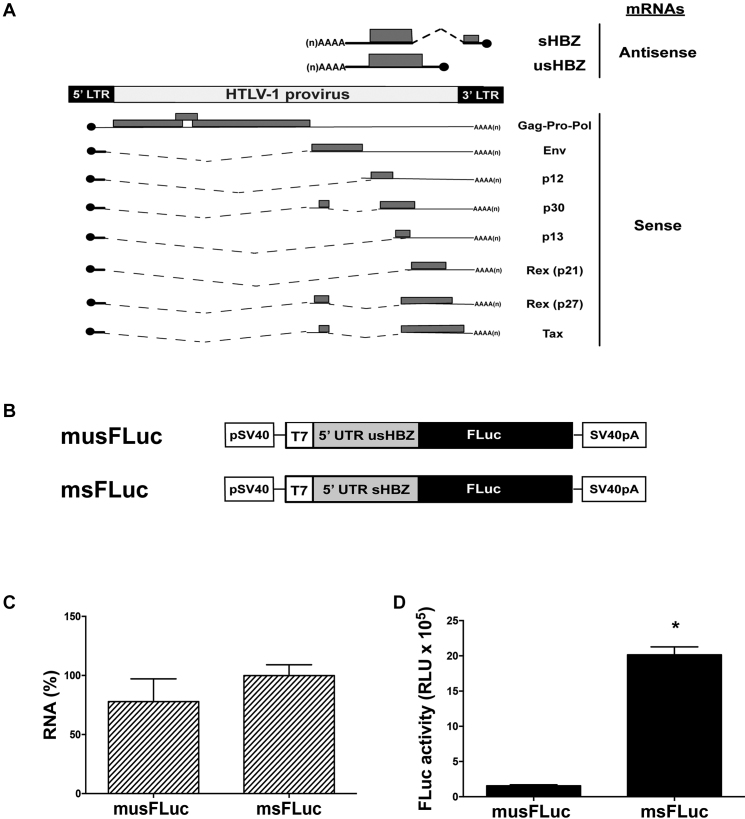
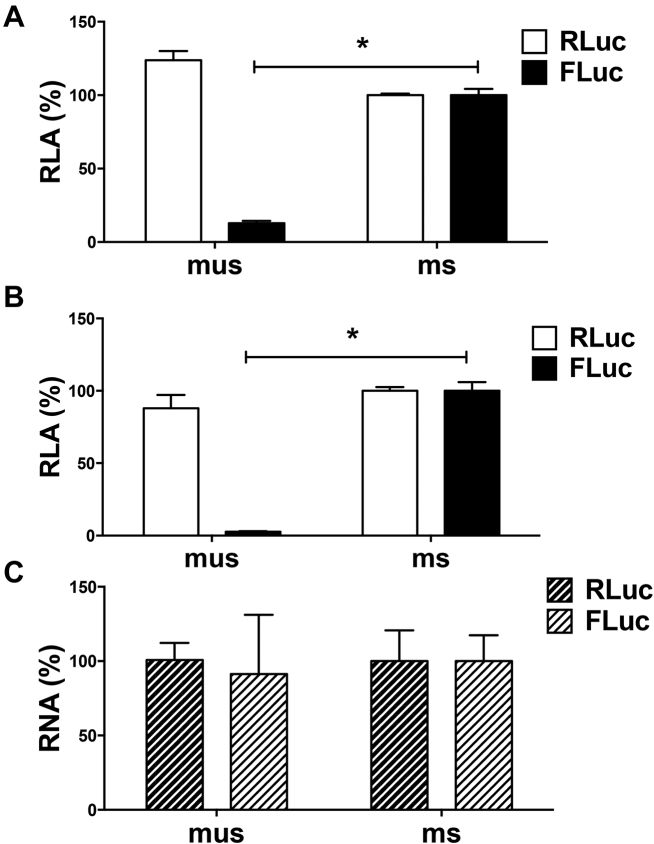
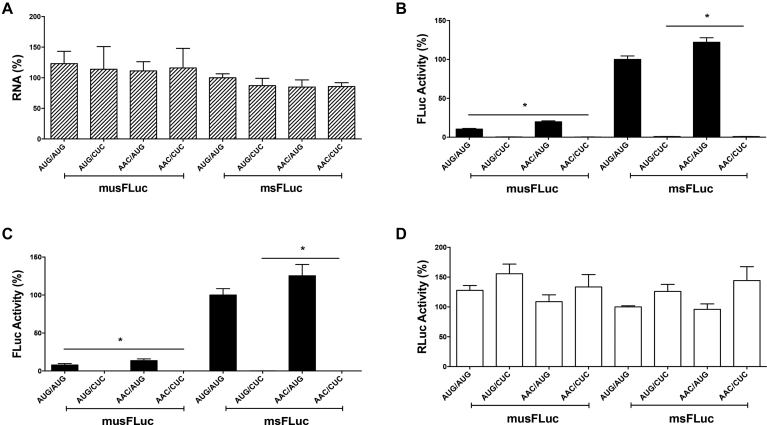
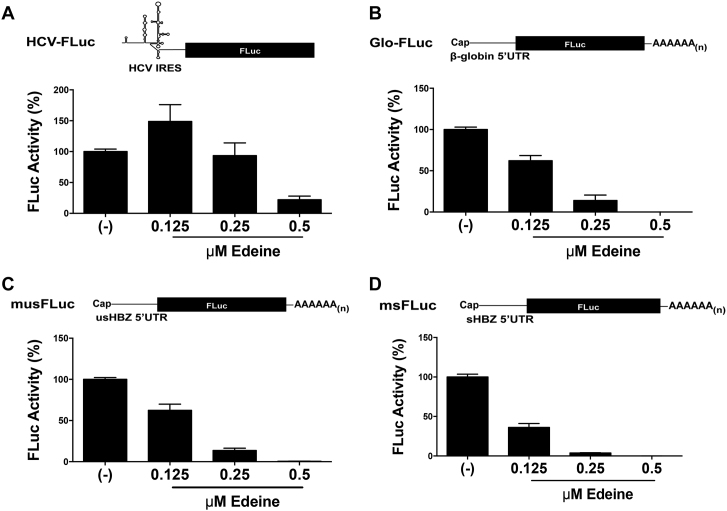
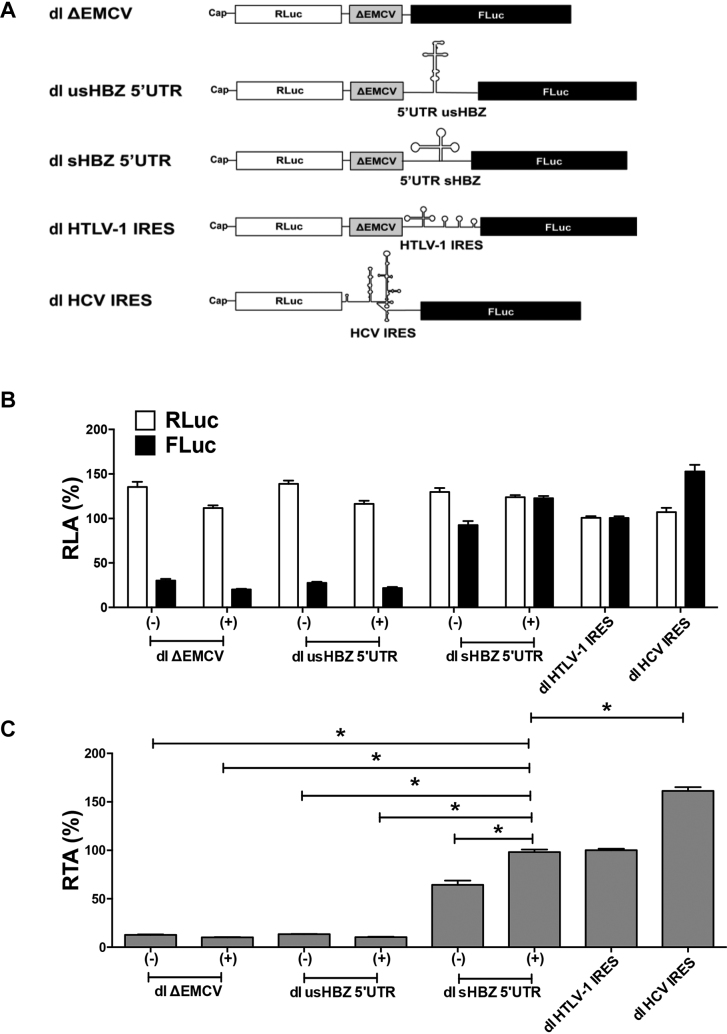
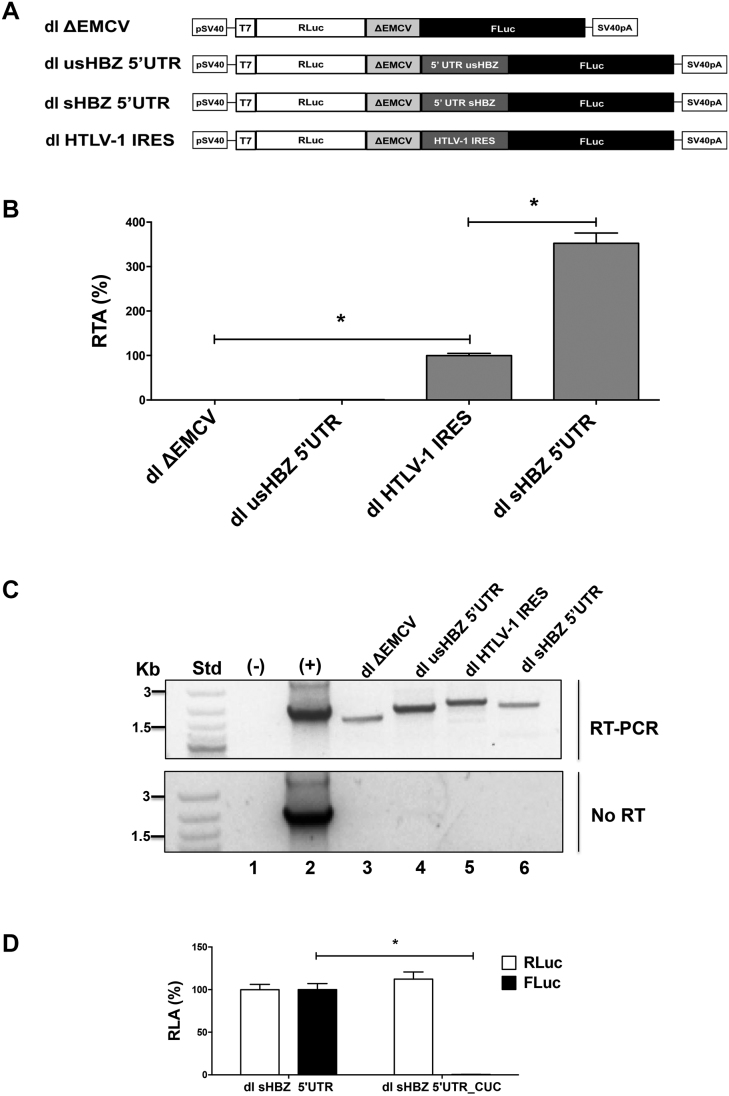
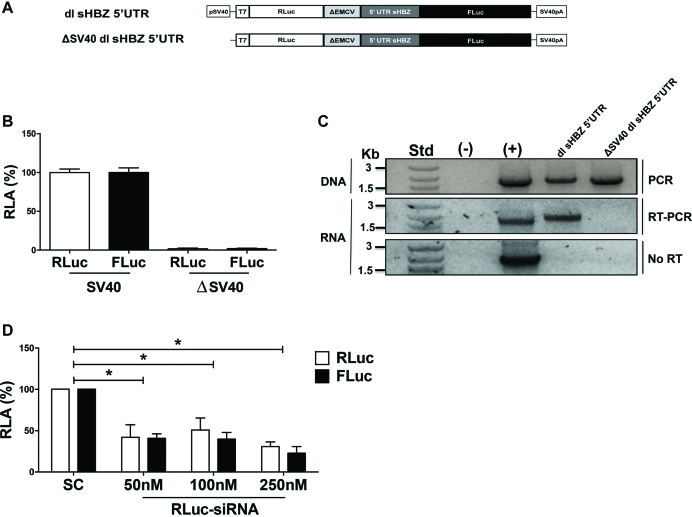
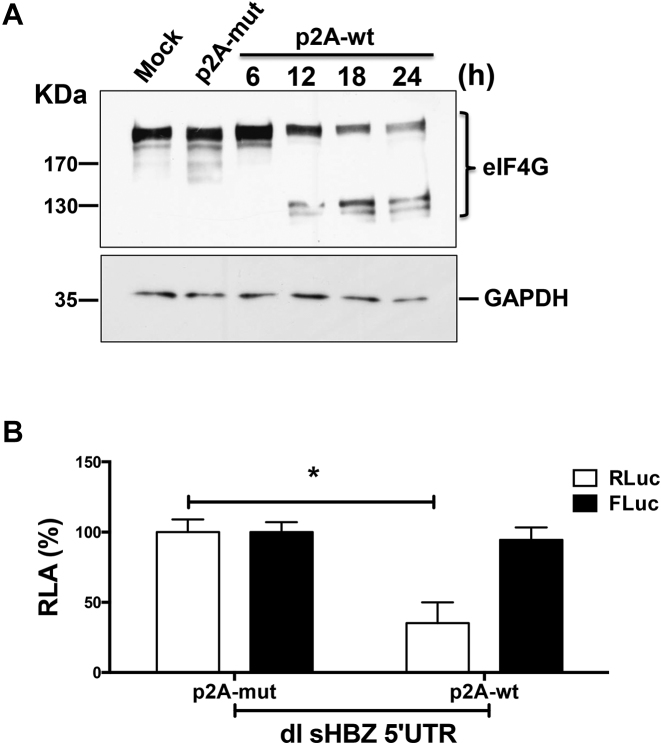
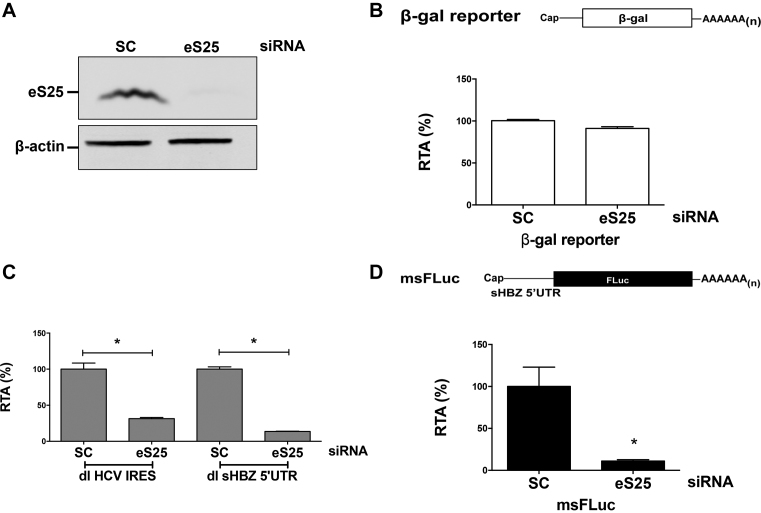
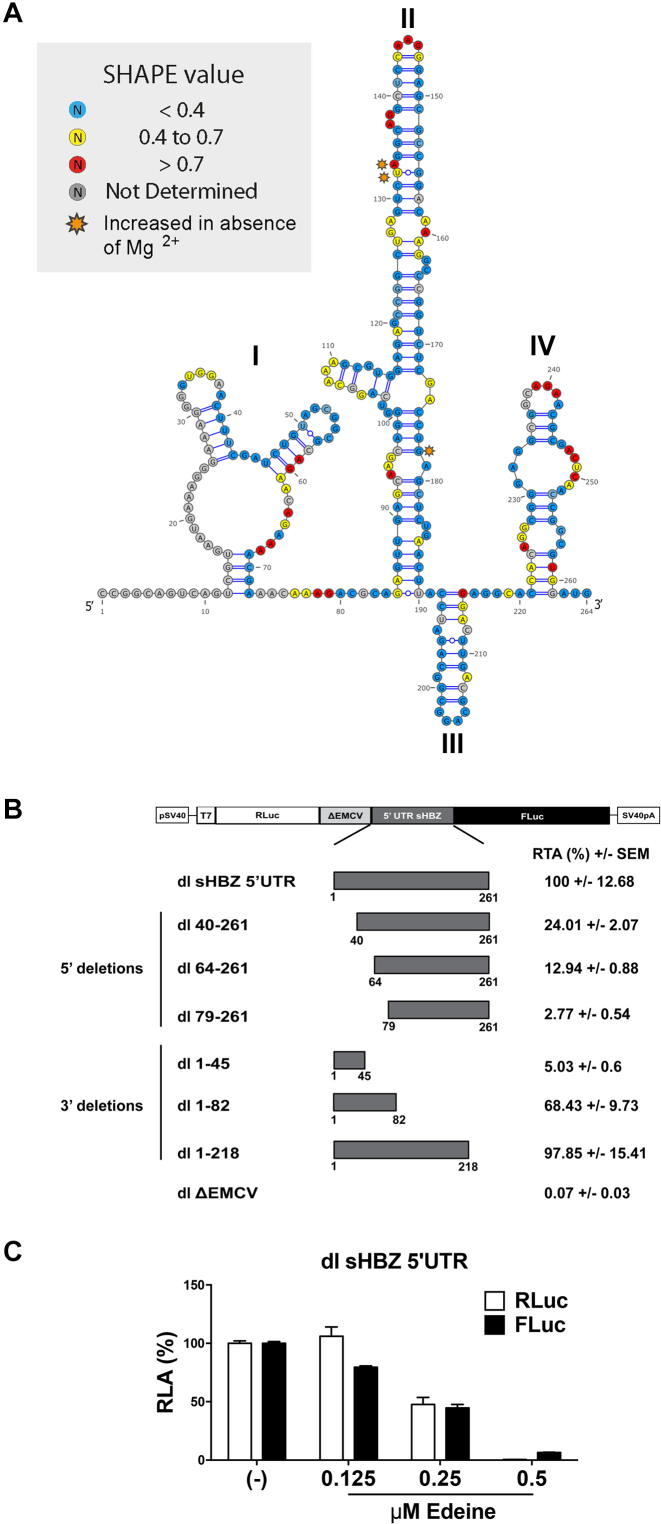
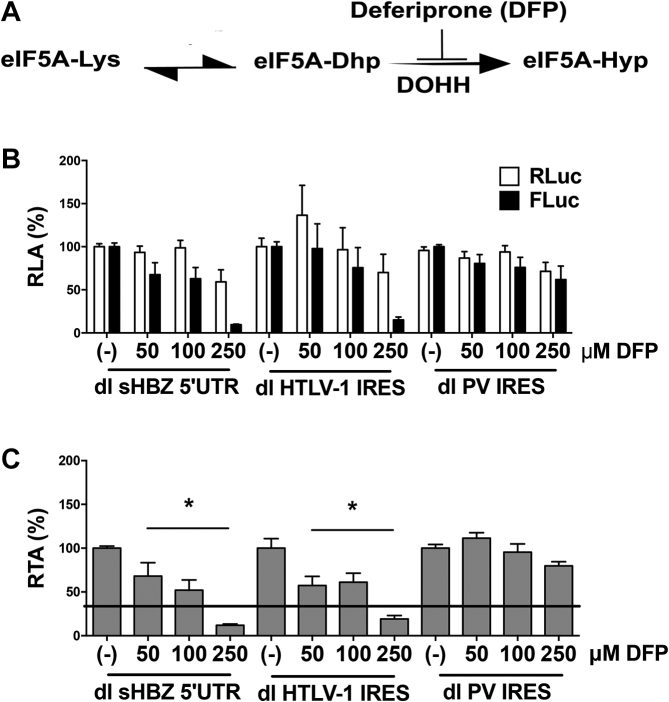
Human T-cell leukemia virus type 1 (HTLV-1) is the etiological agent of adult T-cell leukemia (ATL). The HTLV-1 basic leucine zipper protein (HBZ) is expressed in all cases of ATL and is directly associated with virus pathogenicity. The two isoforms of the HBZ protein are synthesized from antisense messenger RNAs (mRNAs) that are either spliced (sHBZ) or unspliced (usHBZ) versions of the HBZ transcript. The sHBZ and usHBZ mRNAs have entirely different 5'untranslated regions (5'UTR) and are differentially expressed in cells, with the sHBZ protein being more abundant. Here, we show that differential expression of the HBZ isoforms is regulated at the translational level. Translation initiation of the usHBZ mRNA relies on a cap-dependent mechanism, while the sHBZ mRNA uses internal initiation. Based on the structural data for the sHBZ 5'UTR generated by SHAPE in combination with 5' and 3' deletion mutants, the minimal region harboring IRES activity was mapped to the 5'end of the sHBZ mRNA. In addition, the sHBZ IRES recruited the 40S ribosomal subunit upstream of the initiation codon, and IRES activity was found to be dependent on the ribosomal protein eS25 and eIF5A.


Figures

Figure 1.
Figure 1.
In vitro the 5′UTR of the sHBZ mRNA drives translation initiation more efficiently than the 5′UTR of the usHBZ mRNA. (A) Schematic representation of the HTLV-1 provirus and its mRNAs. The transcripts and proteins encoded by a complete HTLV-1 provirus are listed. Sense (below) and antisense (above) transcripts are depicted. For each mRNA, the 5′cap (black circle) and 3′poly(A) tail are shown. The introns that are spliced out for each transcript are indicated as dotted lines, while the ORFs are gray boxes and 5′ and 3′ UTRs are indicated by lines. (B) Schematic representation of the monocistronic DNA reporters used. The HBZ monocistronic FLuc DNA reporters contain the SV40 promoter and polyadenylation signal for their direct transfection in cells, as well as the T7 promoter to generate in vitro run-off transcripts. (C and D) The capped and polyadenylated musFLuc or msFLuc mRNAs were translated in RRL. Total RNA was extracted from RRL at the end of the reaction and quantified by RT-qPCR and presented as relative FLuc RNA levels normalized to the 18S rRNA; musFLuc was reported relative to msFLuc RNA, which was set to 100% (C). FLuc activity was determined and is presented as RLU (D). Values are the mean (+/− SEM) for three independent experiments (n = 3), each performed in duplicate. Statistical analysis was performed using a two-tailed t-test (*P < 0.05).
Figure 2.
Figure 2.
The sHBZ 5′UTR drives translation initiation more efficiently than the 5′UTR of the usHBZ mRNA in cell culture. (A) The msFLuc or musFLuc DNA plasmid was co-transfected into COS-7 cells together with a plasmid encoding RLuc, which was used to control for transfection efficiency. Luciferase activity was measured 8 h after transfection and reported as % RLA to msFLuc activity, which was set to 100%. Values shown are the mean (+/− SEM) for four independent experiments, each performed in duplicate. (B and C) In vitro transcribed capped and polyadenylated musFLuc or msFLuc mRNAs were co-transfected into COS-7 cells with a capped and polyadenylated RLuc mRNA. (B) Luciferase activities measured at 24 h post-transfection and are shown as RLA with the msHBZ RNA set to 100%. (C) RT-qPCR on total RNA extracted from cells was used to quantify the RLuc or FLuc RNA levels. The RNA was normalized to the 18S rRNA level and presented as relative to the msHBZ Fluc RNA, which was set to 100%. Values shown are the mean (+/− SEM) for three independent experiments, each performed in duplicate. Statistical analysis was performed using a two-tailed t-test (*P < 0.05).
Figure 3.
Figure 3.
Upstream initiation codons (uAUGs) have little effect on translation initiation driven by the 5′UTR of the sHBZ or usHBZ mRNAs. The upstream AUGs (uAUGs) in the 5′UTR of the usHBZ and sHBZ mRNAs (Supplementary Figure S1A) were mutated to AAC. When indicated the initiation codon (iAUG) was mutated to CUC. (A and B) The capped and polyadenylated msFLuc (sHBZ 5′UTR uAUG/iAUG), msFLuc CUC (sHBZ 5′UTR uAUG/CUC), musFLuc (usHBZ 5′UTR uAUG/iAUG), musFLuc CUC (usHBZ 5′UTR uAUG/CUC), msFLucAAC (sHBZ 5′UTR AAC/iAUG), msFLuc AAC/CUC (sHBZ 5′UTR AAC/CUC), musFLucAAC (usHBZ 5′UTR AAC/iAUG) or musFLucAAC/CUC (usHBZ 5′UTR AAC/CUC) mRNAs with the uAUG or without (AAC), and with the iAUG or without (CUC) were translated in RRL. (A) Total RNA was extracted from the end of the reaction and quantified by RT-qPCR and presented as relative FLuc RNA levels normalized to the 18S rRNA; musFLuc was reported relative to msFLuc RNA, which was set to 100%. (B) FLuc activity was determined and is reported as (%) FLuc relative to that obtained from the msFLuc (sHBZ 5′UTR uAUG/iAUG) plasmid, which was set to 100%. Values are the mean (+/− SEM) for four independent experiments (n = 4), each performed in duplicate. Statistical analysis was performed using a two-tailed t-test (*P < 0.05). (C and D) The sHBZ or usHBZ DNA plasmids encoding for monocistronic mRNAs, with the uAUG or without (AAC), or with the iAUG or without (CUC) were transfected into COS-7 cells together with the transfection control RLuc plasmid. (C) Luciferase activities were measured 24 h post-transfection and FLuc activities are presented as (%) FLuc activity relative to the FLuc activity obtained from the msFLuc (sHBZ 5′UTR uAUG/iAUG) plasmid, which was set to 100%. (D) RLuc activities from the transfection control, RLuc plasmid are presented relative to that obtained when the msFLuc plasmid was co-transfected (sHBZ 5′UTR uAUG/iAUG), which was set to 100%. Values shown are the mean (+/− SEM) for at least three independent experiments, each performed in duplicate. Statistical analysis was performed by an ANOVA test followed by a Dunnett’s multiple test comparison (*P < 0.05).
Figure 4.
Figure 4.
The usHBZ and sHBZ 5′UTRs rely on 40S scanning for initiation codon recognition. The in vitro transcribed monocistroinic HCV-FLuc (A), capped and polyadenylated Glo-FLuc, which harbors the 5′UTR of scanning-dependent globin mRNA (B), capped and polya.denylated musFLuc (C), or capped and polyadenylated msFLuc (D). mRNAs were in vitro translated in RRL in the absence (−) or the presence of increasing concentrations of edeine (0.125, 0.25 or 0.5 μM) and the FLuc activity was measured after a 90 min reaction as indicated in the ‘Materials and Methods’ section. The FLuc activity is reported as % FLuc relative to the FLuc activity in the absence (−) of drug set to 100%. Values are the mean (+/− SEM) for three independent experiments, each performed in duplicate.
Figure 5.
Figure 5.
The sHBZ 5′UTR can initiate translation in the context of a bicistronic mRNA in vitro. (A) Schematic representation of the dual luciferase (dl) RNAs used. RNAs were in vitro transcribed with a 5′cap structure. The first cistron, RLuc is translated cap-dependently while translation of the second cistron, FLuc is dependent on the presence of an IRES in the intragenic region. The ΔEMCV element serves as a highly structured region and is expected to prevent readthrough or reinitiation following translation of RLuc. (B and C) In vitro transcribed capped dl usHBZ 5′UTR, dl sHBZ 5′UTR or dl ΔEMCV RNAs were translated in RRL (−) or in salt-optimized RRL (+) (Supplementary Figure S2). The control dl HTLV-1 IRES and dl HCV IRES dl RNAs RRL optimized for each IRES activity as described in ‘Materials and Methods’ section. RLA (B) or relative translation activity (RTA) (C) are reported relative to the capped dl HTLV-1 IRES activity, which was set to 100%. Values are the mean (+/− SEM) for at least four independent experiments, each performed in duplicate. RTA corresponds to the FLuc/RLuc ratio that is used as an index of IRES activity. Statistical analysis was performed by an ANOVA test followed by a Dunnett’s multiple test comparison (*P < 0.05).
Figure 6.
Figure 6.
The sHBZ 5′UTR mediates cap-independent translation initiation in cells. (A) Schematic representation of the dual luciferase (dl) vectors used in this assay. All vectors harbored the SV40 promoter and poly(A) signal. (B and C) The dl ΔEMCV, dl HTLV-1 IRES, dl usHBZ 5′UTR or dl sHBZ 5′UTR reporter plasmids were co-transfected into COS-7 cells with the transfection control pcDNA3.1 lacZ plasmid that expresses β-galactosidase from a cap-dependent transcript. Total RNA and protein lysates were harvested from cells 24 h after transfection. (B) RLuc and FLuc activities were determined and normalized to the β-galactosidase activity. Values are expressed as RTA (%) relative to the dl HTLV-1 IRES, which was set to 100%. Values are the mean (+/− SEM) for four independent experiments, each performed in duplicate. Statistical analysis was performed by an ANOVA test followed by a Dunnett’s multiple test comparison (*P < 0.05). (C) RT-PCR was performed on total RNA extracted from transfected cells to detect the full-length dl mRNA using primers that hybridize to the RLuc and the FLuc sequences (top panel). The amplification reaction in absence of DNA or RNA was used as a negative control (−), while plasmid DNA was used as a positive control (+). As an additional control for DNA contamination, the one-step RT-PCR reaction was also conducted in the absence of reverse transcriptase (no RT; lower panel). (D) The dl sHBZ 5′UTR or dl sHBZ 5′UTR_CUC reporter plasmids were co-transfected into COS-7 cells with the transfection control pcDNA3.1 lacZ plasmid that expresses β-galactosidase from a cap-dependent transcript. In the dl sHBZ 5′UTR_CUC plasmid, the FLuc iAUG has been replaced by CUC. RLuc and FLuc activities were determined and normalized to the β-galactosidase activity. Values are expressed as RLA (%) relative to the dl sHBZ 5′UTR, which was set to 100%. Values shown are the mean (+/− SEM) for three independent experiments, each performed in duplicate. Statistical analysis was performed using a two-tailed t-test (*P < 0.05).
Figure 7.
Figure 7.
Cryptic promoter or splicing activity does not account for the FLuc activity. (A) Schematic representation of the bicistronic constructs. The SV40 promoter from dl sHBZ 5′UTR was removed to generate the promoterless (ΔSV40) vector. SV40pA represents the SV40 polyadenylation signal. COS-7 cells were co-transfected with plasmids containing the depicted reporters with the pcDNA3.1 lacZ plasmid. Total DNA, RNA and proteins were extracted from cells 24 h after transfection. (B) RLuc and FLuc activities were measured and normalized to the β-galactosidase activity. Values are expressed as RLA (%) relative to the RLuc and FLuc activities obtained from the dl sHBZ 5′UTR (with the SV40 promoter) plasmid, set to 100%. Values are the mean (+/− SEM) for three independent experiments, each performed in duplicate. (C) PCR was performed on total DNA isolated from the cells (top panel), while an RT-PCR was performed on total RNA. Primers that hybridized to the RLuc and the FLuc sequences were designed to detect the full-length bicistronic mRNA (middle panel). As an additional control, the one-step RT-PCR reaction was conducted in the absence of reverse transcriptase (No RT-PCR, bottom panel). The amplification reaction in absence of DNA or RNA was used as a negative control (−), while plasmid DNA was used as a positive control (+). (D) Approximately 50, 100 or 250 nM of scrambled control siRNA, or an siRNA that targeted the Renilla luciferase ORF, was co-transfected with the dl sHBZ 5′UTR plasmid. RLuc and FLuc activities were measured 24 h post-transfection and expressed relative to the scrambled control siRNA set to 100% (RLA). Values shown are the mean (+/− SEM) for three independent experiments, each performed in duplicate. Statistical analysis was performed by an ANOVA test followed by a Dunnett’s multiple test comparison (*P < 0.05).
Figure 8.
Figure 8.
Translation promoted by the sHBZ 5′UTR is resistant to the proteolytic cleavage of eIF4G by the HRV 2A protease. (A) COS-7 cells were transfected with plasmids expressing the wt (p2A-wt) or mutant (p2A-mut) HRV 2A protease. Total protein was harvested from cells transfected with p2A-wt at 6, 12, 18 and 24 h post-transfection. Protein lysates from cells transfected with the empty vector (Mock) or with the p2A-mut plasmid were harvested 24 h post-transfection. Western analysis was performed using a polyclonal antibody against eIF4GI. The positions of the molecular mass standards (in kDa) are shown. (B) COS-7 cells were transfected with plasmids p2A-wt or p2A-mut together with the dl HBZ 5′UTR plasmid and 24 h post-transfection. RLuc and FLuc activities were measured from cell lysates and expressed as RLA (%) to the activities obtained from the lysates expressing p2A-mut, which was set to 100% (+/– SEM). Values represent the mean (+/− SEM) for three independent experiments each conducted in duplicate. Statistical analysis was performed by an ANOVA test followed by a Dunnett’s multiple test comparison (*P < 0.05).
Figure 9.
Figure 9.
Translation mediated by the sHBZ 5′UTR requires eS25. COS-7 cells were transfected with a scrambled RNA or an siRNA that targeted eS25 mRNA together with either the msFLuc, the β- galactosidase, the dl sHBZ 5′UTR or the dl HCV IRES plasmids. Then 24 h post-transfection, protein lysates were harvested and subjected to western analysis (A), β-galactosidase assays (B) or luciferase assays (C and D) as indicated in ‘Materials and Methods’ section. (A) For western analysis, the membrane was probed with eS25 and β-actin antibodies and imaged using a LI-COR imager. (B) Effects on cap-dependent translation were measured by determining β-galactosidase activity expressed as RTA (%) relative to the scrambled control siRNA, which was set to 100%. Values are the mean (+/− SEM) for nine independent experiments, each performed in duplicate. (C) IRES activity from the dl sHBZ 5′UTR or the dl HCV IRES plasmids with or without eS25 was measured by determining the FLuc activity normalized to the transfection control β-galactosidase (FLuc/β-gal) and expressed as RTA (%) relative to the activity measured in cells transfected with the scrambled siRNA set to 100%. Values are the mean (+/− SEM) for three independent experiments, each performed in duplicate. Statistical analysis was performed by an ANOVA test followed by a Dunnett’s multiple test comparison (*P < 0.05). (D) The effect of eS25 knockdown on in vitro transcribed m7G-capped msFLuc mRNA transfected into COS-7 cells, 48 h post siRNA knockdown was determined by measuring FLuc activity 4 h post-reporter transfection and expressed as RTA (%) relative to COS-7 cells transfected with the scrambled siRNA, which was set to 100%. Values are the mean (+/− SEM) for three independent experiments, each performed in duplicate. Statistical analysis was performed by a two-tailed t-test (*P < 0.05).
Figure 10.
Figure 10.
The sHBZ IRES maps to the 5′end of the 5′UTR. (A) Secondary structure model of the sHBZ 5′ UTR determined by RNA selective 2′ hydroxyl acylation analysis by primer extension (SHAPE) using 1-methyl-7-nitroisatoic anhydride (1M7) or N-methylisatoic anhydride (NMIA) as a modifying agents. The proposed structure is based on the mean SHAPE reactivity from three independent experiments conducted for each modifying reagent. The SHAPE reactivity values for each position using numbering according to the HTLV K30 infectious clone (genbank: L03561) on the sHBZ 5′UTR are indicated for each position on the HBZ 5′UTR according to the color code boxed, with decreased SHAPE reactivity <0.4 (blue), 0.4–0.7 (yellow), increased SHAPE reactivity >0.7 (red) and nucleotides not measured indicated in (gray). Nucleotides that exhibited an increased SHAPE reactivity to 1M7 or NMIA in the absence of Mg2+ are indicated (orange). (B) Dual luciferase plasmids containing the indicated 5′ and 3′ deletions were constructed and transfected into COS-7 cells and luciferase activity was measured 24 h later. The dl ΔEMCV vector was used as a negative control for IRES activity. The results are presented as RTA (%) relative to the dl sHBZ 5′UTR, set to 100%. Values shown are the mean (+/− SEM) for three independent experiments, each performed in duplicate. (C) The m7G-capped in vitro transcribed dl sHBZ 5′UTR RNA reporters were translated in RRL in the absence (−) or the presence of increasing concentrations of edeine (0.125, 0.25 or 0.5 μM). RLuc and FLuc activities were measured and are shown as RLA (%) relative to the luciferase activity obtained in the absence (−) of edeine, set to 100%. Values shown are the mean (+/− SEM) for four independent experiments, each performed in duplicate.
Figure 11.
Figure 11.
Translation initiation mediated by the sHBZ 5′UTR is reduced in the presence of deferiprone (DFP). (A) A diagram of the reaction for hypusine (Hyp) modification, which is added post-translationally to the eIF5A precursor by two consecutive enzymatic steps. First, the enzyme deoxyhypusine synthase catalyzes the transfer of a 4-aminobutyl moiety from the polyamine spermidine to a lysine residue in the eIF5A precursor to form the deoxyhypusine intermediate (eIF5A-Dhp). The enzyme DOHH then catalyzes the irreversible hydroxylation of Dhp to generate the hypusinated version of eIF5A (eIF5A-Hyp). As depicted, DOHH is inhibited by DFP. (B and C) COS-7 cells were co-transfected with either dl sHBZ 5′UTR, dl HTLV1 IRES or dl PV IRES and the transfection control pcDNA3.1-LacZ plasmid. Six hours post-transfection cells were treated with DFP (50, 100 or 250 μM). Total protein lysates were harvested 24 h post-transfection. (B) RLuc and FLuc activities were measured and normalized to β-galactosidase activity. Results are expressed as RLA (%), relative to the untreated control (−) set to 100%. Values shown are the mean (+/− SEM) of at least four independent experiments, each conducted in duplicate. (C) Data presented in (B) were used to determine the FLuc/RLuc ratio and data are presented as RTA (%), relative to the untreated control (−) set to 100%. Statistical analysis was performed by the ANOVA test followed by Dunnet multiple comparison (*P < 0.05).

Similar articles

Cited by

References

    1. Watanabe T. Adult T-cell leukemia: molecular basis for clonal expansion and transformation of HTLV-1-infected T cells. Blood. 2017; 129:1071–1081. - PMC - PubMed
    1. Ma G., Yasunaga J., Matsuoka M.. Multifaceted functions and roles of HBZ in HTLV-1 pathogenesis. Retrovirology. 2016; 13:16. - PMC - PubMed
    1. Zhao T. The role of HBZ in HTLV-1-induced oncogenesis. Viruses. 2016; 8:34 - PMC - PubMed
    1. Murata K., Hayashibara T., Sugahara K., Uemura A., Yamaguchi T., Harasawa H., Hasegawa H., Tsuruda K., Okazaki T., Koji T. et al. . A novel alternative splicing isoform of human T-cell leukemia virus type 1 bZIP factor (HBZ-SI) targets distinct subnuclear localization. J. Virol. 2006; 80:2495–2505. - PMC - PubMed
    1. Cavanagh M.H., Landry S., Audet B., Arpin-Andre C., Hivin P., Pare M.E., Thete J., Wattel E., Marriott S.J., Mesnard J.M. et al. . HTLV-I antisense transcripts initiating in the 3′LTR are alternatively spliced and polyadenylated. Retrovirology. 2006; 3:15. - PMC - PubMed

Publication types

MeSH terms