. 2019 Jan 10;47(1):e1.
doi: 10.1093/nar/gky820.

CRISPR-Cap: multiplexed double-stranded DNA enrichment based on the CRISPR system

Affiliations

CRISPR-Cap: multiplexed double-stranded DNA enrichment based on the CRISPR system

Jeewon Lee et al. Nucleic Acids Res. .

Abstract

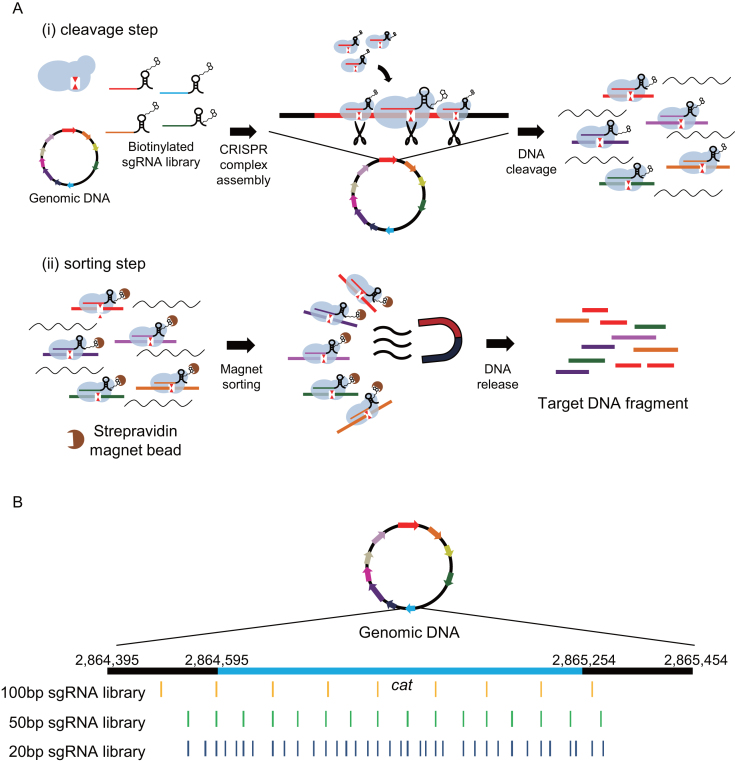
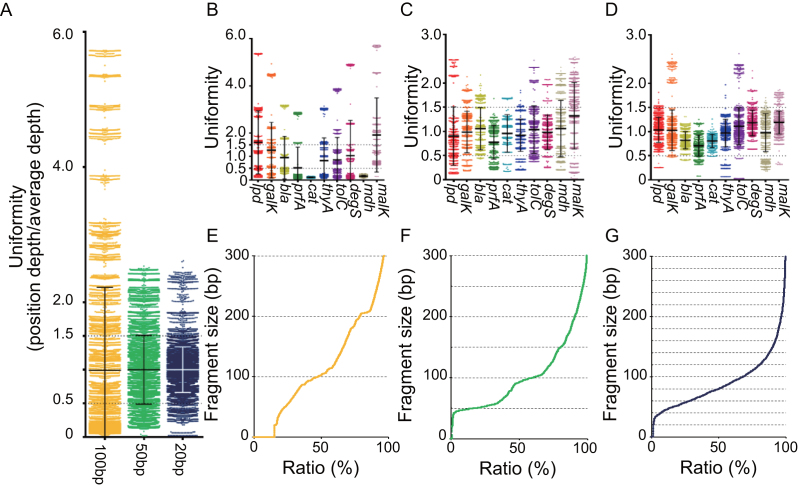
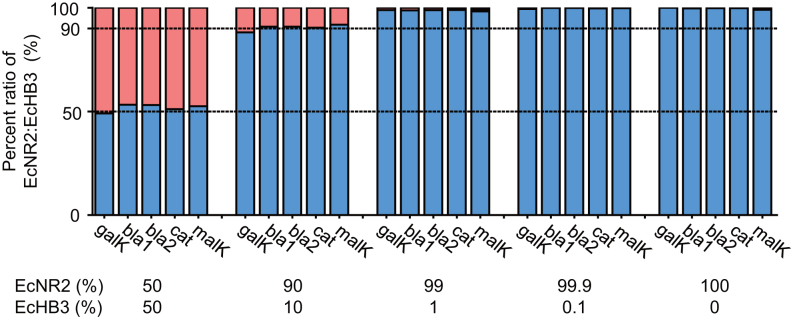
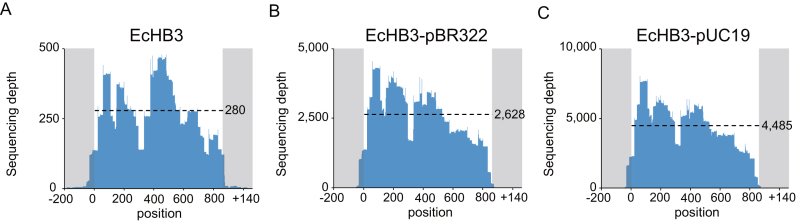
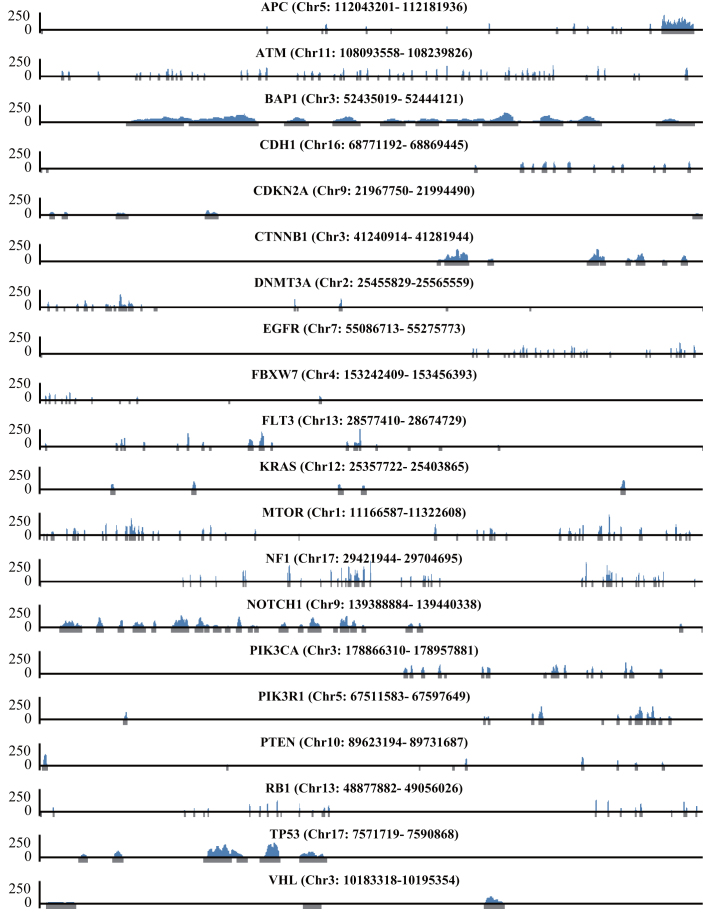
Existing methods to enrich target regions of genomic DNA based on PCR, hybridization capture, or molecular inversion probes have various drawbacks, including long experiment times and low throughput and/or enrichment quality. We developed CRISPR-Cap, a simple and scalable CRISPR-based method to enrich target regions of dsDNA, requiring only two short experimental procedures that can be completed within two hours. We used CRISPR-Cap to enrich 10 target genes 355.7-fold on average from Escherichia coli genomic DNA with a maximum on-target ratio of 81% and high enrichment uniformity. We also used CRISPR-Cap to measure gene copy numbers and detect rare alleles with frequencies as low as 1%. Finally, we enriched coding sequence regions of 20 genes from the human genome. We envision that CRISPR-Cap can be used as an alternative to other widely used target-enrichment methods, which will broaden the scope of CRISPR applications to the field of target enrichment field.


Figures

Figure 1.
Figure 1.
Schematic diagram of CRISPR-Cap and sgRNA target positions. (A) Schematic diagram of the standard CRISPR-Cap procedure. In the cleavage step, SpCas9, a biotinylated sgRNA library, and genomic DNA are mixed and incubated for cleavage of target regions in the genomic DNA. In the sorting step, cleaved CRISPR-DNA complexes are bound to streptavidin magnetic beads, and target DNA is released from the complexes. (B) Three sgRNA libraries that target the same genes were designed with different cleavage densities. For example, the cleavage loci in the cat gene with each sgRNA library are represented in yellow, green and deep blue. The light blue region represents the coding sequence of the cat gene, and black regions represent 200-bp upstream and downstream of cat.
Figure 2.
Figure 2.
The uniformity of CRISPR-Cap enrichment depends on the fragment size. We evaluated the uniformity of CRISPR-Cap enrichment using the percentage of uniformity values (sequencing depth / average depth). Using the uniformity values, we calculated the percentage of uniformly enriched positions in the uniform range (0.5–1.5). (A) A scatter plot shows overall uniformity values for the on-target region with each set of CRISPR-Cap products. Black or white lines at a uniformity of 1 represent the mean value, and error bars represent the standard deviation (SD) of the uniformity value. The uniformity value of each gene in the CRISPR-Cap products cleaved at 100-bp, 50-bp and 20-bp size intervals are represented with scatter plots in (B), (C) and (D), respectively. Black bars represent the mean uniformity value of each gene, and error bars represent the SD of each gene. Size distributions of Cas9-cleaved DNA fragments using the 100-bp, 50-bp and 20-bp sgRNA libraries are represented in (E), (F) and (G), respectively. The distributions were obtained after NGS data alignment to the E. coli genome.
Figure 3.
Figure 3.
CRISPR-Cap shows no significant allelic bias. E. coli EcHB3 has five different point mutations compared with E. coli EcNR2. We performed CRISPR-Cap after mixing EcNR2 and EcHB3 genomic DNA in five different ratios (EcNR2:EcHB3 = 50:50, 90:10, 99:1, 99.9:0.1, and 100:0). All five mutations were enriched with CRISPR-Cap, and the ratio of EcNR2 to EcHB3 codons from the sequencing data showed no significant allelic bias (r2= 0.99). Blue bars represent the percentage of the EcNR2 allele, and red bars represent the percentage of the EcHB3 allele (see also Supplementary Figure S9 for the enlarged plot of values at 99:1, 99.9:0.1 and 100:0).
Figure 4.
Figure 4.
Quantification of gene copy number using CRISPR-Cap. We prepared genomic DNA samples containing three different copy numbers of the bla gene from (i) E. coli EcHB3, (ii) EcHB3 containing pBR322 (middle copy), (iii) and EcHB3 containing pUC19 (high copy). (A) E. coli EcHB3 has a single copy of bla in its genome. E. coli EcHB3 genomic DNA with either pBR322 (B) or pUC19 (C) contains middle and high copy numbers of the bla gene, respectively. Dashed lines represent the average sequencing depth of the bla gene region in each product. The average sequencing depth of the bla gene gradually increased according to the copy number.
Figure 5.
Figure 5.
Enrichment of CDS regions in human genomic DNA by CRISPR-Cap. The enrichment results of NA12878 genomic DNA using CRISPR-Cap (1:10,000_5 from Supplementary Table S10). Gray regions under the x-axis indicate target regions, which include all exons of 20 genes and additional 100-bp upstream and downstream of each exon. The x-axis is the genomic position, and the y-axis is the sequencing reads count.

References

    1. Park S.T., Kim J.. Trends in Next-Generation Sequencing and a New Era for Whole Genome Sequencing. Int. Neurourol. J. 2016; 20:S76–S83. - PMC - PubMed
    1. Henegariu O., Heerema N.A., Dlouhy S.R., Vance G.H., Vogt P.H.. Multiplex PCR: Critical parameters and step-by-step protocol. BioTechniques. 1997; 23:504–511. - PubMed
    1. Hayden M.J., Nguyen T.M., Waterman A., Chalmers K.J.. Multiplex-ready PCR: a new method for multiplexed SSR and SNP genotyping. BMC Genomics. 2008; 9:80. - PMC - PubMed
    1. Tewhey R., Warner J.B., Nakano M., Libby B., Medkova M., David P.H., Kotsopoulos S.K., Samuels M.L., Hutchison J.B., Larson J.W. et al. . Microdroplet-based PCR enrichment for large-scale targeted sequencing. Nat. Biotechnol. 2009; 27:1025–1031. - PMC - PubMed
    1. Laurie M.T., Bertout J.A., Taylor S.D., Burton J.N., Shendure J.A., Bielas J.H.. Simultaneous digital quantification and fluorescence-based size characterization of massively parallel sequencing libraries. BioTechniques. 2013; 55:61–67. - PMC - PubMed

Publication types