. 2018 Oct 12;46(18):9309-9320.
doi: 10.1093/nar/gky798.

Growth-restricting effects of siRNA transfections: a largely deterministic combination of off-target binding and hybridization-independent competition

Affiliations

Growth-restricting effects of siRNA transfections: a largely deterministic combination of off-target binding and hybridization-independent competition

Neha Daga et al. Nucleic Acids Res. .

Abstract

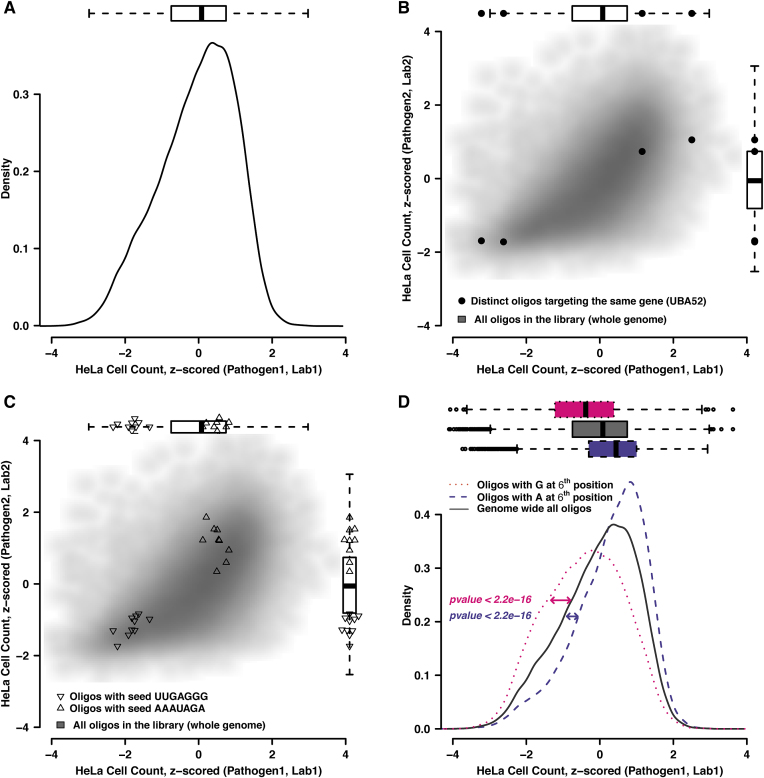
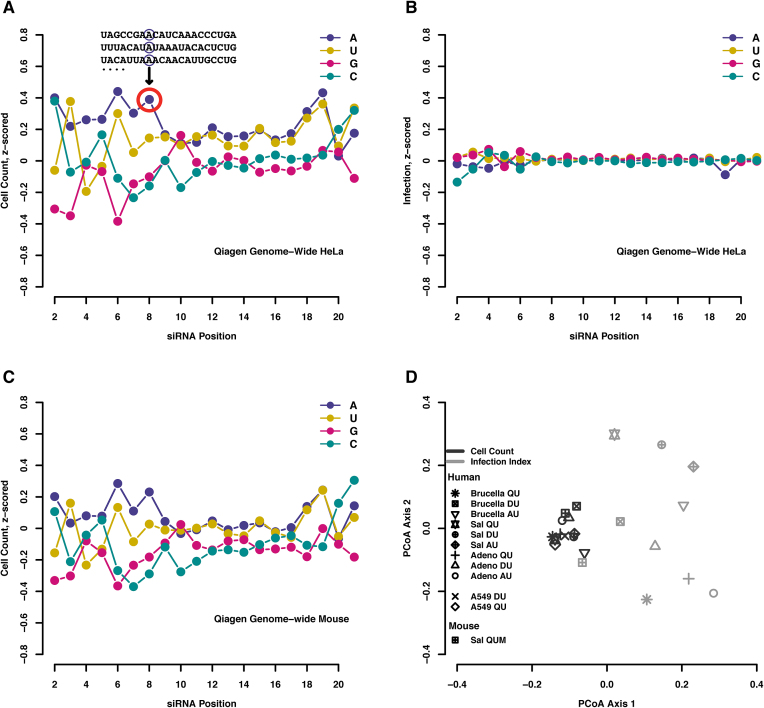
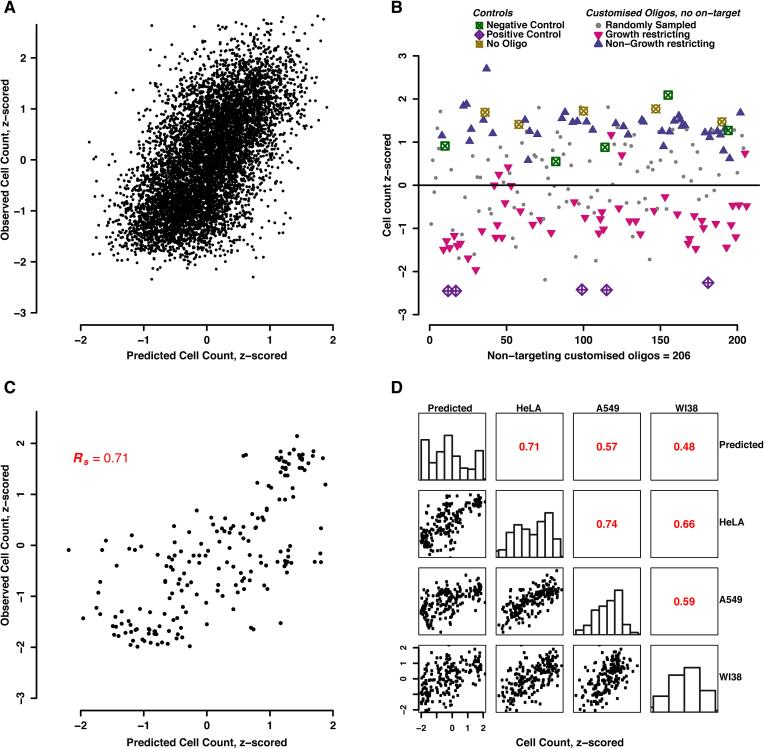
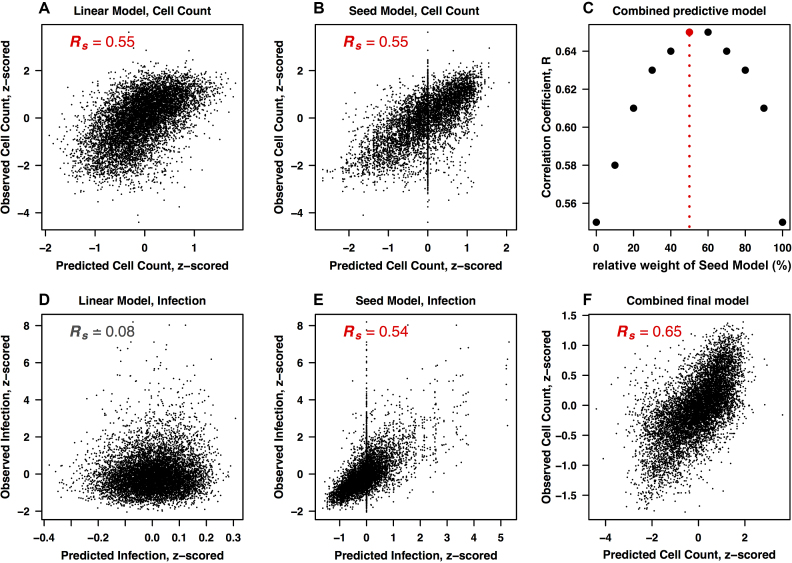
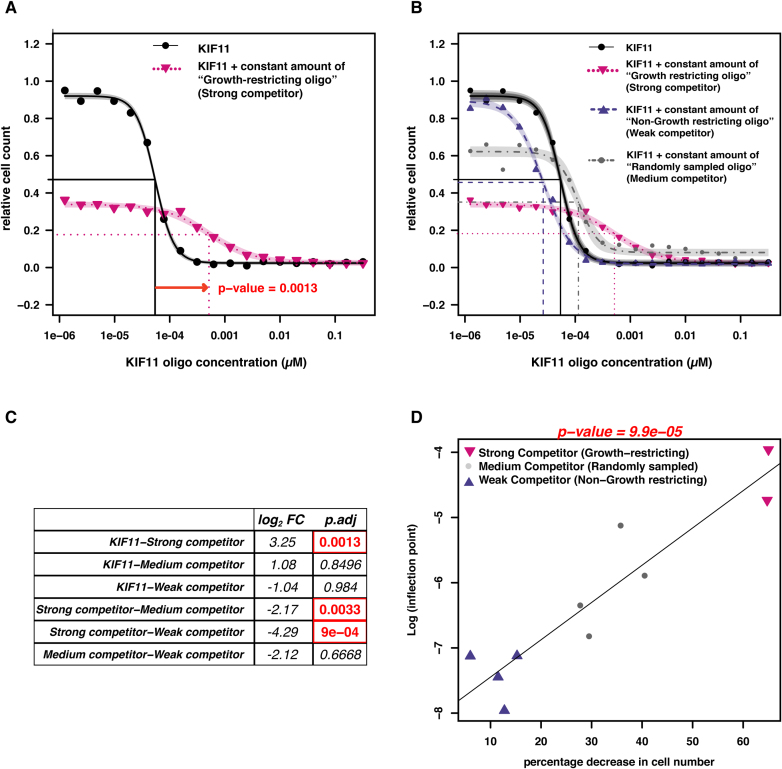
Perturbation of gene expression by means of synthetic small interfering RNAs (siRNAs) is a powerful way to uncover gene function. However, siRNA technology suffers from sequence-specific off-target effects and from limitations in knock-down efficiency. In this study, we assess a further problem: unintended effects of siRNA transfections on cellular fitness/proliferation. We show that the nucleotide compositions of siRNAs at specific positions have reproducible growth-restricting effects on mammalian cells in culture. This is likely distinct from hybridization-dependent off-target effects, since each nucleotide residue is seen to be acting independently and additively. The effect is robust and reproducible across different siRNA libraries and also across various cell lines, including human and mouse cells. Analyzing the growth inhibition patterns in correlation to the nucleotide sequence of the siRNAs allowed us to build a predictor that can estimate growth-restricting effects for any arbitrary siRNA sequence. Competition experiments with co-transfected siRNAs further suggest that the growth-restricting effects might be linked to an oversaturation of the cellular miRNA machinery, thus disrupting endogenous miRNA functions at large. We caution that competition between siRNA molecules could complicate the interpretation of double-knockdown or epistasis experiments, and potential interactions with endogenous miRNAs can be a factor when assaying cell growth or viability phenotypes.


Figures

Figure 1.
Figure 1.
Different types of off-target effects of siRNAs in RNAi pathogen screens. (A) Cell number distribution from a genome-wide pathogen screen (here, Brucella abortus). (B) On-target reproducibility of the cell-number phenotype. The four data points highlighted in black represent four distinct siRNAs targeting the same gene, shown against the genome-wide reproducibility of identical oligos in distinct screens (gray scatter plot of 69,000 siRNAs targeting the human genome, in two pathogen screens; Pathogen1: Brucella abortus and Pathogen 2: Uukuniemi virus). (C) Strong and consistent seed-mediated off-target effects of siRNAs across RNAi screens. The two clusters represent two different seed sequences, one increasing the cell number and the other decreasing it. All data points in each cluster represent oligos targeting different genes but containing the respective seed sequence of the cluster. Background scatter as in (B). (D) Shifted cell-count distributions, caused by the presence of a single nucleotide at a specified position. Three different cell count distributions are represented by three colored line types. The black solid line represents the cell count of all the siRNAs in a genome-wide screen (Brucella abortus screen), pink dotted and violet dashed lines represent cell count distributions of all those siRNAs in that same screen that have either adenine at 6th position or guanine at 6th position, respectively. In all panels, the box-plots denote the percentiles 25%, 50% and 75%, respectively, with their whiskers extending to the highest or lowest data points that are at most 1.5 times the box distance away from the box.
Figure 2.
Figure 2.
Positional profiles of phenotypic consequences of individual nucleotides at individual siRNA positions. (AC) Each data point represents the average phenotype of all siRNAs that happen to have the specified nucleotide at that particular position. Note that the first position on the 5′-end is not considered here, since it has a strong technical bias in library design and not all nucleotides are sufficiently covered there (see also Supplementary Figure S2). (A, B) Positional profile for cell count and infection phenotypes, respectively, in a genome-wide Brucella abortus screen in HeLa CCL2 cells conducted with a non-pooled siRNA library (Qiagen). (C) siRNA nucleotide positional profile for cell count in a genome-wide screen for Salmonella entry into MEFs (murine embryonic fibroblasts, unpublished). (D) Global comparison of siRNA nucleotide profiles, generated for three different pathogen screens (Brucella abortus, Salmonella Typhimurium and Adenovirus), across three different libraries of non-pooled siRNAs designed by Qiagen, Dharmacon and Ambion (QU, DU and AU, respectively) targeting human kinome genes (∼ 800) in HeLa CCL2 cells, together with another genome-wide screen carried out in human A549 cells and mouse embryonic fibroblast cells using non-pooled Dharmacon (DU) and Qiagen libraries (QUM), respectively. Each data point represents the entire nucleotide profile as seen in panels A–C. Black color denotes cell count readouts and gray color denotes infection readouts.
Figure 3.
Figure 3.
Predicting cell-number reductions from siRNA sequence. (A) A linear model was trained on 90% of the Uukuniemi genome-wide screening data and used to predict the remaining 10% of data. Correlation plot between observed and predicted values for cell count upon transfection. (B) Experimental design for testing the predictor with previously unobserved, arbitrary siRNA sequences. Oligos are separated by design-class, and observed phenotypes are shown. (C) Correlation plot between observed and predicted values of customized siRNAs in HeLa CCL2 cells. (D) Experimentally validating the model prediction across cell lines. The linear model trained on a genome-wide screen in HeLa CCL2 cells (Brucella abortus screen) was used to predict the cell counts across different cell lines. Summary/correlation plots between the observed and predicted values of customized siRNAs across cell lines. The small histograms in the center describe the distribution of data points along the x-axis, per column.
Figure 4.
Figure 4.
Combined modeling to increase the predictive power. (A, B) Performance of the two individual models for predicting the cell growth phenotype, trained (A) on individual nucleotide positions, and (B) on 7-mer seed sequences at position 2–8. (D, E). Corresponding plots for the infection phenotype. Plots show correlations between the observed and predicted phenotypes. (C) Combining seed model and linear nucleotide model predictions to find the best possible combination of the two models for maximum prediction power. Each data point represents the correlation between the observed and combined prediction from both models. The combined prediction is calculated by combining the prediction output from both models in different percentages (the x-axis shows the weight percentage of the linear model). (F) Combined final model. Correlation plot between the observed and the combined prediction from both models. The prediction output is a combination with 50% contribution from both models.
Figure 5.
Figure 5.
Co-transfected siRNAs compete with one another in a predictable manner. (A) A titration experiment was set up to establish a dose-response curve for a standard siRNA targeting the KIF11 transcript, which has a strong on-target effect (cell death) and is thus used as a transfection control in many screens. (A, B) The black curve from (A) was repeated with various oligos co-transfected at a constant amount, and the horizontal shift of the dose-response curve was measured. (C) Significance of shifts in concentration response curves upon co-transfecting various classes of siRNAs (in each pairing, the left oligo was titrated, and the right was given at a constant amount; FC = fold change, dividing the right oligo's inflection point by the left oligo's inflection point). (D) Correlation plot between shifts in concentration response curves of siRNAs targeting KIF11 upon co-transfection with customized siRNAs, and decrease in cell number upon transfection with these customised oligos alone.

Similar articles

Cited by

References

    1. Sander J.D., Joung J.K.. CRISPR-Cas systems for editing, regulating and targeting genomes. Nat. Biotechnol. 2014; 32:347–355. - PMC - PubMed
    1. Taylor J., Woodcock S.. A perspective on the future of High-Throughput RNAi screening: will CRISPR cut out the competition or can RNAi help guide the way?. J. Biomol. Screen. 2015; 20:1040–1051. - PubMed
    1. Mello C.C., Conte D. Jr. Revealing the world of RNA interference. Nature. 2004; 431:338–342. - PubMed
    1. Meister G., Tuschl T.. Mechanisms of gene silencing by double-stranded RNA. Nature. 2004; 431:343–349. - PubMed
    1. Mohr S.E., Smith J.A., Shamu C.E., Neumuller R.A., Perrimon N.. RNAi screening comes of age: improved techniques and complementary approaches. Nat. Rev. Mol. Cell Biol. 2014; 15:591–600. - PMC - PubMed

Publication types

LinkOut - more resources