

Assortment of Flowering Time and Immunity Alleles in Natural Arabidopsis thaliana Populations Suggests Immunity and Vegetative Lifespan Strategies Coevolve
- PMID: 30215800
- PMCID: PMC6133262
- DOI: 10.1093/gbe/evy124
Assortment of Flowering Time and Immunity Alleles in Natural Arabidopsis thaliana Populations Suggests Immunity and Vegetative Lifespan Strategies Coevolve
Abstract
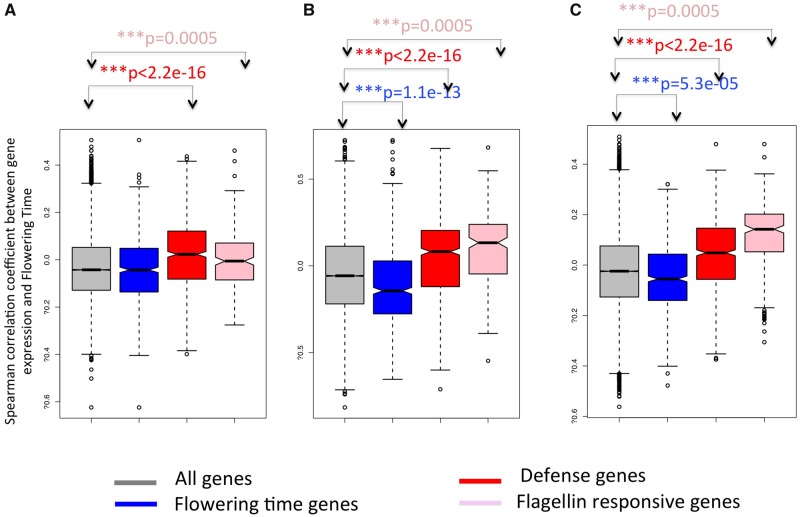
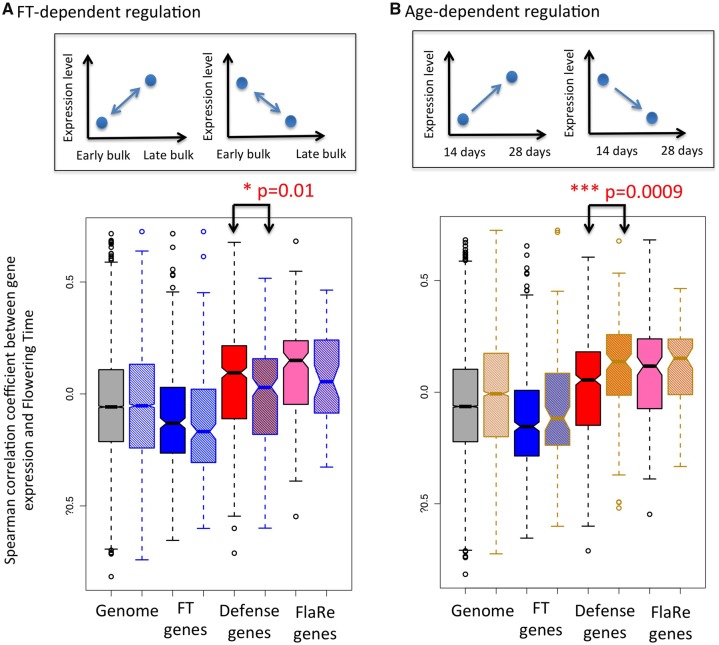
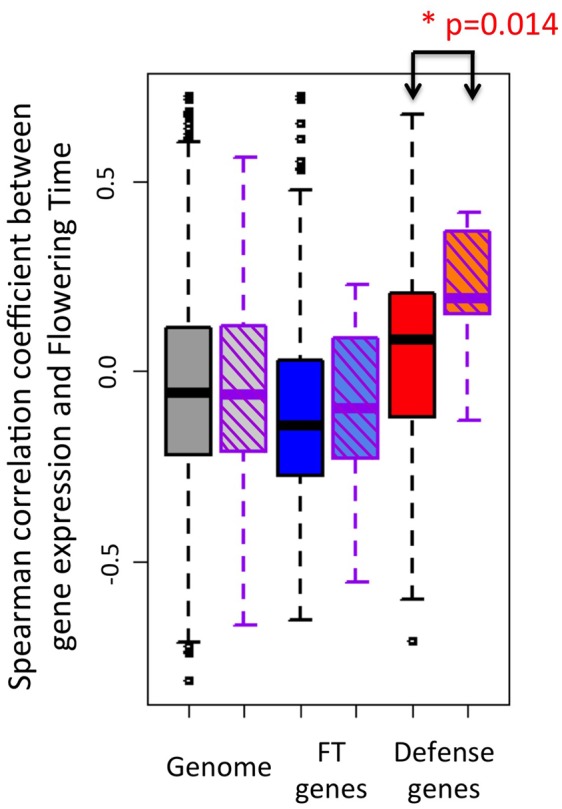
The selective impact of pathogen epidemics on host defenses can be strong but remains transient. By contrast, life-history shifts can durably and continuously modify the balance between costs and benefits of immunity, which arbitrates the evolution of host defenses. Their impact on the evolutionary dynamics of host immunity, however, has seldom been documented. Optimal investment into immunity is expected to decrease with shortening lifespan, because a shorter life decreases the probability to encounter pathogens or enemies. Here, we document that in natural populations of Arabidopsis thaliana, the expression levels of immunity genes correlate positively with flowering time, which in annual species is a proxy for lifespan. Using a novel genetic strategy based on bulk-segregants, we partitioned flowering time-dependent from -independent immunity genes and could demonstrate that this positive covariation can be genetically separated. It is therefore not explained by the pleiotropic action of some major regulatory genes controlling both immunity and lifespan. Moreover, we find that immunity genes containing variants reported to impact fitness in natural field conditions are among the genes whose expression covaries most strongly with flowering time. Taken together, these analyses reveal that natural selection has likely assorted alleles promoting lower expression of immunity genes with alleles that decrease the duration of vegetative lifespan in A. thaliana and vice versa. This is the first study documenting a pattern of variation consistent with the impact that selection on flowering time is predicted to have on diversity in host immunity.
Figures
Similar articles
-
Independent FLC mutations as causes of flowering-time variation in Arabidopsis thaliana and Capsella rubella.Genetics. 2012 Oct;192(2):729-39. doi: 10.1534/genetics.112.143958. Epub 2012 Aug 3. Genetics. 2012. PMID: 22865739 Free PMC article.
-
Standing genetic variation in FRIGIDA mediates experimental evolution of flowering time in Arabidopsis.Mol Ecol. 2009 May;18(9):2039-49. doi: 10.1111/j.1365-294X.2009.04145.x. Epub 2009 Mar 20. Mol Ecol. 2009. PMID: 19317844
-
Pleiotropy of FRIGIDA enhances the potential for multivariate adaptation.Proc Biol Sci. 2013 May 22;280(1763):20131043. doi: 10.1098/rspb.2013.1043. Print 2013 Jul 22. Proc Biol Sci. 2013. PMID: 23698015 Free PMC article.
-
Genetic regulation of flowering time in annual and perennial plants.Wiley Interdiscip Rev RNA. 2014 May-Jun;5(3):347-59. doi: 10.1002/wrna.1215. Epub 2013 Dec 16. Wiley Interdiscip Rev RNA. 2014. PMID: 24357620 Review.
-
Nitrogen - essential macronutrient and signal controlling flowering time.Physiol Plant. 2018 Feb;162(2):251-260. doi: 10.1111/ppl.12664. Epub 2017 Nov 23. Physiol Plant. 2018. PMID: 29095491 Review.
Cited by
-
Species-wide gene editing of a flowering regulator reveals hidden phenotypic variation.PLoS Biol. 2025 Jun 9;23(6):e3003226. doi: 10.1371/journal.pbio.3003226. eCollection 2025 Jun. PLoS Biol. 2025. PMID: 40489553 Free PMC article.
-
Polygenic adaptation of rosette growth in Arabidopsis thaliana.PLoS Genet. 2021 Jan 25;17(1):e1008748. doi: 10.1371/journal.pgen.1008748. eCollection 2021 Jan. PLoS Genet. 2021. PMID: 33493157 Free PMC article.
-
OsVQ1 links rice immunity and flowering via interaction with a mitogen-activated protein kinase OsMPK6.Plant Cell Rep. 2021 Oct;40(10):1989-1999. doi: 10.1007/s00299-021-02766-6. Epub 2021 Aug 9. Plant Cell Rep. 2021. PMID: 34368900
-
Distinct function of SPL genes in age-related resistance in Arabidopsis.PLoS Pathog. 2023 Mar 22;19(3):e1011218. doi: 10.1371/journal.ppat.1011218. eCollection 2023 Mar. PLoS Pathog. 2023. PMID: 36947557 Free PMC article.
-
Molecular Basis of Plant-Pathogen Interactions in the Agricultural Context.Biology (Basel). 2024 Jun 6;13(6):421. doi: 10.3390/biology13060421. Biology (Basel). 2024. PMID: 38927301 Free PMC article. Review.
References
-
- Alcázar R, Reymond M, Schmitz G, de Meaux J.. 2011. Genetic and evolutionary perspectives on the interplay between plant immunity and development. Curr Opin Plant Biol. 14(4):378–384. - PubMed
-
- Alexa A, Rahnenfuhrer J. 2010. topGO: enrichment analysis for Gene Ontology. R package version 2.20.0
-
- Alexa A, Rahnenfuhrer J, Lengauer T. 2006. Improved scoring of functional groups from gene expression data by decorrelating GO graph structure. Bioinformatics 22:1600–1607. - PubMed
-
- Anders S, et al. 2013. Count-based differential expression analysis of RNA sequencing data using R and Bioconductor. Nat Protoc. 8(9):1765–1786. - PubMed
-
- Andrés F, Coupland G.. 2012. The genetic basis of flowering responses to seasonal cues. Nat Rev Genet. 13(9):627–639. - PubMed
Publication types
MeSH terms
Substances
Grants and funding
LinkOut - more resources
Full Text Sources
Other Literature Sources
Molecular Biology Databases
