Review
. 2018 Sep 14;8(4):1313-1356.
doi: 10.1002/cphy.c170052.

Immunobiology of Inherited Muscular Dystrophies

Affiliations
Review

Immunobiology of Inherited Muscular Dystrophies

James G Tidball et al. Compr Physiol. .

Abstract

The immune response to acute muscle damage is important for normal repair. However, in chronic diseases such as many muscular dystrophies, the immune response can amplify pathology and play a major role in determining disease severity. Muscular dystrophies are inheritable diseases that vary tremendously in severity, but share the progressive loss of muscle mass and function that can be debilitating and lethal. Mutations in diverse genes cause muscular dystrophy, including genes that encode proteins that maintain membrane strength, participate in membrane repair, or are components of the extracellular matrix or the nuclear envelope. In this article, we explore the hypothesis that an important feature of many muscular dystrophies is an immune response adapted to acute, infrequent muscle damage that is misapplied in the context of chronic injury. We discuss the involvement of the immune system in the most common muscular dystrophy, Duchenne muscular dystrophy, and show that the immune system influences muscle death and fibrosis as disease progresses. We then present information on immune cell function in other muscular dystrophies and show that for many muscular dystrophies, release of cytosolic proteins into the extracellular space may provide an initial signal, leading to an immune response that is typically dominated by macrophages, neutrophils, helper T-lymphocytes, and cytotoxic T-lymphocytes. Although those features are similar in many muscular dystrophies, each muscular dystrophy shows distinguishing features in the magnitude and type of inflammatory response. These differences indicate that there are disease-specific immunomodulatory molecules that determine response to muscle cell damage caused by diverse genetic mutations. © 2018 American Physiological Society. Compr Physiol 8:1313-1356, 2018.


Figures

Figure 1
Figure 1
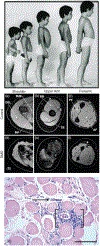
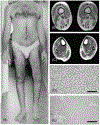
Characteristics of Duchenne muscular dystrophy (DMD). (A) Typically, the clinical onset of DMD occurs at about 3 years of age as boys begin to show defects in muscle function. In this image of 5 boys with DMD at progressively older ages, some of the gross features of the disease are apparent. The boys show an increasingly progressive lumbar curvature of the spine that results in postural compensation for increased weakening of paravertebral muscles. There is also a progressive increase of weight bearing on the toes and reduction of weight bearing on the heels, as fibrosis of calf muscles cause contractures that limit plantar flexion. Although gross appearance shows an apparent sparing of calf muscles even in older boys, there is actually an increased replacement of muscle tissue with fibrous and fatty tissue, leading to a pseudohypertrophy of the calves. (B) Magnetic resonance spectroscopy images of the shoulders, upper arms, and forearms of healthy subjects (12, 13, and 13 years of age) and DMD patients (12, 13, and 13 years of age) showing tremendous reductions of muscle mass (white) by fatty tissue (dark). BB (biceps brachii), TB (triceps brachii), DEL (deltoid), subscapularis (SUB), infraspinatus (INF), posterior compartment of the forearm (PF), and anterior compartment of the forearm (AF). [Reproduced, with permission, from reference (361).] (C) Section of muscle biopsy of DMD patient stained with hematoxylin and eosin stain. Large accumulations of connective tissue separate individual muscle fibers and mononucleated leukocytes are present in elevated numbers in the interstitial tissue (arrow) and near blood vessels (brackets). Fiber cross-sectional area is also highly variable, another characteristic of DMD pathology. Bar = 60 μm. [Reproduced, with permission, from reference (252).]
Figure 2
Figure 2
Schematic representation of dystrophin glycoprotein complex (DGC). Dystrophin provides an important structural link between the thin filaments within skeletal muscle fibers and β-dystroglycan, which is a transmembrane protein. β-dystroglycan then binds extracellularly to α-dystroglycan which is a ligand for extracellular structural proteins, especially laminin-2 that is present in basal lamina. Several proteins in the basal lamina, including laminin and fibronectin, then provide mechanical links to major connective tissue macromolecules such as collagen type 1. Genetic deletion of dystrophin disrupts this mechanical linkage between the cytoskeleton and extracellular structural proteins, but also leads to reductions in the quantity of other structural proteins in the DGC or associated with the DGC. The secondary loss of those other proteins, including the sarcoglycans, syntrophin and neuronal nitric oxide synthase (nNOS) can contribute to the pathology of dystrophin deficiency through disruption of signaling pathways that are necessary for normal muscle function. [Reproduced, with permission, from reference (319).]
Figure 3
Figure 3
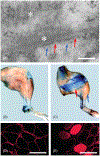
Dystrophin deficiency causes membrane lesions and unregulated influx and efflux of large molecules. (A) Electron microscopy on DMD skeletal muscle shows morphologically detectible lesions in the cell membrane (sarcolemma) of dystrophic fibers. Asterisks (*) indicate basal lamina and other connective tissue associated with the extracellular surface of the muscle fiber. Blue arrows indicate sites of intact sarcolemma associated with dense, subsarcolemmal material. Red arrows indicate sites of lesions in the sarcolemma that would permit unrestricted transit of molecules across the membrane. Scale bar = 150 nm. [Reproduced, with permission, from reference (230).] [(B) and (C)] Intact hind limbs of wild-type (B) or mdx mice (C) that had been injected with an extracellular marker dye, Evans blue, prior to euthanasia and tissue collection. Skin and fat has been removed from both limbs. The wild-type muscles show little blue dye, indicating that little dye was able to cross the cell membrane to enter the cytosol of the muscle fibers. The mdx muscle shows some thigh muscles contain high concentrations of blue muscle fibers (red arrow) indicating unregulated entry of dye into the fibers through membrane lesions. In contrast, leg muscle in the same mouse shows little blue dye (blue arrow), illustrating the difference in magnitude of pathology and progression of the disease in different muscles. [Reproduced, with permission, from reference (303).] [(D) and (E)] Cross sections of soleus muscle from wild-type (D) and mdx (E) mice. The muscles were incubated in a fluorescent, extracellular marker dye after dissection and before freezing the muscle for histology. In the wild-type muscle, the fluorescent dye remains in the extracellular space because the muscle cell membranes are intact (D). In the mdx muscle, approximately 8% of the muscle fibers showed elevated intracellular fluorescence, indicating the presence of membrane lesions. Bars = 70 μm. [Reproduced, with permission, from reference (351).]
Figure 4
Figure 4
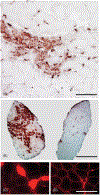
Macrophages are a primary source of muscle fiber damage in the mdx model of DMD. (A) At the early, acute peak of mdx muscle pathology, macrophages dominate large inflammatory lesions in the diseased muscle. Cross section of 4-week-old mdx mouse muscle with F4/80 + macrophages immunolabeled to appear red in the sectioned muscle. Bar = 180 μm. (B) Image shows complete, mid-belly cross section of an entire soleus muscle from 4-week-old mdx mice. The mouse from which the muscle on the left was collected received intraperitoneal injections of sterile buffer on 5 days each week from 8 days of age until the mouse was euthanized at 4 weeks of age. The mouse from which the muscle on the right was collected received intraperitoneal injections of antibodies to the F4/80 antigen on the same injection schedule, which produced a reduction in macrophage numbers by over 90%. Both sections were stained with antibodies to neural cell adhesion molecule (NCAM) which is expressed at high levels by muscle fibers that are undergoing repair following injury. Each small, red tile-like structure in the cross section is a recently injured fiber. Note that the macrophage-depleted muscle is nearly devoid of NCAM-expressing muscle fibers. Bar = 1.2 mm. [(C) and (D)] Soleus muscles from nondepleted, 4-week-old mdx mice (C) or macrophage-depleted mdx mice (D) were incubated in Procion red, a fluorescent, extracellular marker dye before muscle sectioning and microscopy. Intracellular Procion red indicates fibers with membrane lesions. The number of Procion-red-containing fibers in the 4-week-old mdx solei was reduced by more than 75%. Bar = 120 μm. [Reproduced, with permission, from reference (351).]
Figure 5
Figure 5
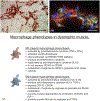
Inflammation in the mdx mouse model of DMD. (A) Section of a 4-week-old mdx mouse muscle immunolabeled with anti-F4/80, a pan-macrophage marker (red). Note that some muscle fibers have been invaded and obliterated by large numbers of macrophages (white asterisk) while other, small regenerating fibers are surrounded but not invaded by macrophages (black asterisk). Bar = 50 μm. (B) Section of 4-week-old muscle immunolabeled with antibodies to F4/80 (red) and CD206 (green), a marker for M2-biased macrophages. Blue structures are nuclei binding DAPI reagent. This inflammatory lesion in dystrophic muscle contains proinflammatory, M1-biased macrophages (red) that can promote muscle damage, as well as antiinflammatory, M2-biased macrophages (orange), that can affect regeneration and fibrosis. Bar = 50 μm. [Reproduced, with permission, from reference (343).] (C) Characteristics of M1-biased and M2-biased macrophages in dystrophic muscle.
Figure 6
Figure 6
Competition for arginine in mdx muscles can affect the pathology of muscular dystrophy. Because arginine is a conditionally essential amino acid in injured and diseased tissues, enzymes that metabolize arginine can compete for substrate. Normally in injured muscle, iNOS and arginase in macrophages and nNOS in muscle fibers compete for arginine. Muscle nNOS transcription is greatly reduced as a consequence of dystrophin deficiency, which increases arginine availability for iNOS and arginase. This amplifies muscle pathology because of muscle fiber lysis by iNOS-mediated mechanisms and muscle fibrosis mediated by arginase-mediated mechanisms. [Adapted, with permission, from reference (352).]
Figure 7
Figure 7
Chronic muscle damage in dystrophinopathies causes dysregulation of the immune response that is adapted to acute injuries. Chronic long-term damage and inflammation of dystrophic muscle can amplify muscle fiber damage and fibrosis. Macrophages increase cytolysis of dystrophic muscle fibers by the release of high levels of NO. Macrophage-derived NO can also amplify neutrophil-mediated damage to muscle fibers, which can lyse muscle by producing free radicals including superoxide, hydrogen peroxide (H2O2), hypochlorous acid (HOCl), nitric oxide (NO), and peroxynitrite. CD8+ cytotoxic T-lymphocytes also contribute to muscle pathology by inducing myonuclear apoptosis through perforin-mediated mechanisms. The cytotoxicity of CD8+ cells can be diminished by eosinophil MBP, although eosinophils also amplify muscle fiber damage through MBP-independent mechanisms. M1-biased macrophages in dystrophic muscle are driven to an M2-biased phenotype by IL10 and fibrinogen which can subsequently increase muscle fibrosis by providing substrate to fibroblasts for connective tissue production through arginase-dependent events and by the release of TGFβ, which increases connective tissue production by fibroblasts.
Figure 8
Figure 8
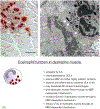
Eosinophils in dystrophinopathy. (A) Inflammatory lesion in 4-week-old mdx mouse muscle in section stained with anti-MBP to indicate locations of MBP-expressing eosinophils (red). Note the elevated numbers of eosinophils in areas of increased connective tissue accumulation between muscle fibers. Also, note that the cytoplasmic organization of muscle fibers is disrupted in areas enriched with eosinophils, indicating fiber damage, but smooth in areas lacking eosinophils, indicating healthy fibers. Bar = 50 μm. (B) Electron micrograph of a portion of a muscle fiber in 12-month-old mdx mouse (left) in close apposition to an eosinophil with a multilobed nucleus (white asterisks). At the pole of the eosinophil closest to the muscle fiber, vesicles containing rods of MBP and other cationic proteins (white arrows) are accumulated. Bar = 1.5 μm. [Reproduced, with permission, from reference (357).] (C) Eosinophil function in dystrophic muscle.
Figure 9
Figure 9
Cytotoxic T-lymphocytes in dystrophinopathy. (A) Section of 4-week-old mdx muscle labeled with antibodies to CD8. Elevated numbers of CD8+ CTLs are present in inflammatory foci in dystrophic muscle. Bar = 50 μm. [Reproduced, with permission, from reference (298).] (B) Schematic of process leading to antigen presentation by muscle fibers leading to activation of CTLs. (C) CTL function in dystrophic muscle.
Figure 10
Figure 10
Activation of the expression of proinflammatory molecules and molecules necessary for antigen presentation by MHC class 1. Both muscle fibers and macrophages can be activated to increase expression of proinflammatory molecules and MHC class 1 via NFκB activation. IκB kinase (IKK) can be activated by TNF binding to its receptor and acting through the adapter protein TRAF2 or by HMGB1 binding its receptor and acting through adapters TRAF6 or MYD88. Activated IKK then phosphorylates IκB, leading to its dissociation from NFκB, causing NFκB activation. Activated NFκB then translocate to the nucleus to bind to the NFκB response element (NRE) of target genes, to activate their expression.
Figure 11
Figure 11
Activation of myogenic precursor cells is essential for repeated muscle regeneration. Satellite cells are myogenic cells that reside in a quiescent state on the surface of muscle fibers and can be identified by their location and by their pattern of expression of myogenic transcription factors (Pax7+/MyoD/MyoG). Following their activation by injury or disease, they enter the cell cycle to give rise to two daughter cells with the same developmental destiny or cells with nonidentical developmental paths. Proliferative daughter cells begin to express MyoD and continue to differentiate while other daughter cells return to the quiescent state and remain Pax7+/MyoD. As the Pax7+/MyoD+ cells continue to differentiate, they permanently downregulate Pax7 and begin to express the transcription factor myogenin (MyoG) which is required for further differentiation. The Pax7/MyoD+/MyoG+ cells can fuse with other myogenic cells to form multinucleated myotubes. Myotubes then grow and begin to express genes required for terminal differentiation and become nascent muscle fibers. Eventually, nuclei derived from the originally activated satellite cell population become myonuclei that reside within the muscle fiber, in which myogenic regulatory genes are permanently silenced (Pax7/MyoD/MyoG). [Adapted, with permission, from reference (316).]
Figure 12
Figure 12
Inflammation and regeneration are coupled in dystrophic muscle. Damage of dystrophic muscle fibers leads to the release of DAMPs that can recruit and activate leukocytes from the vasculature as well as leukocytes that reside in the muscle. Those leukocytes can further promote recruitment by the release of chemoattractants, such as CCLs. The activated leukocytes then disperse throughout the muscle where they can influence regeneration, in addition to promoting damage. Macrophages that dominate the initial inflammatory infiltrate can be biased toward an M1, cytolytic phenotype by Th1 cytokines such as TNF and IFNγ that can be released by neutrophils and CD8+ cells. In parallel with the recruitment and activation of immune cells, muscle fiber damage also activates satellite cells to begin their program of expansion and differentiation that contributes to muscle regeneration. M1-biased macrophages release IGF-1 that stimulates myogenic cell proliferation. M1-biased macrophages can also switch to an M2-biased phenotype following stimulation by fibrinogen or IGF-1 or by IL10 produced by Tregs. M2-biased macrophages can also contribute to the expansion of myogenic cell populations through the release of Klotho. M2-biased macrophages can also release TGFβ, that increases the differentiation of FAPs to become fibroblasts. Fibroblast production of IGF-1 promotes the growth and differentiation of myotubes to become muscle fibers.
Figure 13
Figure 13
Regulatory T-cells in muscular dystrophy. [(A)-(C)] Section of DMD muscle biopsy labeled with antibodies to CD3 (A; green) and FoxP3 (B; red) showing that a portion of CD3+ T-cells in DMD muscle are FoxP3-expressing Tregs (C; double-labeled, arrows). [Reproduced, with permission, from reference (344).] (D) Treg function in dystrophic muscle. Bar = 40 μm.
Figure 14
Figure 14
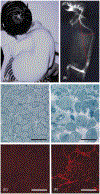
Muscle and cardiac fibrosis are major features of the pathophysiology of dystrophinopathies. (A) Posterior view of thorax of DMD patient showing extreme kyphoscoliosis that is attributable, in part, to fibrosis of paravertebral muscles. (B) Radiograph of 18-month-old mdx mouse showing pathological curvature of the spine caused by increased fibrosis of paravertebral muscles. [Reproduced, with permission, from reference (352).] [(C) and (D)] Cross section of quadriceps muscles from 24-month-old wild-type (C) or mdx mouse (D) stained with hematoxylin. Fibers in wild-type muscle have similar size and are separated by little connective tissue although mdx muscles show large variability in fiber size and extensive accumulation of connective tissue between fibers. Bars = 100 μm. [Reproduced, with permission, from reference (318).] [(E) and (F)] Section through myocardium of 1-year-old wild-type (E) and mdx (F) mice stained for collagen type 1 shows fibrous lesions that occur in mdx myocardia are absent in wild-type mice. Bars = 50 μm. [Reproduced, with permission, from reference (353).]
Figure 15
Figure 15
Muscle wasting in LGMD1B can be accompanied by extensive immune cell involvement that indicates an acquired immune response. [(A)-(C)] T1-weighted magnetic resonance imaging of transverse sections of thighs of three LGMD1B patients. Muscles appearing dark in the image are increasingly replaced by fat and connective tissue, appearing white. Muscles affected include rectus femoris (RF), sartorius (SA), vastus medius (VM), vastus intermedius (VI), vastus lateralis (VL), and gracilis (G). Hematoxylin and eosin-stained section of biopsied muscle tissue from LGMD1B patient (D) shows greatly elevated numbers of inflammatory cells in lesions within the muscle. (E) Immunohistochemistry of sections of biopsied muscles labeled with antibodies to CD4 (green) and dystrophin (red) shows that many of the leukocytes in inflammatory foci are T-cells. (F) Immunohistochemistry of sections of biopsied muscles labeled with antibodies to CD20 (green) and dystrophin (red) also shows elevated numbers of B-cells in the lesions. Bars = 70 μm. [Reproduced, with permission, from reference (175).]
Figure 16
Figure 16
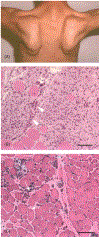
Muscle wasting and inflammation in LGMD2A. (A) LGMD2A is frequently associated with “winged scapulae” attributable to weakening and loss of muscles of the shoulder girdle. [Reproduced, with permission, from reference (7).] (B) Muscle histology shows that muscle fibers in LGMD2A can be replaced by vast numbers of inflammatory cells, that include elevated numbers of eosinophils (arrowheads) in some cases. (C) Muscle histopathology also includes increased deposition of fatty tissue (arrows) and thickening of perimysial and endomysial connective tissue. Bars = 80 μm. [Reproduced, with permission, from reference (276).]
Figure 17
Figure 17
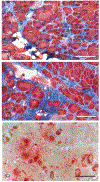
β-sarcoglycan null mice, a model for LGMD2E, experience extensive muscle fibrosis and inflammation. [(A) and (B)] One-year old, βSCG mice show large accumulations of connective tissue (blue) between muscle fibers in Masson’s trichrome-stained sections of quadriceps muscles (A) or diaphragm (B). Elevated numbers of macrophages (C), which appear red in acid phosphatase-stained sections, occur in elevated numbers in the interstitial space between muscle fibers. Bar = 100 μm. [Reproduced, with permission, from reference (108).]
Figure 18
Figure 18
Characteristics of LGMD2B. (A) LGMD2B patient showing wasting of proximal and distal, lower limb musculature. The patient also shows characteristic walking patterns that include reduction of normal heel strike during foot placement. [(Reproduced, with permission, from reference (200).] [(B) and (C)] T1-weighted MRI of thigh (B) and calf (C) of LGMD2B patient showing extensive replacement of musculature (dark grey) with fat and connective tissue (white). [(Reproduced, with permission, from reference (8).] [(D) and (E)] Anti-dysferlin staining of healthy, human muscle biopsy (D) and LGMD2B muscle biopsy (E). The normal distribution of dysferlin at the muscle fiber surface is absent in LGMD2B muscles. Bar = 150 μm. [Reproduced, with permission, from reference (172).]
Figure 19
Figure 19
Immune cell infiltrates in LGMD2B muscle. (A) Hematoxylin and eosin-stained muscle section of LGMD2B biopsy shows large interstitial spaces between muscle fibers that are occupied by inflammatory cells (dark blue) and fibrotic connective tissue. Bar = 100 μm. [Reproduced, with permission, from reference (62).] (B) Anti-CD3 staining (dark brown) shows that many of the immune cells in LGMD2B muscles are T-cells. Bar = 100 μm. [Reproduced, with permission, from reference (62).] (C) Indirect immunofluorescence antibody labeling of dystrophin (green) and CD8+ T-cells in LGMD2B muscle biopsy section show CTLs near or on surface of muscle fibers. Bar = 50 μm. [Reproduced, with permission, from reference (62).] (D) Anti-CD68 staining (brown) shows that many of the immune cells in inflammatory lesions in LGMD2B muscles are macrophages. Bar = 100 μm. [(Reproduced, with permission, from reference (372).] (E) Anti-MHC class 1 staining of LGMD2B muscle biopsies shows localization at the surfaces of muscle fibers suggesting antigen presentation by muscle fibers. Bar = 100 μm. [Reproduced, with permission, from reference (62).] (F) Section of LGMD2B muscle biopsy labeled with antibodies to C5b (dark brown) indicates complement activation occurs in dysferlin-deficient muscles. Bar = 100 μm. [Reproduced, with permission, from reference (372).]
Figure 20
Figure 20
Characteristics of MDC1A. (A) MDC1A patient with characteristic weakness of facial muscles and elbow flexions resulting from increased fibrosis. (B) Increased lumbar lordosis and knee flexions are also attributable to fibrotic contractures. (C) Weakness of neck musculature in MDC1A patient is exhibited when the patient is pulled up from a supine position. [Reproduced, with permission, from reference (105).] [(D) and (E)] T-weighted MRI of thigh (D) and leg (E) of 1-year-old MDC1A patient showing extensive muscle atrophy, fatty infiltration, and edema of lower limb musculature. PT, posterior tibial; SO, soleus; GA, gastrocnemius; AT, anterior tibial; VI, vastus internus; VM, vastus medialis; SA, sartorius; GR, gracilis; AM, adductor magnus; ST, semitendinosus; SM, semimembranosus; BF, biceps femoris; VL, vastus lateralis; RF, rectus femoris. [Reproduced, with permission, from reference (195).] (F) Anti-merosin immunolabeling of a section of biopsied muscle from healthy subject shows each muscle fiber encircled by a continuous layer of merosin in the basal lamina. Bar = 70 mm. [Reproduced, with permission, from reference (176).] (G) Anti-merosin labeling of a section of biopsied muscle from an MDC1A shows complete absence of merosin in the basal lamina. Bar = 30 mm. [Reproduced, with permission, from reference (176).] (H) Hematoxylin and eosin-stained muscle section of MDC1A biopsy shows large interstitial spaces between muscle fibers (dark red) that are occupied by fat (pale spheres) inflammatory cells (dark blue) and fibrotic connective tissue. Bar = 100 mm. [Reproduced, with permission, from reference (176).]
Figure 21
Figure 21
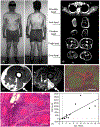
Effects of FSHD on muscle structure and inflammation. (A) FSHD patient showing asymmetric muscle wasting on right side of body, including muscles of shoulder girdle, humeral, and lower limb muscle. (B) T2-weighted MRI images of right and left, upper, and lower limbs of same patient showing extensive muscle loss and replacement by fat, that is particularly prominent in arm level and crus level images. [Reproduced, with permission, from reference (304).] (C) T1-weighted (left) and T2-weighted (right) MRI of FSHD patient. Arrow indicates site of muscle showing hyperintensity in T2 image, that was sampled by biopsy, and found to contain highly elevated numbers of leukocytes. (D) Section of muscle biopsy that is shown in (C), that was immunolabeled with antibodies to CD8 shows large numbers of CD8+ CTLs (red) surrounding muscle fibers (green). Bar = 50 μm. [Reproduced, with permission, from reference (101).] (E) Muscle biopsy from FSHD patient stained with hematoxylin and eosin shows extensive inflammation and fibrosis in the interstitium between muscle fibers. Bar = 70 μm. [Reproduced, with permission, from reference (58).] (F) Quantitative histological analysis of inflammation of muscle biopsies from FSHD patients shows a positive correlation between the number of inflammatory cells (“cell count”) and the number of necrotic fibers (“nec. fibers”). [Reproduced, with permission, from reference (11).]

References

    1. Accorsi A, Kumar A, Rhee Y, Miller A, Girgenrath M. IGF-1/GH axis enhances losartan treatment in Lama2-related muscular dystrophy. Hum Molec Genet 25: 4624–4643, 2016. 10.1093/hmg/ddw291. - DOI - PubMed
    1. Acharyya S, Villalta SA, Bakkar N, Bupha-Intr T, Janssen PM, Carathers M, Li ZW, Beg AA, Ghosh S, Sahenk Z, Weinstein M, Gardner KL, Rafael-Fortney JA, Karin M, Tidball JG, Baldwin AS, Guttridge DC. Interplay of IKK/NF-kappaB signaling in macrophages and myofibers promotes muscle degeneration in Duchenne muscular dystrophy. J Clin Invest 117: 889–901, 2007. - PMC - PubMed
    1. Aderem A, Underhill DM. Mechanisms of phagocytosis in macrophages. Annu Rev Immunol 17: 593–623, 1999. - PubMed
    1. Allen RE, Boxhorn LK. Inhibition of skeletal muscle satellite cell differentiation by transforming growth factor-beta. J Cell Physiol 133: 567–572, 1987. - PubMed
    1. Allen RE, Boxhorn LK. Regulation of skeletal muscle satellite cell proliferation and differentiation by transforming growth factor-beta, insulin-like growth factor I, and fibroblast growth factor. J Cell Physiol 138: 311–315, 1989. - PubMed

Publication types

MeSH terms