. 2018 Sep 14:24:6456-6465.
doi: 10.12659/MSM.910636.

Time-Course Investigation of Intervertebral Disc Degeneration Induced by Different Sizes of Needle Punctures in Rat Tail Disc

Affiliations

Time-Course Investigation of Intervertebral Disc Degeneration Induced by Different Sizes of Needle Punctures in Rat Tail Disc

Tao Chen et al. Med Sci Monit. .

Abstract

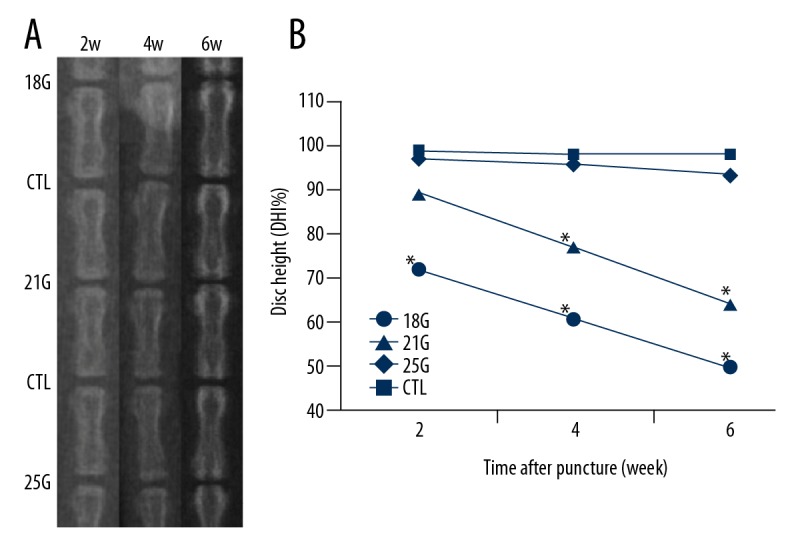
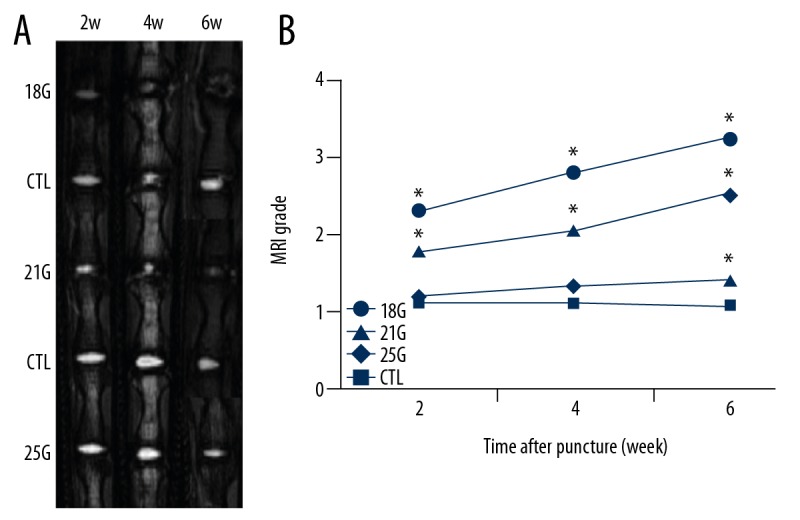
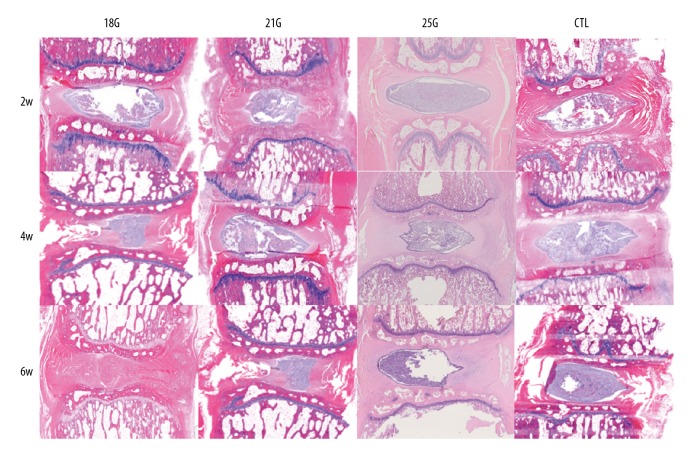
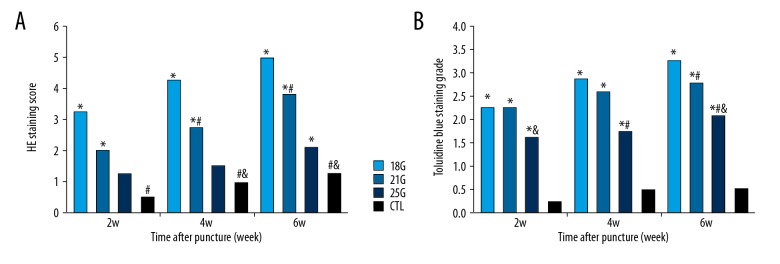
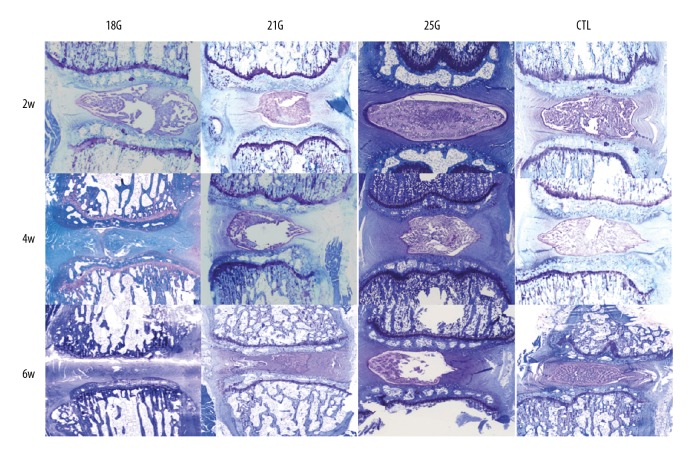
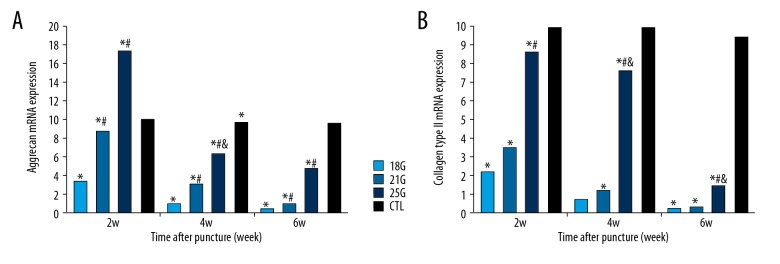
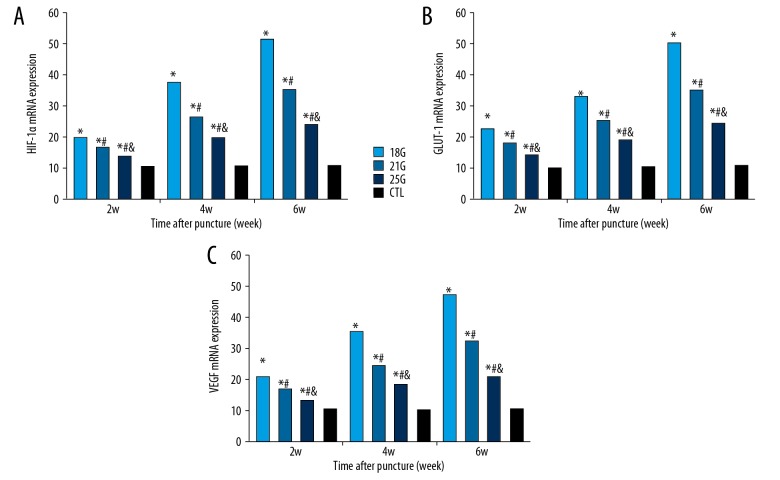
BACKGROUND This study aimed to determine the best size needle to use in inducing IVDD and to find the proper time point of disc degeneration suitable for further biologic treatment study. MATERIAL AND METHODS First, rat tail level 5/6, 7/8, and 9/10 discs were punctured by 18G, 21G, or 25G needles. Then, degeneration was assessed by radiography, MRI, and histological evaluation at 2, 4, and 6 weeks after puncture. Later, real-time reverse transcriptase (RT-PCR) was used to examine mRNA expressions of aggrecan, collagen type II, hypoxia-inducible factor-1a (HIF-1a), glucose transporter1 (GLUT-1), and vascular endothelial growth factor (VEGF). RESULTS Significant differences were identified in almost all parameters compared with the control group in the 18G and 21G group at almost all time points. To assess the effect of different needle sizes on DHI, we used magnetic resonance imaging (MRI), grade, and mRNA expression. We found significant differences between different groups, except for DHI between the 21G group and 25G group and MRI grade between the 18G and 21G group at the 2-week time point. In assessing the effect of different needle sizes on HE staining score and toluidine blue staining grade, statistical differences were observed at some time points. The effects of time on all parameters were significant at almost all time points in all groups. CONCLUSIONS The middle-size needle (21G) performed better in inducing disc degeneration. The 2-week time point may be better for use in further experimental studies.


Conflict of interest statement

Conflicts of interest

None.

Figures

Figure 1
Figure 1
(A) Representative X-ray images of rat tail punctured by needles of all sizes, obtained at different time points. (B) The disc heights began to decrease in the 18G group from 2-week time point and 21G group from 4-week time point. CTL – control; DHI – disc height index. * Compared with control.
Figure 2
Figure 2
(A) Representative MRI images of rat tail punctured by all needle sizes obtained at different time points. (B) The MRI grade began to increase in the 18G and 21G group from 2-week time point. CTL – control; MRI – magnetic resonance imaging. * Compared with control group.
Figure 3
Figure 3
HE staining sections of the rat tail discs punctured by all sizes of needles, obtained at different time points. The control group exhibited intact AF, rounded NP and well-defined border between them, whereas the punctured discs exhibited disordered AF, fewer NP cells, and with an interrupted border (HE, 40×). CTL – control.
Figure 4
Figure 4
(A) HE staining score of the rat tail discs punctured by all sizes of needles, obtained at different time points. (B) Toluidine blue staining grade of the rat tail discs punctured by all sizes of needles, obtained at different time points. CTL – control. * Compared with control group; # compared with 18G group; & compared with 21G group.
Figure 5
Figure 5
Toluidine blue staining sections of the rat tail discs punctured by all sizes of needles, obtained at different time points. The control group exhibited NP chondrocytes and positive proteoglycan staining, whereas the punctured discs demonstrated fewer NP chondrocytes and a reduction in the intensity of staining (Toluidine blue, 40×). CTL – control.
Figure 6
Figure 6
The relative mRNA expressions of aggrecan and collagen type II of the rat tail discs punctured by all sizes of needles, obtained at different time points. (A) Aggrecan relative expression. (B) Collagen type II relative expression. CTL – control. * Compared with control group; # compared with 18G group; & compared with 21G group.
Figure 7
Figure 7
The relative mRNA expressions of HIF-1α, GLUT-1 and VEGF of the rat tail discs punctured by all sizes of needles, obtained at different time points. (A) HIF-1α relative expression. (B) GLUT-1 relative expression. (C) GLUT-1 relative expression. CTL – control; HIF-1α – hypoxia-inducible factor-1α; GLUT-1 – glucose transporter1; VEGF – vascular endothelial growth factor. * Compared with control group; # compared with 18G group; & compared with 21G group.

References

    1. Hoy D, March L, Brooks P, et al. The global burden of low back pain: Estimates from the Global Burden of Disease 2010 study. Ann Rheum Dis. 2014;73:968–74. - PubMed
    1. Hoy D, Brooks P, Blyth F, et al. The epidemiology of low back pain. Best Pract Res Clin rheumatol. 2010;24:769–81. - PubMed
    1. Katz JN. Lumbar disc disorders and low-back pain: Socioeconomic factors and consequences. J Bone Joint Surg Am. 2006;88(Suppl 2):21–24. - PubMed
    1. Zheng CJ, Chen J. Disc degeneration implies low back pain. Theor Biol Med Model. 2015;12:24. - PMC - PubMed
    1. Weber KT, Jacobsen TD, Maidhof R, et al. Developments in intervertebral disc disease research: Pathophysiology, mechanobiology, and therapeutics. Curr Rev Musculoskelet Med. 2015;8:18–31. - PMC - PubMed

MeSH terms

Substances