. 2018 Nov;12(11):1980-2005.
doi: 10.1002/1878-0261.12381. Epub 2018 Oct 2.

A pan-cancer atlas of cancer hallmark-associated candidate driver lncRNAs

Affiliations

A pan-cancer atlas of cancer hallmark-associated candidate driver lncRNAs

Yulan Deng et al. Mol Oncol. 2018 Nov.

Abstract

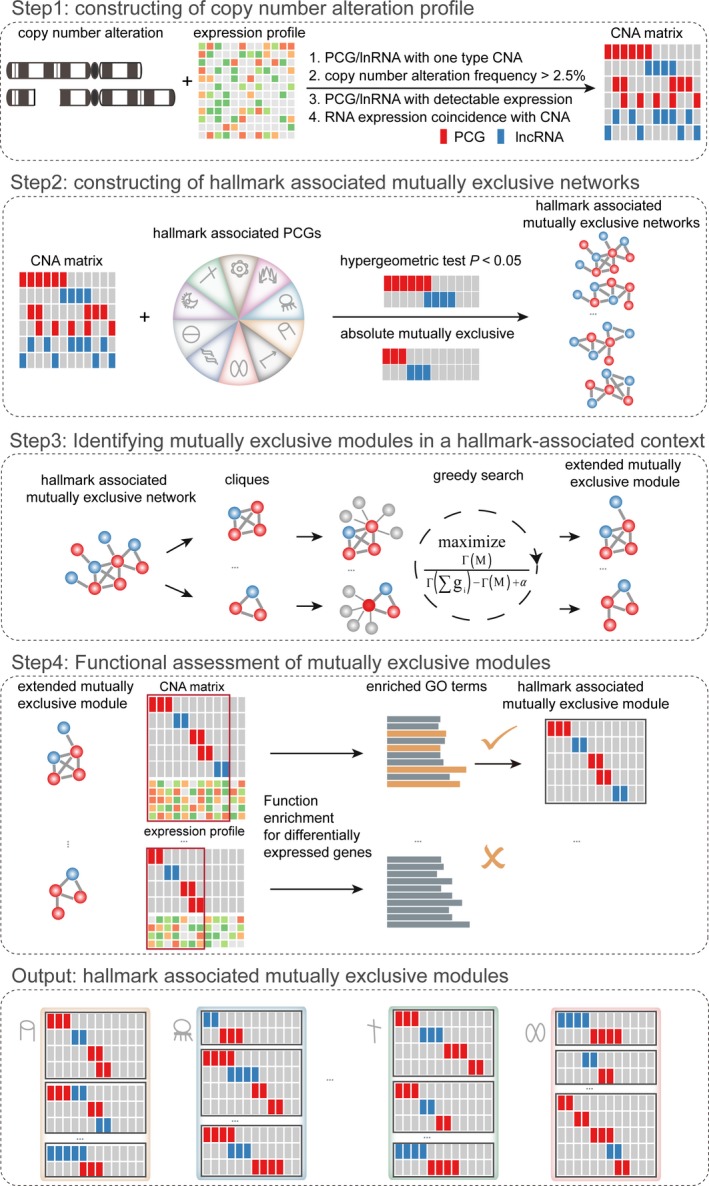
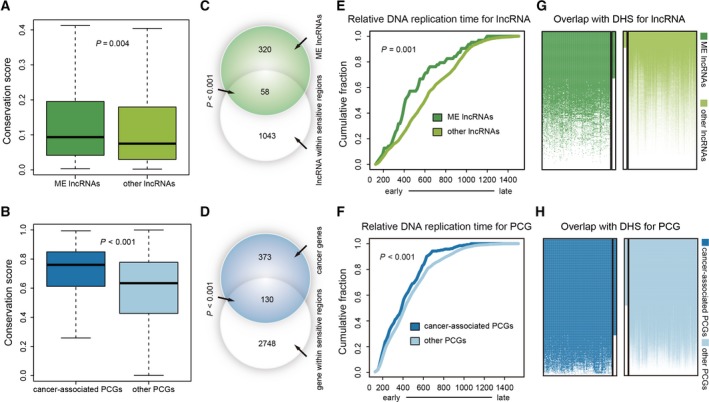
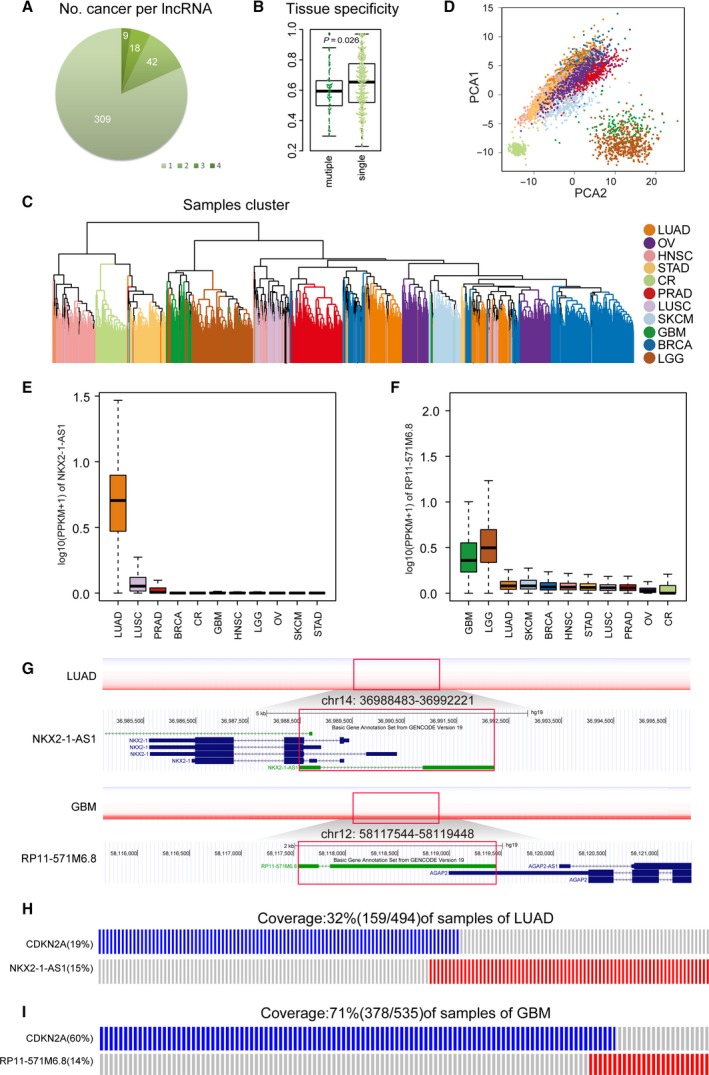
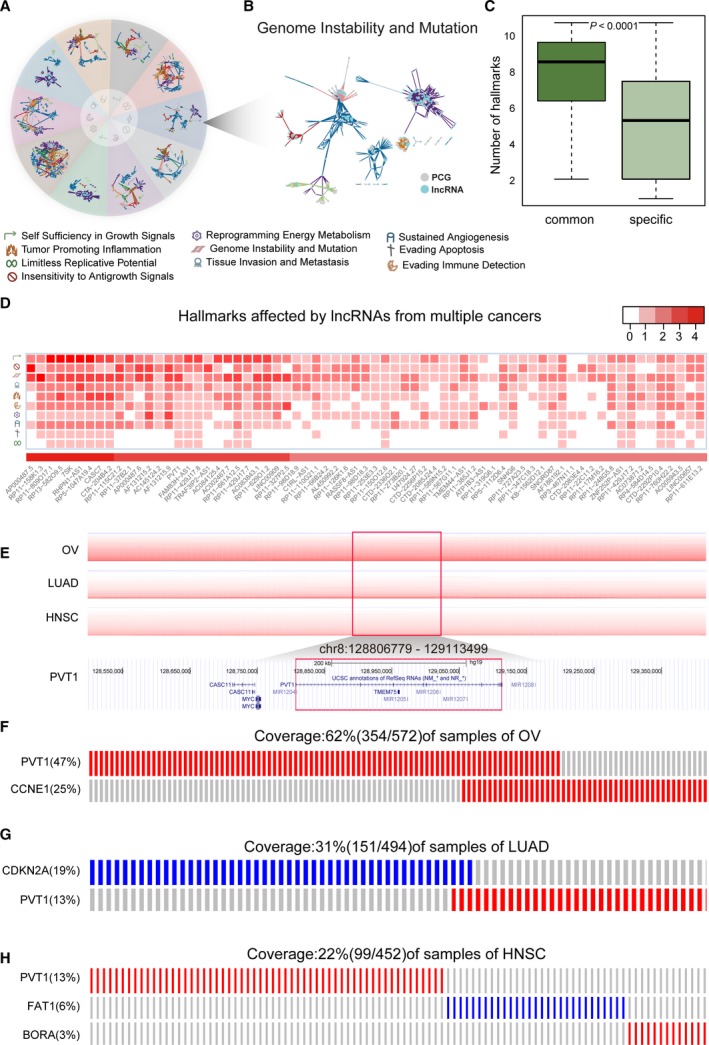
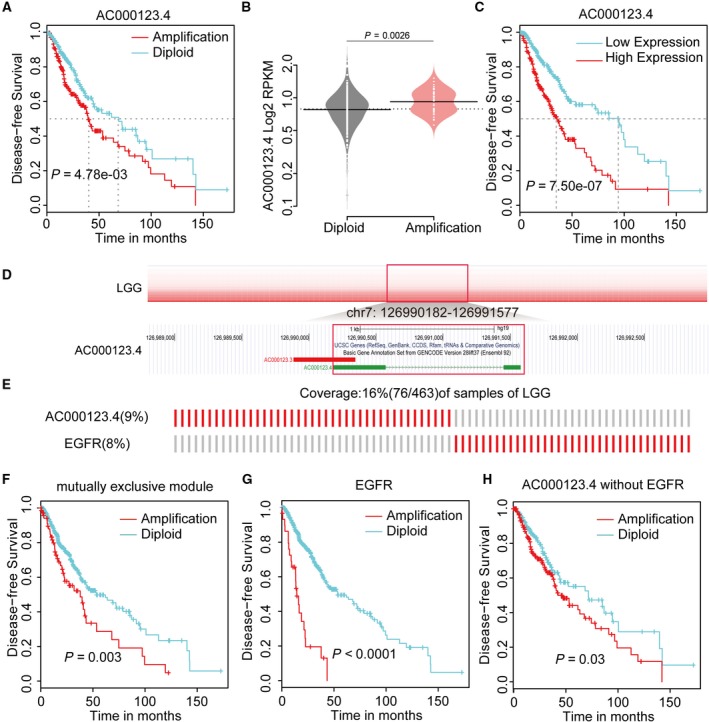
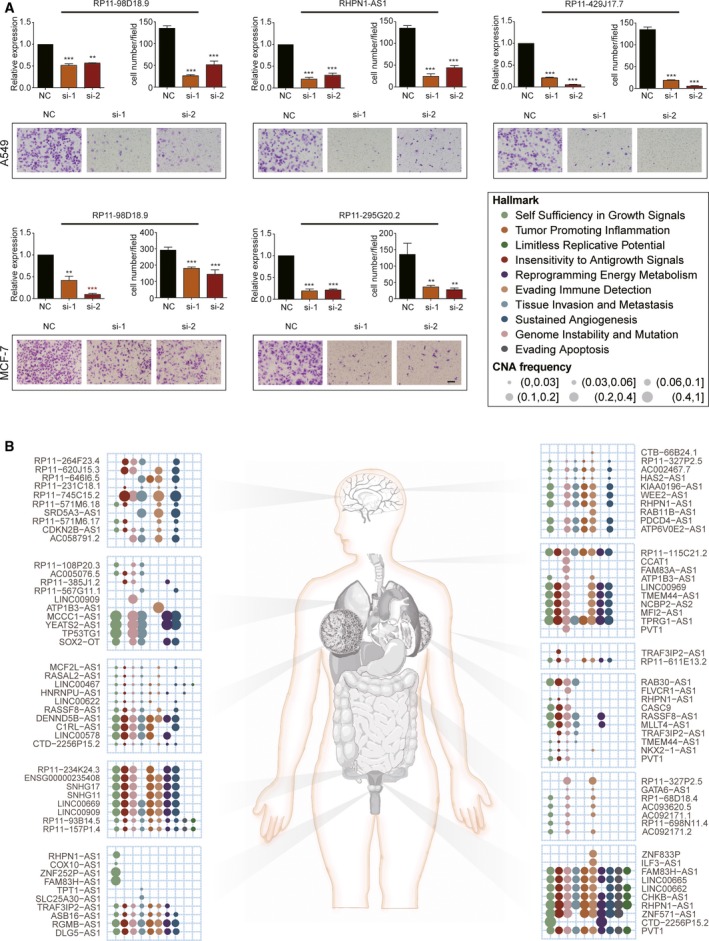
Substantial cancer genome sequencing efforts have discovered many important driver genes contributing to tumorigenesis. However, very little is known about the genetic alterations of long non-coding RNAs (lncRNAs) in cancer. Thus, there is a need for systematic surveys of driver lncRNAs. Through integrative analysis of 5918 tumors across 11 cancer types, we revealed that lncRNAs have undergone dramatic genomic alterations, many of which are mutually exclusive with well-known cancer genes. Using the hypothesis of functional redundancy of mutual exclusivity, we developed a computational framework to identify driver lncRNAs associated with different cancer hallmarks. Applying it to pan-cancer data, we identified 378 candidate driver lncRNAs whose genomic features highly resemble the known cancer driver genes (e.g. high conservation and early replication). We further validated the candidate driver lncRNAs involved in 'Tissue Invasion and Metastasis' in lung adenocarcinoma and breast cancer, and also highlighted their potential roles in improving clinical outcomes. In summary, we have generated a comprehensive landscape of cancer candidate driver lncRNAs that could act as a starting point for future functional explorations, as well as the identification of biomarkers and lncRNA-based target therapy.

Keywords: cancer hallmark; copy number alteration; driver lncRNA; mutual exclusivity; pan-cancer atlas.


Figures

Figure 1
Figure 1
Copy number alterations of lncRNA in cancers. (A) A genome‐wide view of CNAs in lncRNA‐containing loci in cancers. Each track shows the frequency of lncRNA CNAs in one cancer type. (B) The lncRNAs and PCGs in the top 10 representative peaks in GBM. The numbers of PCGs (left) and lncRNAs (right) in each peak are indicated in parentheses. Pie chart of each peak shows the proportion of PCG and lncRNA in the peak. (C) The frequencies of CNAs for lncRNAs and PCGs across cancers. (D) Percentages of PCGs (left) and lncRNAs (right) with concordant CNA and mRNA expression. (E) Copy number profiles of chromosome 7p (upper) and a zoom‐in region (lower) from GBM specimens. The positions of lncRNA RP11‐745C15.2 are noted with black vertical lines. (F) RP11‐745C15.2 expression levels in amplified and normal samples in GBM.
Figure 2
Figure 2
The overview of identification of hallmark‐associated mutually exclusive modules.
Figure 3
Figure 3
The PCGs and lncRNAs in mutually exclusive modules across 11 major cancer types. (A) The frequencies of CNA for lncRNAs from modules (left) and other lncRNAs (right) (*< 0.05, permutation test). (B) Percentages of sample covered by lncRNAs in the modules. (C,D) The modules of lncRNA SOX2‐OT and LINCPINT. Each column represents three tumor samples. (E) The percentage of PCGs from modules (red arrow) and from permutations (curve) that overlap with cancer‐associated PCGs (*< 0.05, **< 0.01, ***< 0.001, permutation test). (F) The overlap between lncRNAs from modules (n = 378) and cancer‐associated lncRNAs (n = 220) with 13 869 lncRNAs as background (hypergeometric test). (G) The size of clusters in STRING for PCGs from modules (red arrow) and permutations (curve) (*< 0.05, **< 0.01, ***< 0.001, permutation test). (H–J) The modules of lncRNA ANRIL, NORAD and MIR31HG from GBM, CR and LUSC, respectively. Each column represents three tumor samples for GBM and one tumor sample for CR and LUSC.
Figure 4
Figure 4
Properties of driver lncRNAs: conservation, chromatin accessibility and early replication. (A,B) Comparison of phastCons score between lncRNAs from modules/cancer‐associated PCGs and other lncRNAs/PCGs. (C,D) Venn diagrams showing the overlap of lncRNAs (n = 1101)/PCGs (n = 503) located in sensitive regions and lncRNAs from modules (n = 378)/cancer‐associated PCGs (n = 2878) with 13 869 lncRNAs or 18 992 PCGs as background. (E,F) Cumulative distribution of replication timing is shown for lncRNAs from modules/cancer‐associated PCGs and other lncRNAs/PCGs. (G,H) Heatmaps show the overlap between lncRNAs from modules/cancer‐associated PCGs and DHS from 125 cell lines. Each row indicates a lncRNA/PCG, and each column indicates a cell line. The vertical bars beside heatmaps indicate the percentage of lncRNAs/PCGs that overlaps with DHS in all of the 125 cell lines. The ME lncRNAs in figures indicate lncRNAs from mutually exclusive modules.
Figure 5
Figure 5
Cancer‐specific driver lncRNAs. (A) The distribution of driver lncRNAs that were identified from single or multiple cancers. (B) The difference of tissue specificity score between cancer‐specific driver lncRNAs and common driver lncRNAs. (C) Hierarchical clustering of the expression data based on cancer‐specific driver lncRNA. (D) Principal component analysis of cancer‐specific driver lncRNAs showing clustering of tumors from the same or related cancer types. (E,F) Box plots showing the expression of cancer‐specific lncRNA NKX2‐1‐AS1 (LUAD) and RP11‐571M6.8 (GBM). (G) Copy‐number profiles of NKX2‐1‐AS1 (upper) and RP11‐571M6.8 (lower), respectively, from LUAD and GBM specimens and their genome browser shots. The positions of lncRNA NKX2‐1‐AS1 and RP11‐571M6.8 are shown inside the red boxes. (H,I) The mutually exclusive modules of cancer‐specific lncRNA NKX2‐1‐AS1 (upper) and lncRNA RP11‐571M6.8 (lower). Each column represents three tumor samples for GBM and one for LUAD.
Figure 6
Figure 6
Common driver lncRNAs. (A,B) Mutually exclusive relationship from modules associated with each cancer hallmark. (C) Box plots showing the difference of the number of hallmarks affected by cancer‐specific driver lncRNAs and common driver lncRNAs. (D) Hallmarks affected by common driver lncRNAs. Intensity of the red color corresponds to the number of cancers shown in the legend. (E) Copy number profiles of PVT1 from OV, LUAD and HNSC specimens and its genome browser shot. The positions of lncRNA PVT1 are shown inside the red boxes. (F–H) The mutually exclusive modules of lncRNA PVT1 from LUAD, HNSC and OV, respectively. Each column represents three tumor samples for OV: two for LUAD and one for HNSC.
Figure 7
Figure 7
Clinical benefits of driver lncRNAs. (A) Kaplan–Meier plot of DFS of LGG patients grouped by copy number status of lncRNA AC000123.4. (B) The expression of AC000123.4 was correlated with copy number alterations. (C) Kaplan–Meier plots of DFS of LGG patients grouped by expression of lncRNA AC000123.4. (D) Copy number profile of AC000123.4 from LGG specimens and its genome browser shot. The positions of lncRNA AC000123.4 are shown inside the red boxes. (E) The mutually exclusive module of lncRNA AC000123.4 and EGFR. (F) The samples covered by mutually exclusive modules containing AC000123.4 and EGFR, showing poor prognosis. (G) Kaplan–Meier plots of DFS of LGG patients grouped by copy number status of EGFR. (H) Kaplan–Meier plots of DFS of LGG patients without EGFR alteration, grouped by copy number status of AC000123.4.
Figure 8
Figure 8
A comprehensive landscape of driver lncRNAs. (A) Validation of lncRNAs that are associated with the hallmark ‘Tissue Invasion and Metastasis’ in A549 and MCF‐7 cell lines, respectively. A quantitative PCR assay was performed to assess the efficiencies of lncRNAs. GAPDH acted as internal control. The Transwell migration assay was performed to assess the migration assay. Cells were fixed and stained with crystal violet. Representative photographs (magnification, 100×) are shown. The number of migration cell was counted. Data are presented as the mean ± SD of three independent experiments (**< 0.01, ***< 0.001, unpaired Student's t test). (B) A comprehensive landscape of hallmark‐associated driver lncRNAs in 11 cancer types. For each cancer type, 10 representative driver lncRNAs are shown. The color and size of the circle indicate cancer hallmarks and CNA frequencies in orresponding cancer type.

References

    1. Abbas T, Keaton MA and Dutta A (2013) Genomic instability in cancer. Cold Spring Harb Perspect Biol 5, a012914. - PMC - PubMed
    1. Alvarez S, Diaz M, Flach J, Rodriguez‐Acebes S, Lopez‐Contreras AJ, Martinez D, Canamero M, Fernandez‐Capetillo O, Isern J, Passegue E et al (2015) Replication stress caused by low MCM expression limits fetal erythropoiesis and hematopoietic stem cell functionality. Nat Commun 6, 8548. - PMC - PubMed
    1. Andrews T, Honti F, Pfundt R, de Leeuw N, Hehir‐Kwa J, Vulto‐van Silfhout A, de Vries B and Webber C (2015) The clustering of functionally related genes contributes to CNV‐mediated disease. Genome Res 25, 802–813. - PMC - PubMed
    1. Babur O, Gonen M, Aksoy BA, Schultz N, Ciriello G, Sander C and Demir E (2015) Systematic identification of cancer driving signaling pathways based on mutual exclusivity of genomic alterations. Genome Biol 16, 45. - PMC - PubMed
    1. Barretina J, Caponigro G, Stransky N, Venkatesan K, Margolin AA, Kim S, Wilson CJ, Lehar J, Kryukov GV, Sonkin D et al (2012) The cancer cell line encyclopedia enables predictive modelling of anticancer drug sensitivity. Nature 483, 603–607. - PMC - PubMed

Publication types

Associated data

LinkOut - more resources