. 2018 Dec 12;18(12):7590-7600.
doi: 10.1021/acs.nanolett.8b03149. Epub 2018 Sep 20.

Modifying a Commonly Expressed Endocytic Receptor Retargets Nanoparticles in Vivo

Modifying a Commonly Expressed Endocytic Receptor Retargets Nanoparticles in Vivo

Cory D Sago et al. Nano Lett. .

Abstract

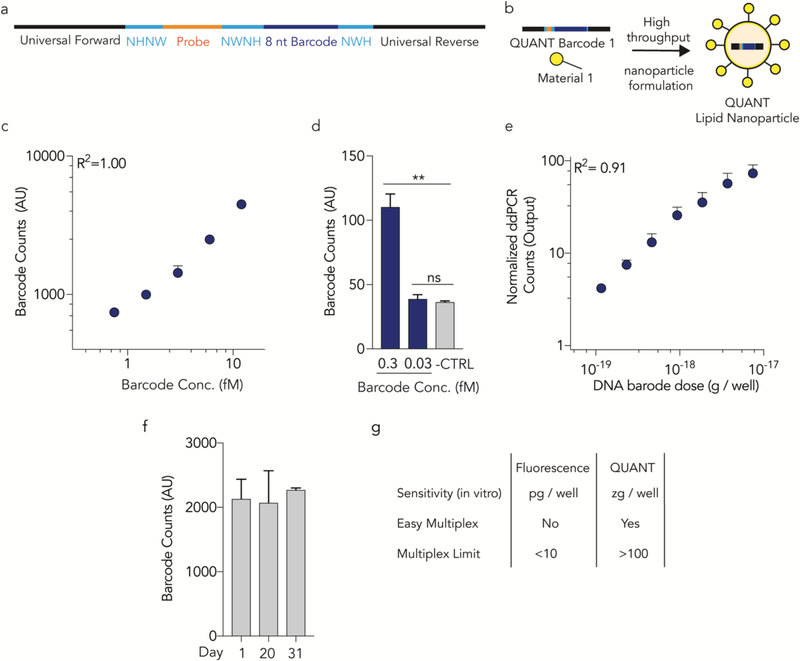
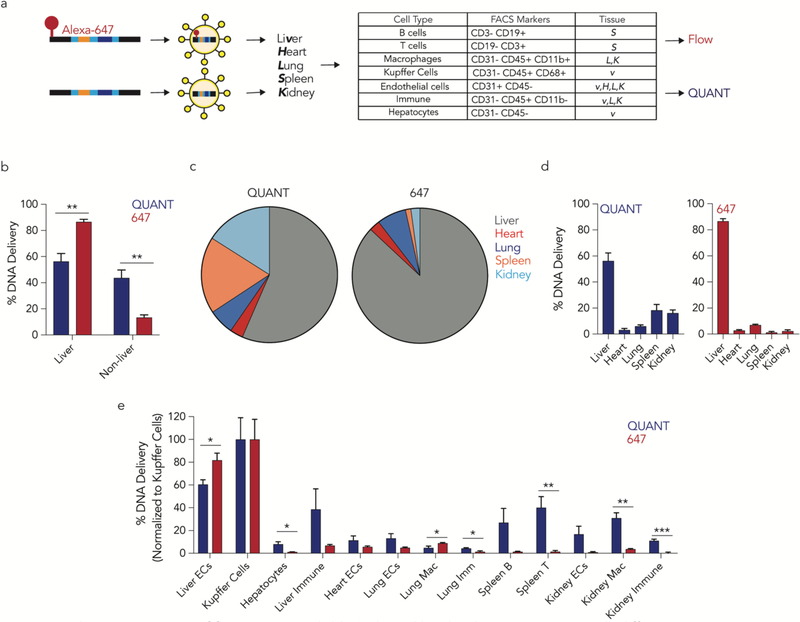
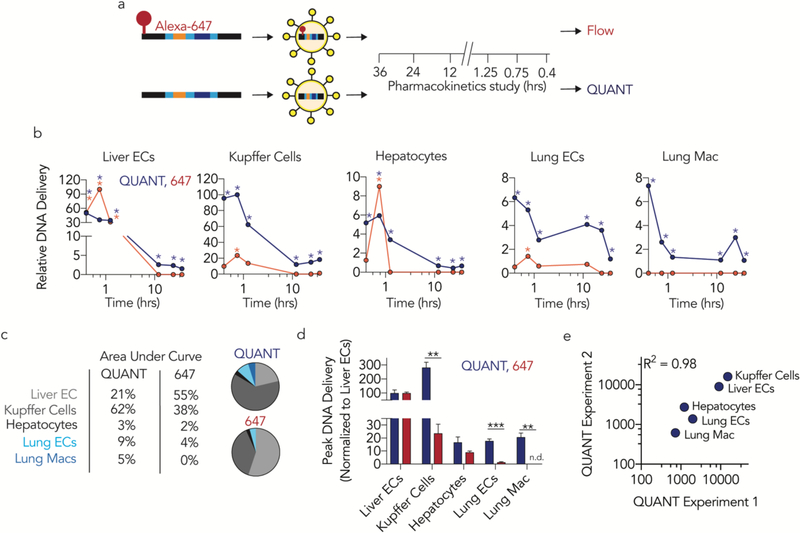
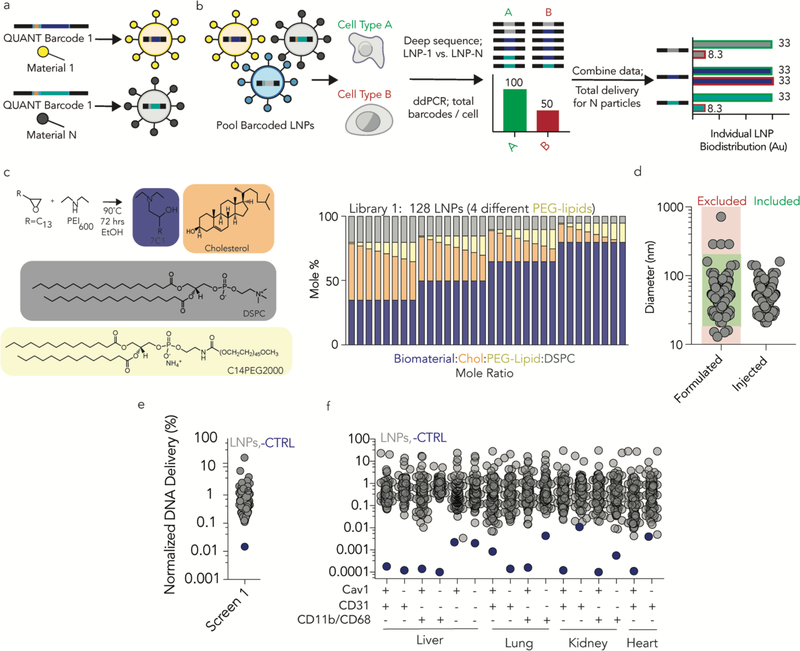
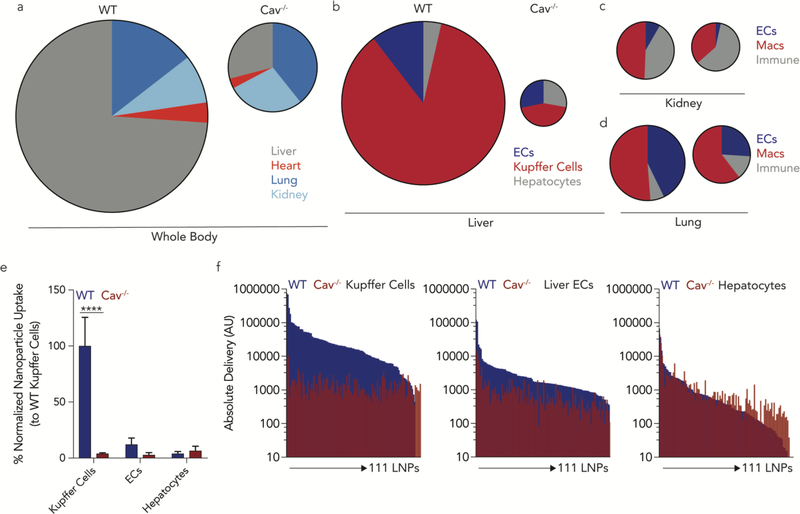
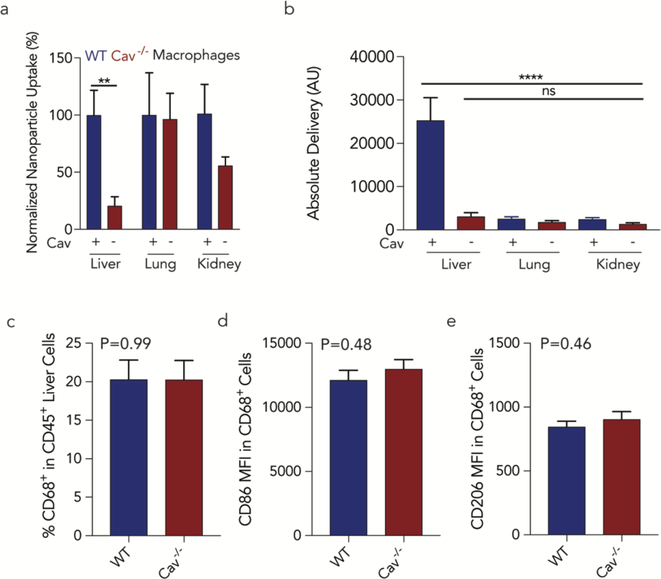
Nanoparticles are often targeted to receptors expressed on specific cells, but few receptors are (i) highly expressed on one cell type and (ii) involved in endocytosis. One unexplored alternative is manipulating an endocytic gene expressed on multiple cell types; an ideal gene would inhibit delivery to cell type A more than cell type B, promoting delivery to cell type B. This would require a commonly expressed endocytic gene to alter nanoparticle delivery in a cell type-dependent manner in vivo; whether this can occur is unknown. Based on its microenvironmental regulation, we hypothesized Caveolin 1 (Cav1) would exert cell type-specific effects on nanoparticle delivery. Fluorescence was not sensitive enough to investigate this question, and as a result, we designed a platform named QUANT to study nanoparticle biodistribution. QUANT is 108× more sensitive than fluorescence and can be multiplexed. By measuring how 226 lipid nanoparticles (LNPs) delivered nucleic acids to multiple cell types in vivo in wild-type and Cav1 knockout mice, we found Cav1 altered delivery in a cell-type specific manner. Cav1 knockout did not alter LNP delivery to lung and kidney macrophages but substantially reduced LNP delivery to Kupffer cells, which are liver-resident macrophages. These data suggest caveolin-mediated endocytosis of nanomedicines by macrophages varies with tissue type. These results suggest manipulating receptors expressed on multiple cell types can tune drug delivery.

Keywords: Caveolin; DNA barcode; Kupffer cell; ddPCR; drug delivery; nanoparticle.


Conflict of interest statement

Competing interests. C.D.S., M.P.L., and J.E.D. have filed for intellectual property related to material within this publication.

Figures

Figure 1.
Figure 1.
QUANT barcodes are rationally designed to provide highly sensitive readouts of nanoparticle delivery. (a) QUANT barcodes contain universal primer sites, an 8 nucleotide barcode region, a probe binding site, and split semi-randomized regions. These designs reduce DNA secondary structure and increase DNA polymerase access. (b) Barcodes can be formulated into chemically distinct lipid nanoparticles using high throughput microfluidics. (c) Standard curve of QUANT barcodes diluted in TE buffer; (d) barcodes can be identified above background at 300 aM concentrations. **p<0.01, 2 tailed ttest. (e) An in vitro standard curve; barcodes were quantified 24 hours after being delivered to cell using Lipofectamine 2000. (f) QUANT barcode readouts immediately after DNA was isolated from cells following in vivo nanoparticle delivery, or after the samples were stored at −20˚C for 20 or 31 days. Each experiment was performed using different stock reagents, demonstrating the repeatability of the assay. (g) Comparison of fluorescence and QUANT-based methods of analyzing nanoparticle biodistribution.
Figure 2.
Figure 2.
A direct comparison of fluorescent- and ddPCR-based biodistribution in vivo reveals differences. (a) QUANT barcodes with (or without) a fluorophore were formulated into a LNP and injected intravenously. Five tissues were isolated and barcode delivery to 13 cell types isolated by FACS was measured by QUANT or fluorescence. (b) Cumulative biodistribution measured by QUANT or fluorescence in liver and non-liver cell types. **p<0.01, 2 tailed t-test. (c,d) Cumulative biodistribution within the 5 tissues examined by QUANT and fluorescence. Fluorescence readouts overestimate liver delivery. (e) Comparison of biodistribution in the 13 cell types examined by QUANT and fluorescence. *p<0.05, **p<0.01, ***p<0.001, 2 tailed t-test. ECs; endothelial cells. Mac; macrophage. Imm; immune.
Figure 3.
Figure 3.
QUANT biodistribution is more sensitive than fluorescence in vivo. (a) QUANT barcodes with (or without) a fluorophore were formulated into LNPs, injected intravenously, and isolated at different timepoints. Nanoparticle distribution was measured using QUANT or fluorescence. (b) Relative nanoparticle biodistribution (normalized to maximal signal in any cell type) 0.4, 0.75, 1.25, 12, 24, and 36 hours after administration of a LNP carrying 647-QUANT barcode or QUANT barcodes at a dose of 0.5 mg / kg. Asterisk denotes a signal that was significantly different than PBS-treated mice. (c) Comparisons of area under the curve as measured by QUANT or fluorescence. Delivery to the lungs was underestimated by >3 fold by fluorescence. (d) Peak DNA delivery (normalized to liver ECs) as measured by QUANT and fluorescence. No fluorescent signal was detected in lung macrophages. **p<0.01, ***p<0.001 2 tailed t-test. (e) R2 analysis of QUANT absolutely counts from the 1 hour timepoint (Figure 2) and the 1.25 hour timepoint (Figure 3) across two experiments performed on separate days.
Figure 4.
Figure 4.
QUANT quantifies how over 100 LNPs deliver nucleic acids in wild-type and Cav1−/− mice. (a) Unique QUANT barcodes can be formulated into chemically distinct nanoparticles. (b) QUANT ddPCR readouts can be coupled with deep sequencing to measure absolute delivery mediated by >100 LNPs at once in vivo. (c) LNP library 1 was synthesized with the amine 7C1, Cholesterol, DSPC, and PEG compounds at variable molar ratios; 128 different LNPs were formulated for screen 1. (d) The diameter of each LNP in screen 1 was measured individually; stable LNPs, with diameters between 20 and 200 nm were included. (e) The average normalized delivery from all LNPs and the naked barcode (negative control) from screen 1. (f) As expected, the naked barcode – which was the negative control – was delivered less efficiently than barcodes carried by LNPs in every cell type, both in WT mice and Cav1−/− mice.
Figure 5.
Figure 5.
High throughput QUANT studies reveal Caveolin1 affects delivery in a tissue- and cell-type dependent manner in vivo. (a) The total ddPCR counts in all tested cell types – which are equal to the area of the circle - were used to determine the ‘total experimental’ biodistribution in WT and Cav1−/− mice. (b) The total ddPCR counts were determined in different cell-types from the liver, (c) lung and (d) kidney. Compared to cells isolated from wild-type mice, ddPCR counts from Cav1−/− decreased, with the most dramatic effect in the liver. (e) Within the liver cell-types, normalized library 1 nanoparticle biodistribution demonstrates that Kupffer cells in Cav1−/− uptake less nucleic acids when compared to Kupffer cells from wild-type mice. ****p<0.0001 2-way ANOVA. (f) Combined sequencing data and ddPCR results shows the absolute delivery of 111 nanoparticles for each LNP in the liver in wild type (blue) and Cav1−/− (red) mice, from library 1, in Kupffer cells, liver endothelial cells, and hepatocytes.
Figure 6.
Figure 6.
Caveolin1 significantly affects delivery in Kupffer cells in vivo. (a) Nanoparticle biodistribution in macrophages were isolated from multiple tissues from wild-type and Cav1−/− mice. Lung and kidney macrophages were less impacted by the loss of caveolin. **p<0.01 1-tailed t-test. (b) Absolute nanoparticle delivery to wild-type and Cav1−/− macrophages in the liver, lung, and kidney. Kupffer cells were statistically significant compared to other macrophage beds. ****p<0.0001 One-way ANOVA. (c) The percentage of Kupffer cells (CD68+ CD45+) within the immune cell population (CD45+) in wild-type and Cav1−/− mice were similar. Phenotype variations in wild-type and Cav1−/− Kupffer (CD68+ CD45+) cells populations were determined by MFI of (d) CD86 and (e) CD206.

References

    1. Pasi KJ; Rangarajan S; Georgiev P; Mant T; Creagh MD; Lissitchkov T; Bevan D; Austin S; Hay CR; Hegemann I; Kazmi R; Chowdary P; Gercheva-Kyuchukova L; Mamonov V; Timofeeva M; Soh CH; Garg P; Vaishnaw A; Akinc A; Sorensen B; Ragni MV N Engl J Med 2017, 377, (9), 819–828. - PubMed
    1. Adams D; Gonzalez-Duarte A; O’Riordan WD; Yang CC; Ueda M; Kristen AV; Tournev I; Schmidt HH; Coelho T; Berk JL; Lin KP; Vita G; Attarian S; Plante-Bordeneuve V; Mezei MM; Campistol JM; Buades J; Brannagan TH 3rd; Kim BJ; Oh J; Parman Y; Sekijima Y; Hawkins PN; Solomon SD; Polydefkis M; Dyck PJ; Gandhi PJ; Goyal S; Chen J; Strahs AL; Nochur SV; Sweetser MT; Garg PP; Vaishnaw AK; Gollob JA; Suhr OB N Engl J Med 2018, 379, (1), 11–21. - PubMed
    1. Coelho T; Adams D; Silva A; Lozeron P; Hawkins PN; Mant T; Perez J; Chiesa J; Warrington S; Tranter E; Munisamy M; Falzone R; Harrop J; Cehelsky J; Bettencourt BR; Geissler M; Butler JS; Sehgal A; Meyers RE; Chen Q; Borland T; Hutabarat RM; Clausen VA; Alvarez R; Fitzgerald K; Gamba-Vitalo C; Nochur SV; Vaishnaw AK; Sah DW; Gollob JA; Suhr OB N Engl J Med 2013, 369, (9), 819–29. - PubMed
    1. Lorenzer C; Dirin M; Winkler AM; Baumann V; Winkler J J Control Release 2015, 203, 1–15. - PubMed
    1. Tsoi KM; MacParland SA; Ma XZ; Spetzler VN; Echeverri J; Ouyang B; Fadel SM; Sykes EA; Goldaracena N; Kaths JM; Conneely JB; Alman BA; Selzner M; Ostrowski MA; Adeyi OA; Zilman A; McGilvray ID; Chan WC Nat Mater 2016, 15, (11), 1212–1221. - PMC - PubMed

Publication types

MeSH terms