Comparative Study
. 2018 Sep 14;19(1):675.
doi: 10.1186/s12864-018-5042-x.

Cryptic sequence features in the active postmortem transcriptome

Affiliations
Comparative Study

Cryptic sequence features in the active postmortem transcriptome

Peter A Noble et al. BMC Genomics. .

Abstract

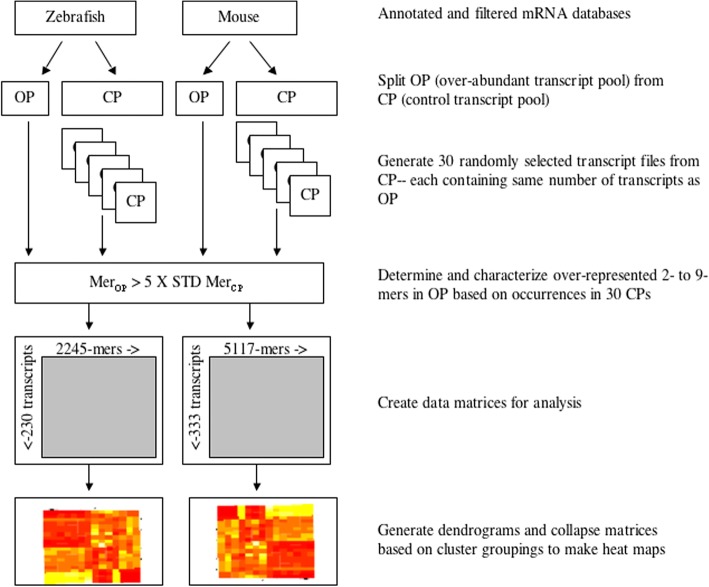
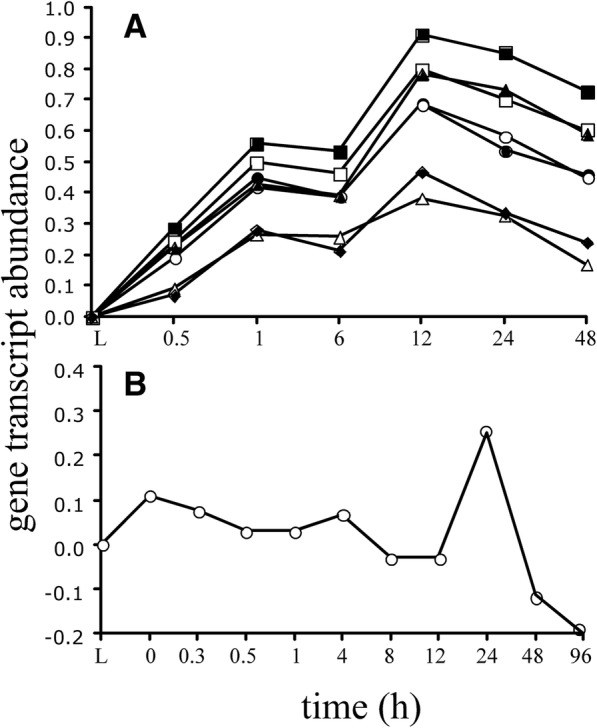
Background: Our previous study found that more than 500 transcripts significantly increased in abundance in the zebrafish and mouse several hours to days postmortem relative to live controls. The current literature suggests that most mRNAs are post-transcriptionally regulated in stressful conditions. We rationalized that the postmortem transcripts must contain sequence features (3- to 9- mers) that are unique from those in the rest of the transcriptome and that these features putatively serve as binding sites for proteins and/or non-coding RNAs involved in post-transcriptional regulation.

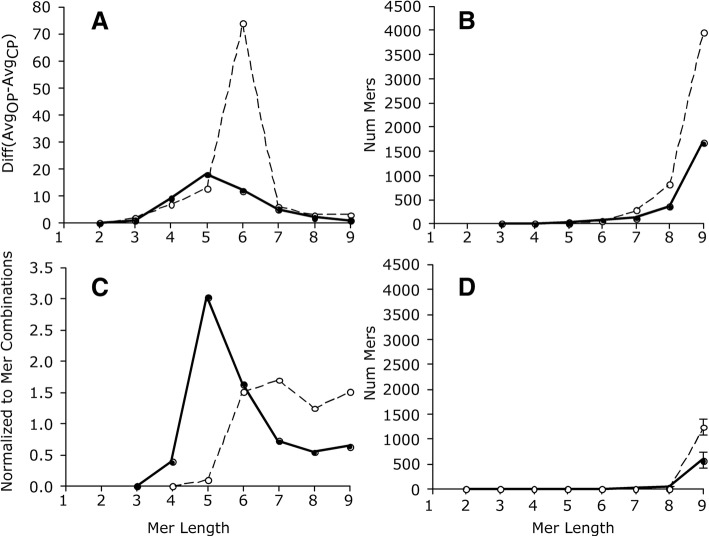
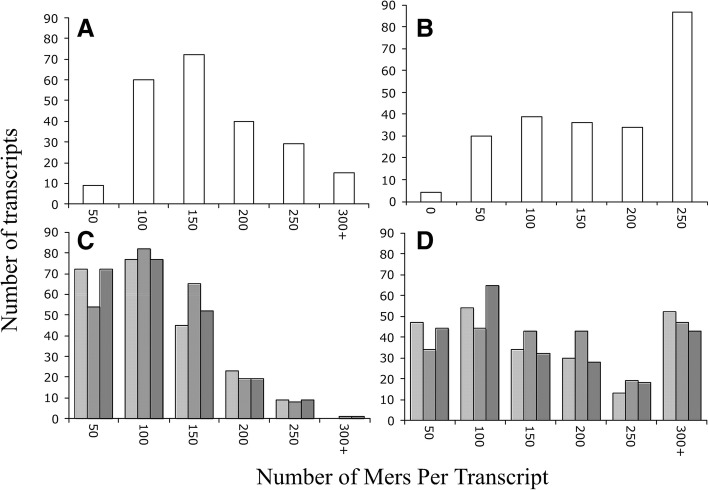
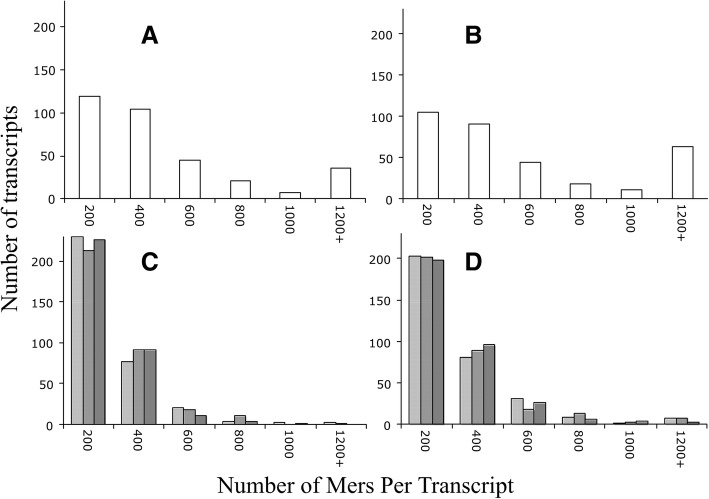
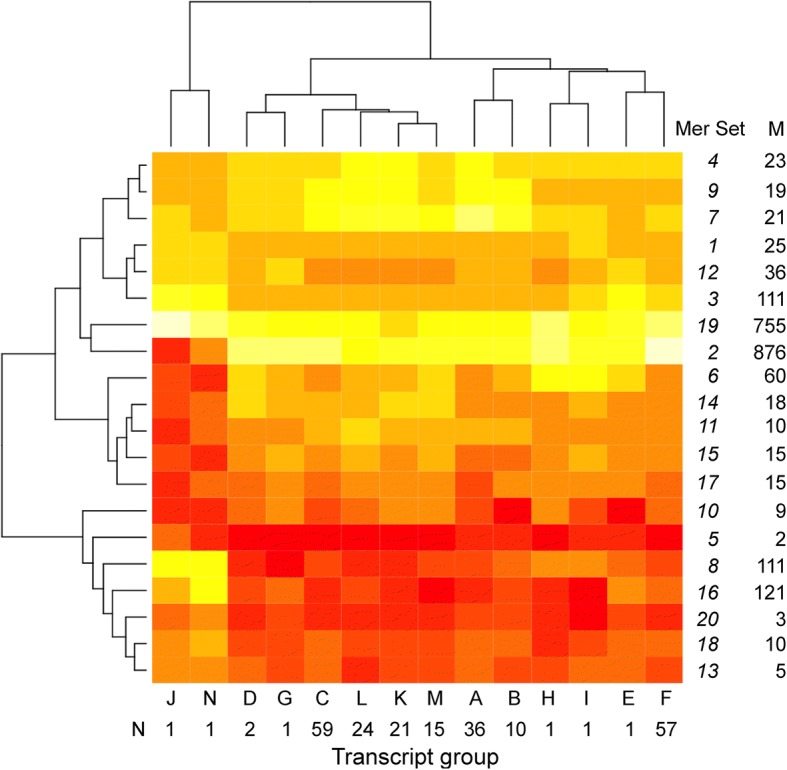
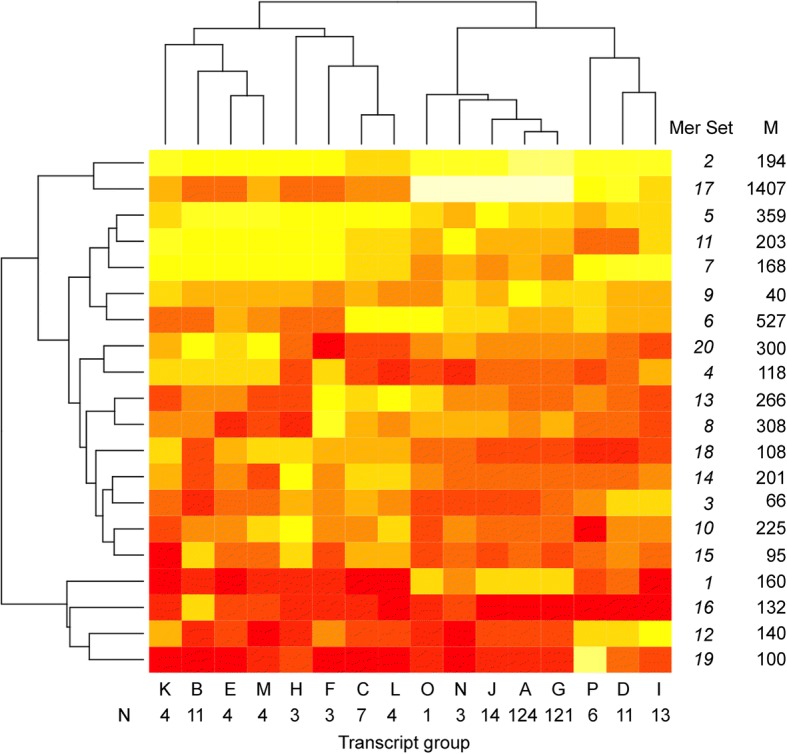
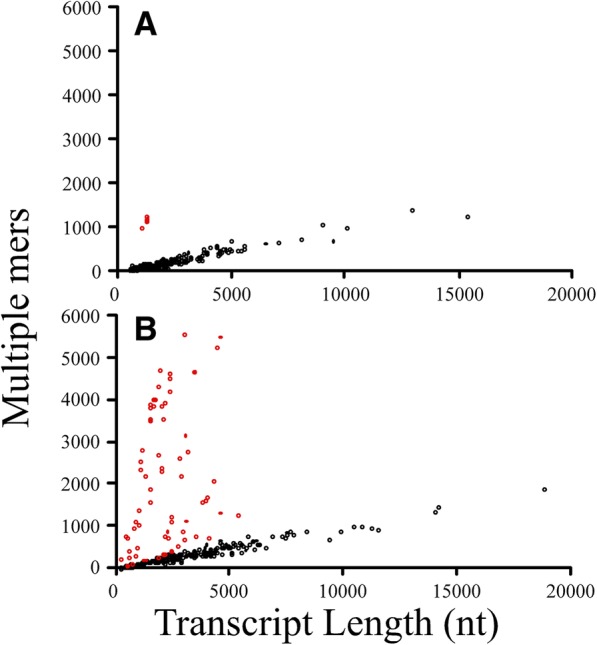
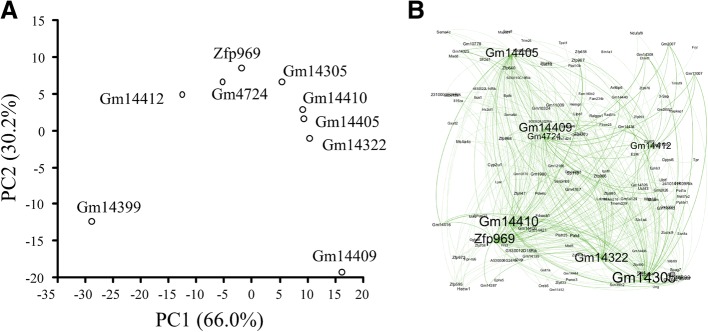
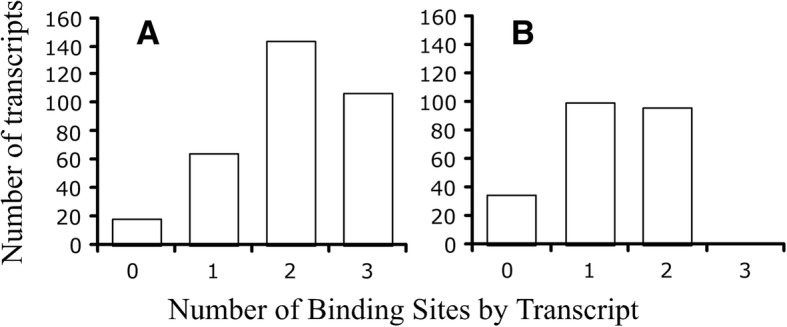
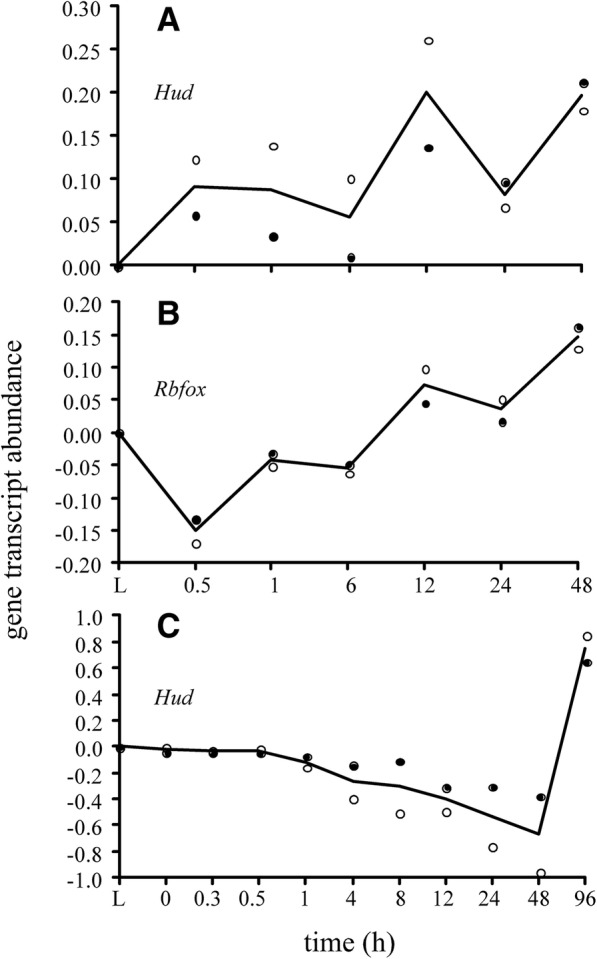
Results: We identified 5117 and 2245 over-represented sequence features in the mouse and zebrafish, respectively, which represents less than 1.5% of all possible features. Some of these features were disproportionately distributed along the transcripts with high densities in the 3' untranslated regions of the zebrafish (0.3 mers/nt) and the open reading frames of the mouse (0.6 mers/nt). Yet, the highest density (2.3 mers/nt) occurred in the open reading frames of 11 mouse transcripts that lacked 3' or 5' untranslated regions. These results suggest the transcripts with high density of features might serve as 'molecular sponges' that sequester RNA binding proteins and/or microRNAs, and thus indirectly increase the stability and gene expression of other transcripts. In addition, some of the features were identified as binding sites for Rbfox and Hud proteins that are also involved in increasing transcript stability and gene expression.

Conclusions: Our results are consistent with the hypothesis that transcripts involved in responding to extreme stress, such as organismal death, have sequence features that make them different from the rest of the transcriptome. Some of these features serve as putative binding sites for proteins and non-coding RNAs that determine transcript stability and fate. A small number of the transcripts have high density sequence features, which are presumably involved in sequestering RNA binding proteins and microRNAs and thus preventing regulatory interactions among other transcripts. Our results provide baseline data on post-transcriptional regulation in stressful conditions that has implications for regulation in disease, starvation, and cancer.

Keywords: 3’UTR; 5’UTR; Chaos game representation; Molecular sponge; Motifs; Mouse; ORFs; Post-transcriptional regulation; Postmortem gene expression; Sequence features; Stress response; Zebrafish.


Conflict of interest statement

Ethics approval and consent to participate

Not applicable, all data publicly available.

Consent for publication

Not applicable.

Competing interests

The authors declare that they have no competing interests.

Publisher’s Note

Springer Nature remains neutral with regard to jurisdictional claims in published maps and institutional affiliations.

Figures

Fig. 1
Fig. 1
Schematic representation of the study experimental design
Fig. 2
Fig. 2
Mer counts as a function of mer length. Hatched line, mouse; solid line, zebrafish. Panel a, Difference in average mer counts by group (OP vs. CP); Panel b, individual mer counts that were 5 time stdev of average of the CP; Panel c, is the same results as panel B except normalized to the number of possible mer combinations and shown as a percentage; Panel d, number of mer counts that were 5 times stdev of the average CP due to random chance; average ± stdev of 3 random selections (without replacement)
Fig. 3
Fig. 3
Distribution of unique mers per gene transcript in the zebrafish. a, unique mers in OP; b, multiple unique mers in OP; c, unique mers in CP (3 independent random selections; each as a different shade of grey); d, multiple unique mers in CP (3 independent random selections)
Fig. 4
Fig. 4
Distribution of unique mers per gene transcript in the mouse. a, unique mers in OP of the mouse; b, multiple unique mers in OP of the mouse; c, unique mers in CP of mouse (3 independent random selections; each displayed as a different shade of grey); d, multiple unique mers in CP of the mouse (3 independent random selections)
Fig. 5
Fig. 5
Heatmap of transcript groups and mer sets for the zebrafish. M, count of mers in group; N, count of transcripts in group. White, high count; yellow-orange, median count; red, low count
Fig. 6
Fig. 6
Heatmap of Transcript groups and mer sets for the mouse. M, count of mers in group; N, count of transcripts in group. White, high count; yellow-orange, median count; red, low count
Fig. 7
Fig. 7
Number of multiple unique mers in transcripts versus transcript length. a, zebrafish; b, mouse; Red, deviant transcripts. Red dots in the zebrafish correspond to Pimr transcripts; Red dots in the mouse represent 47 transcripts (see text)
Fig. 8
Fig. 8
Ordination plot of transcripts with high mer densities (a) and network of transcripts with shared mers (b). The ordination was based on the correlations among mouse brain transcript profiles. The network was based on the number of shared mers in subset of the transcript profiles with high R2 (> 0.95) to the transcripts with high mer densities. The network shows that the transcripts with high mer densities (i.e., molecular sponges) shared mers with many other transcripts
Fig. 9
Fig. 9
Number of known binding sites per transcripts for the mouse (a) and zebrafish (b). Total number of transcripts for the mouse, n = 333 and for the zebrafish, n = 230. The following binding sites were examined: Hud binding site, YUNNYUY [21]; Rbfox binding site, UGCAUG [10]; and UAUUUAU, GAGAAAA, AGAGAAA, UUUGCAC, AUGUGAA, UUGCACA, GGGAAGA [22]. Note: the zebrafish did not have Rbfox binding sites
Fig. 10
Fig. 10
Gene transcript abundances measured by a calibrated microarray [41, 42] (log transformed) by postmortem time. Abundances were normalized to flash frozen live controls (L). Black line, average. (a) Hud transcript in mouse; black dots, averaged abundance measured by probe A_55_P1990309 (n = 3 replicates for each dot except 48 h where n = 2 replicates); white dots, average abundance measured by probe A_55_P1990314; (b) Rbfox transcript in mouse; black dots, average abundance measured by probe A_55_P195339` (n = 3 replicates for each dot except last where n = 2 replicates); white dots, average abundance of probe A_55_P1953400; (c) Hud transcript in zebrafish; black dots, average abundance of probe A_15_P119510 (n = 2 replicates for each dot); white dots, average abundance of probe A_15_P120793. Data are from ref. [4]
Fig. 11
Fig. 11
Gene transcript abundances measured by a calibrated microarray [41, 42] (log transformed) by postmortem time. Abundances were normalized to flash frozen live controls (L). Black line, average. (a) Mouse: Open circle, represents Gm11007, Gm2007, Gm4631, Gm14434, Gm2026, Gm14305, Gm14399, Gm14325, Zfp969, Gm4724, Gm14326 transcripts; closed circle, Zfp967, Zfp969, Zfp968; open square, Gm14410; closed square, Gm14305; open triangle, Gm14322; closed triangle, Gm14308; closed diamond, Gm14412. All points are the average of 3 replicates per sample time except the 48 h, which is the average of 2 replicates. (b) Zebrafish: Pimr transcript. Each point in the zebrafish represents the average of two individuals per sample time. Data are from ref. [4]

References

    1. Harvey R, Dezi V, Pizzinga M, Willis AE. Post-transcriptional control of gene expression following stress: the role of RNA-binding proteins. Biochem Soc T. 2017;45:1007–1014. doi: 10.1042/BST20160364. - DOI - PMC - PubMed
    1. Hogg JR, Collins K. Structured non-coding RNAs and the RNP renaissance. Curr Opin Chem Biol. 2008;12:684–689. doi: 10.1016/j.cbpa.2008.09.027. - DOI - PMC - PubMed
    1. Ferreira PG, Muñoz-Aguirre M, Reverter F, Sá Godinho CP, Sousa A, Amadoz A, Sodaei R, Hidalgo MR, Pervouchine, Dmitri, Carbonell-Caballero J, Nurtdinov R, Breschi A, Amador R, Oliveira P, Çubuk C, Curado J, Aguet F, Oliveira C, Dopazo J, Sammeth M, Ardlie KG, Guigó R. The effects of death and post-mortem cold ischemia on human tissue transcriptomes. Nat Commun. 2018;490:2041–1723. doi: 10.1038/s41467-017-02772-x. - DOI - PMC - PubMed
    1. Pozhitkov AE, Neme R, Domazet-Loo T, Leroux BG, Soni S, Tautz D, Noble PA. Tracing the dynamics of gene transcripts after organismal death. Open Biol. 2017;7:160267. doi: 10.1098/rsob.160267. - DOI - PMC - PubMed
    1. Dykes IM, Emanueli C. Transcriptional and post-transcriptional gene regulation by long non-coding RNA. Genomics Proteomics Bioinformatics. 2017;15:177–186. doi: 10.1016/j.gpb.2016.12.005. - DOI - PMC - PubMed

Publication types

LinkOut - more resources