

Intraventricular infusion of quinolinic acid impairs spatial learning and memory in young rats: a novel mechanism of lead-induced neurotoxicity
- PMID: 30217162
- PMCID: PMC6137743
- DOI: 10.1186/s12974-018-1306-2
Intraventricular infusion of quinolinic acid impairs spatial learning and memory in young rats: a novel mechanism of lead-induced neurotoxicity
Abstract
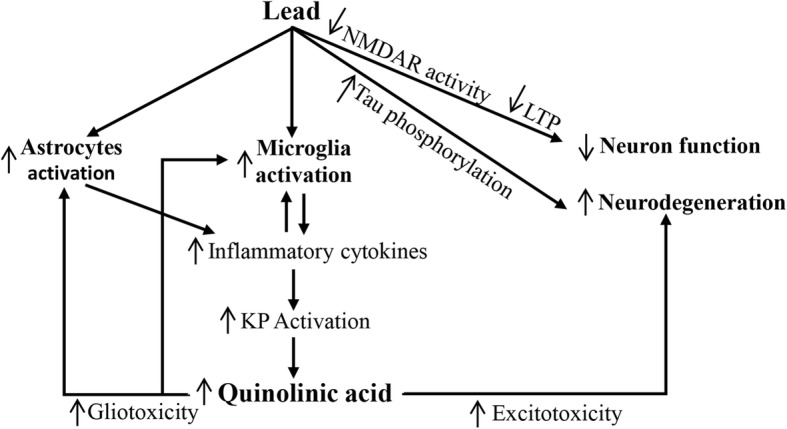
Background: Lead (Pb), a heavy metal, and quinolinic acid (QA), a metabolite of the kynurenine pathway of tryptophan metabolism, are known neurotoxicants. Both Pb and QA impair spatial learning and memory. Pb activates astrocytes and microglia, which in turn induce the synthesis of QA. We hypothesized increased QA production in response to Pb exposure as a novel mechanism of Pb-neurotoxicity.
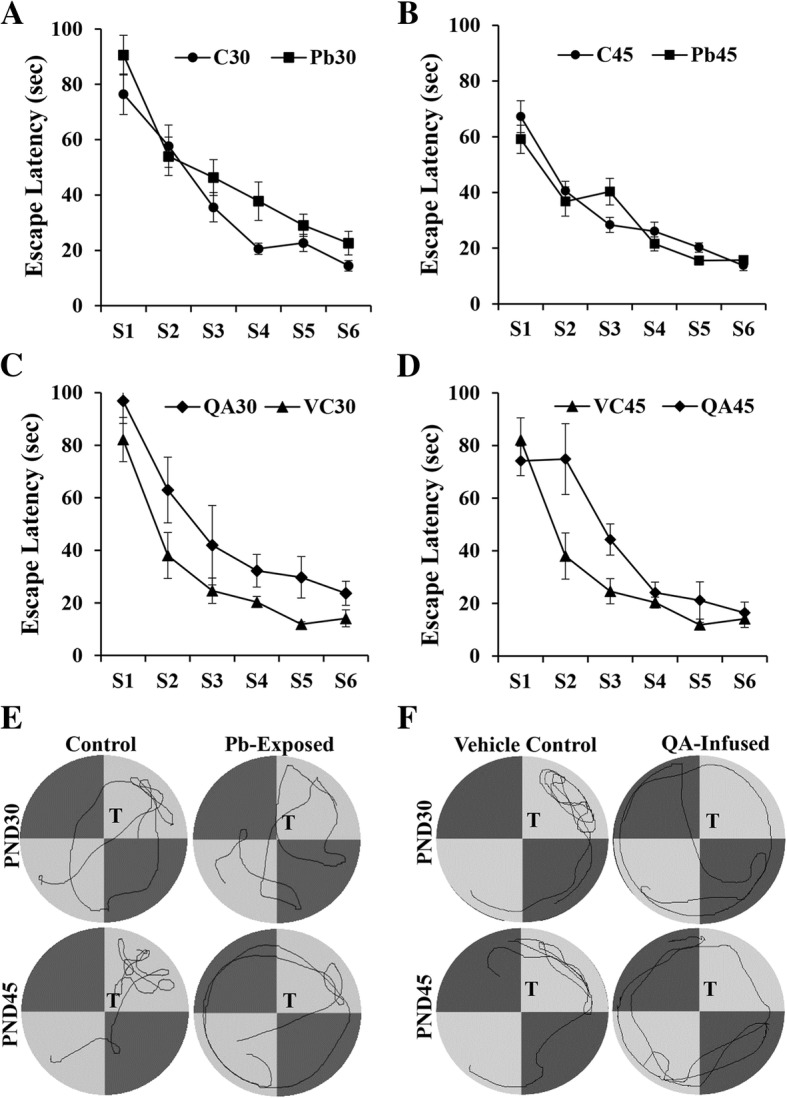
Methods: Two experimental paradigms were used. In experiment one, Wistar rat pups were exposed to Pb via their dams' drinking water from postnatal day 1 to 21. Control group was given regular water. In the second protocol, QA (9 mM) or normal saline (as Vehicle Control) was infused into right lateral ventricle of 21-day old rats for 7 days using osmotic pumps. Learning and memory were assessed by Morris water maze test on postnatal day 30 or 45 in both Pb- and QA-exposed rats. QA levels in the Pb exposed rats were measured in blood by ELISA and in the brain by immunohistochemistry on postnatal days 45 and 60. Expression of various molecules involved in learning and memory was analyzed by Western blot. Means of control and experimental groups were compared with two-way repeated measure ANOVA (learning) and t test (all other variables).
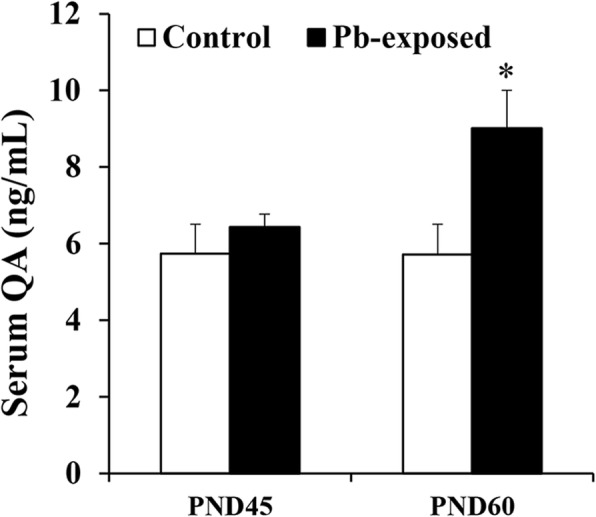
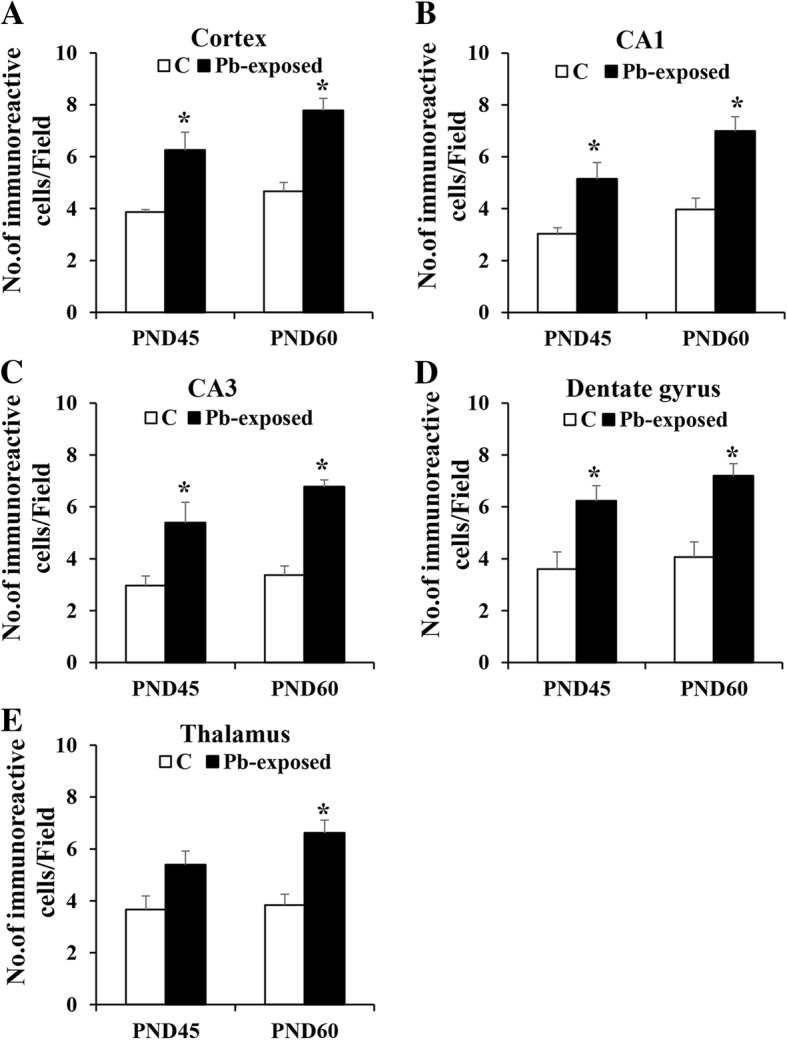
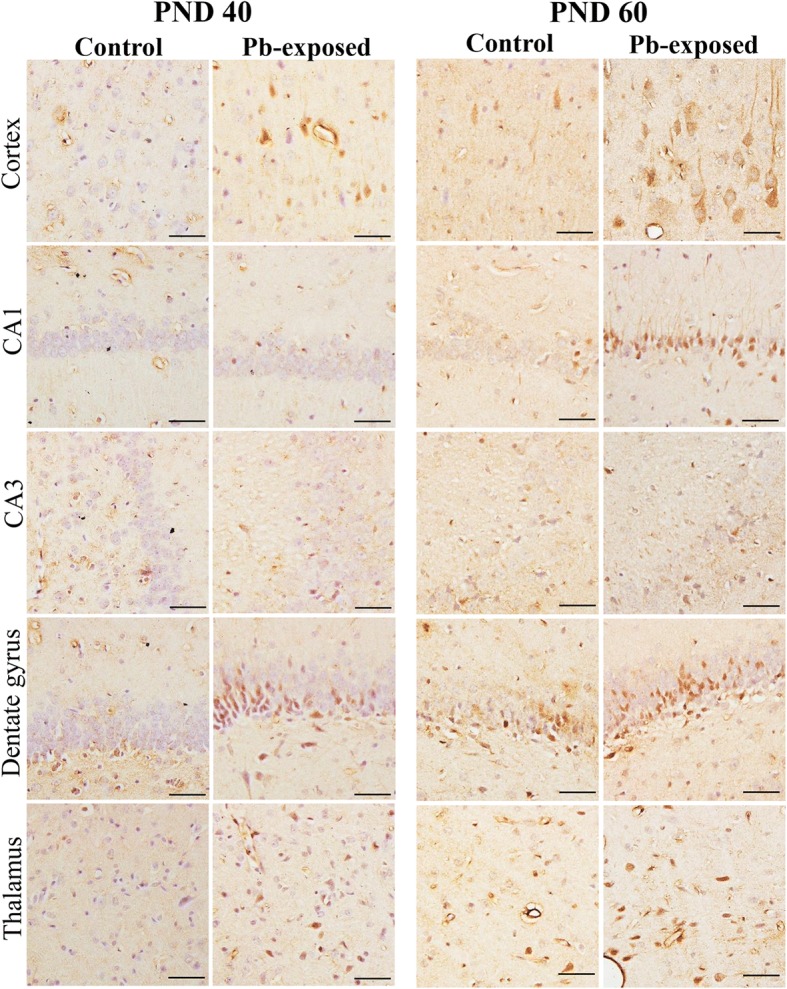
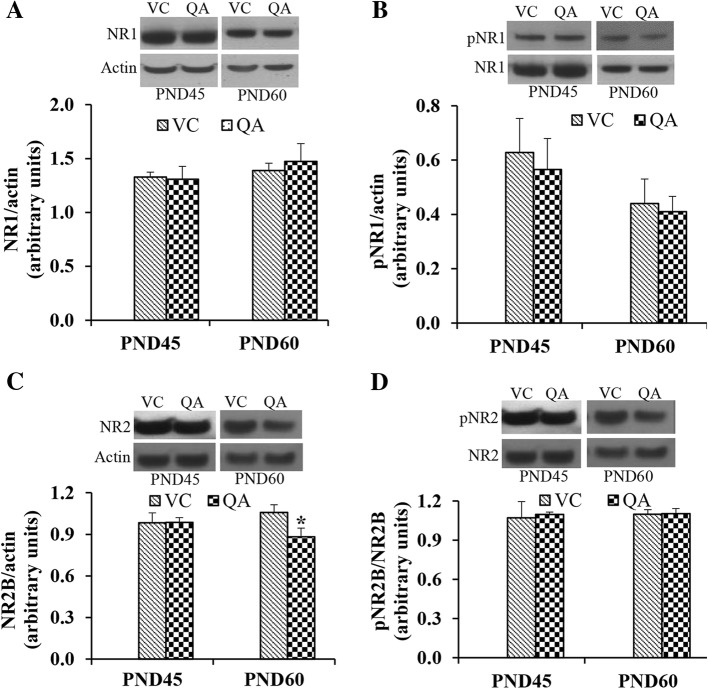
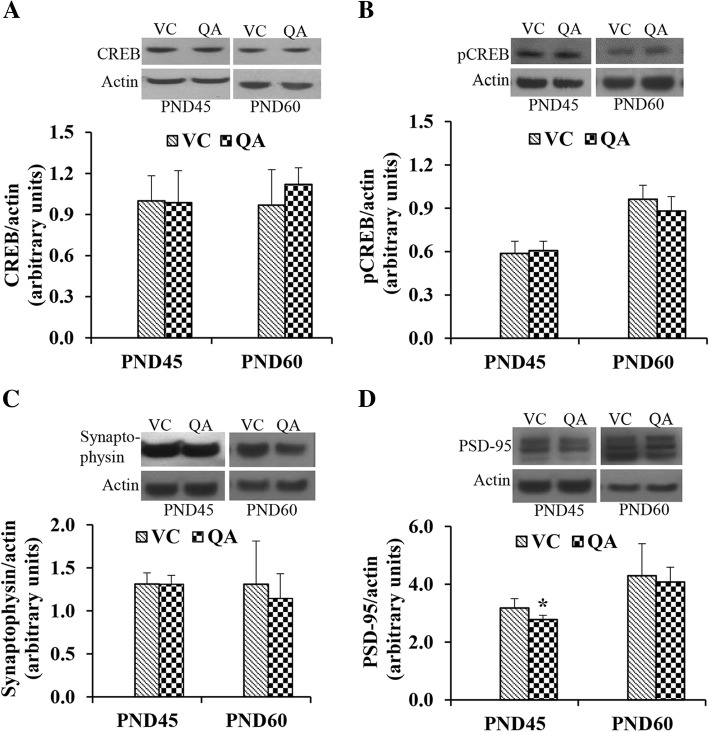
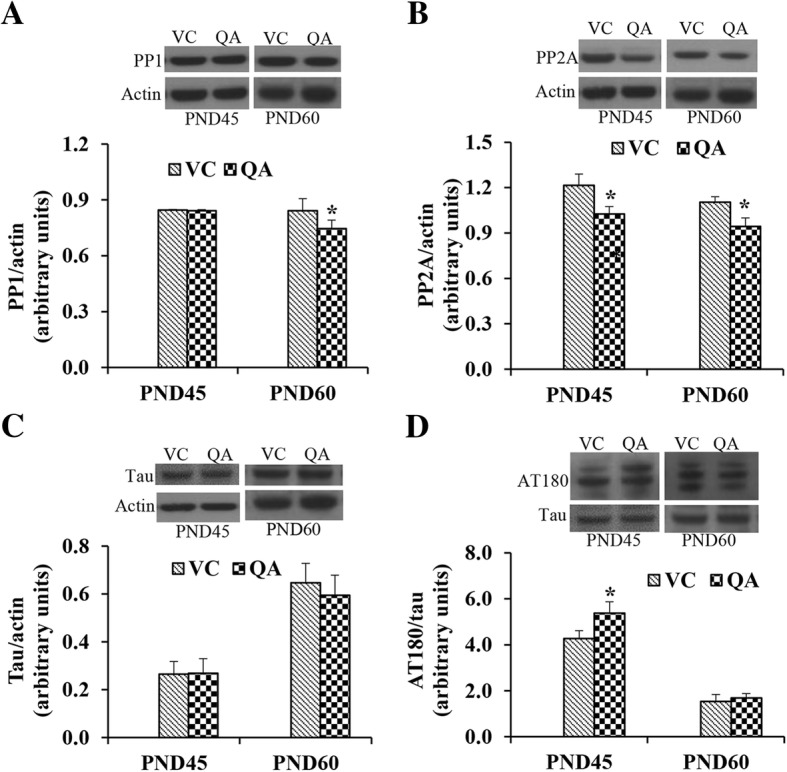
Results: Pb exposure increased QA level in the blood (by ~ 58%) and increased (p < 0.05) the number of QA-immunoreactive cells in the cortex, and CA1, CA3 and dentate gyrus regions of the hippocampus, compared to control rats. In separate experiments, QA infusion impaired learning and short-term memory similar to Pb. PSD-95, PP1, and PP2A were decreased (p < 0.05) in the QA-infused rats, whereas tau phosphorylation was increased, compared to vehicle infused rats.
Conclusion: Putting together the results of the two experimental paradigms, we propose that increased QA production in response to Pb exposure is a novel mechanism of Pb-induced neurotoxicity.
Keywords: Lead; Memory; Neurotoxicity; Quinolinic acid; Spatial learning.
Conflict of interest statement
Ethics approval
This study was approved by the Animal Care and Use Committee of Kuwait University, and the experimental protocol followed the
Consent for publication
Not applicable.
Competing interests
The authors declare that they have no competing interests.
Publisher’s Note
Springer Nature remains neutral with regard to jurisdictional claims in published maps and institutional affiliations.
Figures
Similar articles
-
Over activation of hippocampal serine/threonine protein phosphatases PP1 and PP2A is involved in lead-induced deficits in learning and memory in young rats.Neurotoxicology. 2012 Jun;33(3):370-83. doi: 10.1016/j.neuro.2012.02.014. Epub 2012 Mar 1. Neurotoxicology. 2012. PMID: 22387731
-
Non-steroidal anti-inflammatory agents, tolmetin and sulindac attenuate quinolinic acid (QA)-induced oxidative stress in primary hippocampal neurons and reduce QA-induced spatial reference memory deficits in male Wistar rats.Life Sci. 2007 Mar 20;80(15):1431-8. doi: 10.1016/j.lfs.2007.01.006. Epub 2007 Jan 12. Life Sci. 2007. PMID: 17266991
-
Early postnatal lead exposure induces tau phosphorylation in the brain of young rats.Acta Biol Hung. 2012 Dec;63(4):411-25. doi: 10.1556/ABiol.63.2012.4.1. Acta Biol Hung. 2012. PMID: 23134599
-
Neurotoxicity of lead. Hypothetical molecular mechanisms of synaptic function disorders.Neurol Neurochir Pol. 2012 Nov-Dec;46(6):569-78. doi: 10.5114/ninp.2012.31607. Neurol Neurochir Pol. 2012. PMID: 23319225 Review.
-
Molecular targets of lead in brain neurotoxicity.Neurotox Res. 2003;5(3):221-36. doi: 10.1007/BF03033142. Neurotox Res. 2003. PMID: 12835126 Review.
Cited by
-
Seasonal Changes in Serum Metabolites in Multiple Sclerosis Relapse.Int J Mol Sci. 2023 Feb 10;24(4):3542. doi: 10.3390/ijms24043542. Int J Mol Sci. 2023. PMID: 36834957 Free PMC article.
-
Kynurenine Pathway Metabolites as Biomarkers in Alzheimer's Disease.Dis Markers. 2022 Jan 19;2022:9484217. doi: 10.1155/2022/9484217. eCollection 2022. Dis Markers. 2022. PMID: 35096208 Free PMC article. Review.
-
Avicularin Attenuated Lead-Induced Ferroptosis, Neuroinflammation, and Memory Impairment in Mice.Antioxidants (Basel). 2024 Aug 22;13(8):1024. doi: 10.3390/antiox13081024. Antioxidants (Basel). 2024. PMID: 39199268 Free PMC article.
-
Butyrate ameliorates quinolinic acid-induced cognitive decline in obesity models.J Clin Invest. 2023 Feb 15;133(4):e154612. doi: 10.1172/JCI154612. J Clin Invest. 2023. PMID: 36787221 Free PMC article.
-
Kynurenine Pathway as a New Target of Cognitive Impairment Induced by Lead Toxicity During the Lactation.Sci Rep. 2020 Feb 21;10(1):3184. doi: 10.1038/s41598-020-60159-3. Sci Rep. 2020. PMID: 32081969 Free PMC article.
References
-
- Rahman A. Lead and excitotoxicity. In: Kostrzewa R, editor. Handbook of neurotoxicity. New York: Springer; 2014. pp. 4614–5836.
-
- Graza A, Vega R, Soto E. Cellular mechanisms of lead neurotoxicity. Med Sci Monit. 2006;12:RA57–RA65. - PubMed
MeSH terms
Substances
Grants and funding
LinkOut - more resources
Full Text Sources
Other Literature Sources
Medical
Miscellaneous
