

Mechanisms underlying the J-curve for diastolic blood pressure: Subclinical myocardial injury and immune activation
- PMID: 30217423
- PMCID: PMC6324952
- DOI: 10.1016/j.ijcard.2018.09.028
Mechanisms underlying the J-curve for diastolic blood pressure: Subclinical myocardial injury and immune activation
Abstract
Background: Low diastolic blood pressure (DBP) is associated with increased risk of cardiovascular events. In patients with coronary artery disease (CAD), limitations in coronary blood flow and immune activity are implicated mechanisms, but evidence is lacking. We investigated the association between DBP, biomarkers of myocardial injury, inflammation, immune activation and incident events in patients with CAD.
Methods: We studied 2448 adults (mean age 65 ± 12 years, 68% male, median follow-up 4.5 years) with CAD. DBP was categorized into 10 mm Hg increments. Biomarkers of myocardial injury (high sensitivity cardiac troponin-I [hs-cTnI]) and immune activity/inflammation (soluble urokinase plasminogen activator receptor [suPAR]) were dichotomized at their median values. DBP 70-79 mm Hg was used as the referent group, and individuals were followed prospectively for adverse outcomes.
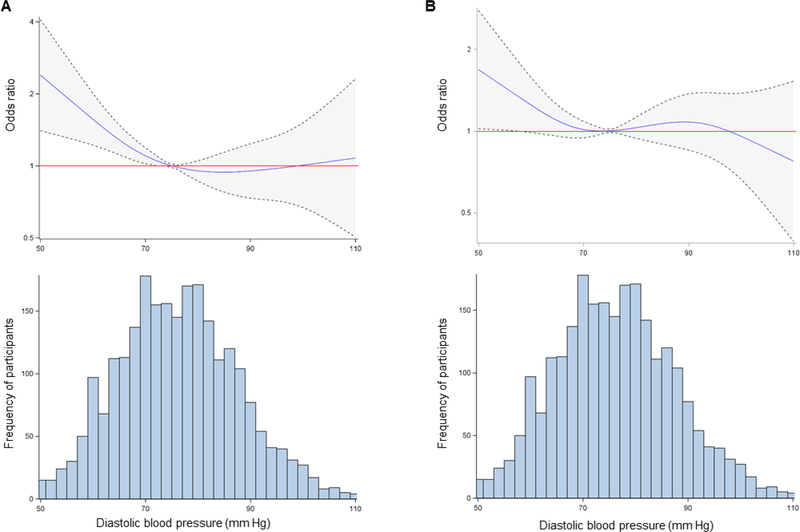
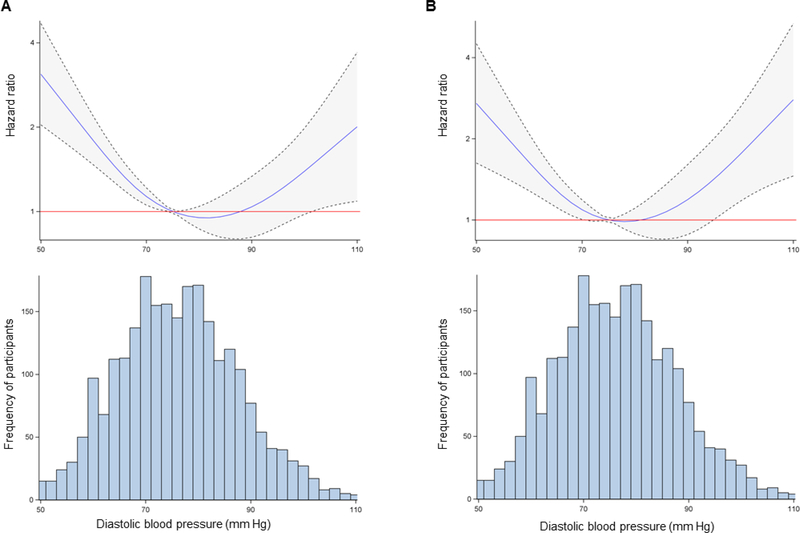
Results: After adjusting for demographic and clinical covariates, individuals with DBP < 60 mm Hg had increased odds of elevated levels of hs-cTnI (OR = 1.68; 95% CI = 1.07, 2.65) and suPAR (OR = 1.71; 95% CI = 1.10, 2.65) compared to the referent group. Additionally, DBP < 60 mm Hg was associated with increased adjusted risk of cardiovascular death or MI (HR = 2.04; 95% CI = 1.32, 3.16) and all-cause mortality (HR = 2.41; 95% CI = 1.69, 3.45).
Conclusion: In patients with CAD, DBP < 60 mm Hg is associated with subclinical myocardial injury, immune/inflammatory dysregulation and incident events. Aggressive BP control may be harmful in these patients, and further investigation is warranted to determine appropriate BP targets in patients with CAD.
Keywords: Blood pressure; Coronary artery disease; High-sensitivity troponin; J-curve; Soluble urokinase plasminogen activator receptor.
Copyright © 2018 Elsevier B.V. All rights reserved.
Conflict of interest statement
Figures
Comment in
-
The "hidden side of the moon" in hypertension: When and why is dangerous low diastolic blood pressure?Int J Cardiol. 2019 Feb 1;276:268-270. doi: 10.1016/j.ijcard.2018.10.041. Epub 2018 Oct 17. Int J Cardiol. 2019. PMID: 30360994 No abstract available.
Similar articles
-
Soluble urokinase plasminogen activator receptor level is an independent predictor of the presence and severity of coronary artery disease and of future adverse events.J Am Heart Assoc. 2014 Oct 23;3(5):e001118. doi: 10.1161/JAHA.114.001118. J Am Heart Assoc. 2014. PMID: 25341887 Free PMC article.
-
SuPAR is associated with death and adverse cardiovascular outcomes in patients with suspected coronary artery disease.Scand Cardiovasc J. 2020 Dec;54(6):339-345. doi: 10.1080/14017431.2020.1762917. Epub 2020 May 13. Scand Cardiovasc J. 2020. PMID: 32400206
-
Cardio-Renal Biomarker Soluble Urokinase-Type Plasminogen Activator Receptor Is Associated With Cardiovascular Death and Myocardial Infarction in Patients With Coronary Artery Disease Independent of Troponin, C-Reactive Protein, and Renal Function.J Am Heart Assoc. 2020 Apr 21;9(8):e015452. doi: 10.1161/JAHA.119.015452. Epub 2020 Apr 17. J Am Heart Assoc. 2020. PMID: 32299288 Free PMC article.
-
Soluble urokinase Plasminogen Activator Receptor (suPAR) mediates the effect of a lower education level on adverse outcomes in patients with coronary artery disease.Eur J Prev Cardiol. 2024 Mar 27;31(5):521-528. doi: 10.1093/eurjpc/zwad311. Eur J Prev Cardiol. 2024. PMID: 37788634 Free PMC article.
-
Soluble Urokinase Plasminogen Activator Receptor (suPAR) as a Biomarker of Systemic Chronic Inflammation.Front Immunol. 2021 Dec 2;12:780641. doi: 10.3389/fimmu.2021.780641. eCollection 2021. Front Immunol. 2021. PMID: 34925360 Free PMC article. Review.
Cited by
-
Non-linear association and benchmark dose of blood pressure on carotid artery intima-media thickening in a general population of southern China.Front Cardiovasc Med. 2024 May 13;11:1325947. doi: 10.3389/fcvm.2024.1325947. eCollection 2024. Front Cardiovasc Med. 2024. PMID: 38803665 Free PMC article.
-
Sex Differences in Achieved Diastolic Blood Pressure and Cardiovascular Outcomes in Elderly Patients With Hypertension.JACC Adv. 2025 Apr;4(4):101675. doi: 10.1016/j.jacadv.2025.101675. Epub 2025 Mar 20. JACC Adv. 2025. PMID: 40117695 Free PMC article.
-
Unsolved Problem: (Isolated) Systolic Hypertension with Diastolic Blood Pressure below the Safety Margin.Med Princ Pract. 2020;29(4):301-309. doi: 10.1159/000508462. Epub 2020 May 7. Med Princ Pract. 2020. PMID: 32380500 Free PMC article. Review.
-
Systolic and Diastolic Blood Pressure, Cardiac Biomarkers, and Cardiovascular Mortality in Adults Without Cardiovascular Disease.JACC Adv. 2025 May;4(5):101678. doi: 10.1016/j.jacadv.2025.101678. Epub 2025 Apr 25. JACC Adv. 2025. PMID: 40286352 Free PMC article.
References
-
- Ford ES. Trends in mortality from all causes and cardiovascular disease among hypertensive and nonhypertensive adults in the United States. Circulation. 2011;123(16):1737–44. - PubMed
-
- James PA, Oparil S, Carter BL, Cushman WC, Dennison-Himmelfarb C, Handler J, et al. 2014 evidence-based guideline for the management of high blood pressure in adults: report from the panel members appointed to the Eighth Joint National Committee (JNC 8). JAMA. 2014;311(5):507–20. - PubMed
-
- Peterson ED, Gaziano JM, Greenland P. Recommendations for treating hypertension: what are the right goals and purposes? JAMA. 2014;311(5):474–6. - PubMed
-
- Bangalore S, Messerli FH, Wun CC, Zuckerman AL, DeMicco D, Kostis JB, et al. J-curve revisited: An analysis of blood pressure and cardiovascular events in the Treating to New Targets (TNT) Trial. Eur Heart J. 2010;31(23):2897–908. - PubMed
-
- Rahman F, McEvoy JW. The J-shaped Curve for Blood Pressure and Cardiovascular Disease Risk: Historical Context and Recent Updates. Curr Atheroscler Rep. 2017;19(8):34. - PubMed
MeSH terms
Substances
Grants and funding
LinkOut - more resources
Full Text Sources
Other Literature Sources
Medical
Research Materials
Miscellaneous
