. 2018 Sep 14;3(27):eaat5861.
doi: 10.1126/sciimmunol.aat5861.

Molecular diversification of regulatory T cells in nonlymphoid tissues

Affiliations

Molecular diversification of regulatory T cells in nonlymphoid tissues

Joanna R DiSpirito et al. Sci Immunol. .

Abstract

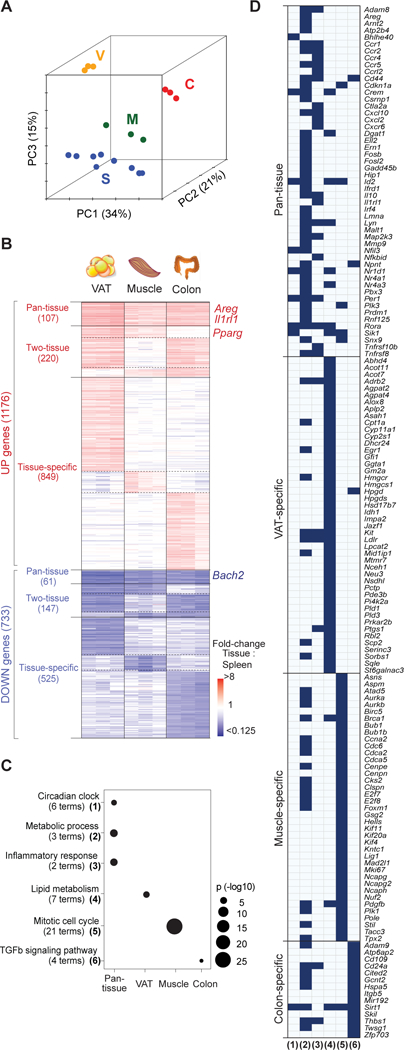
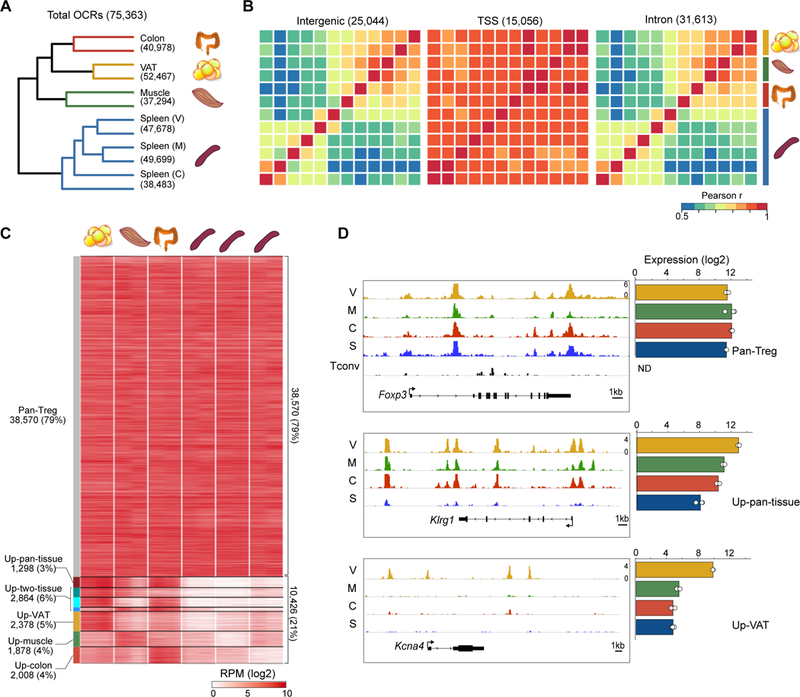
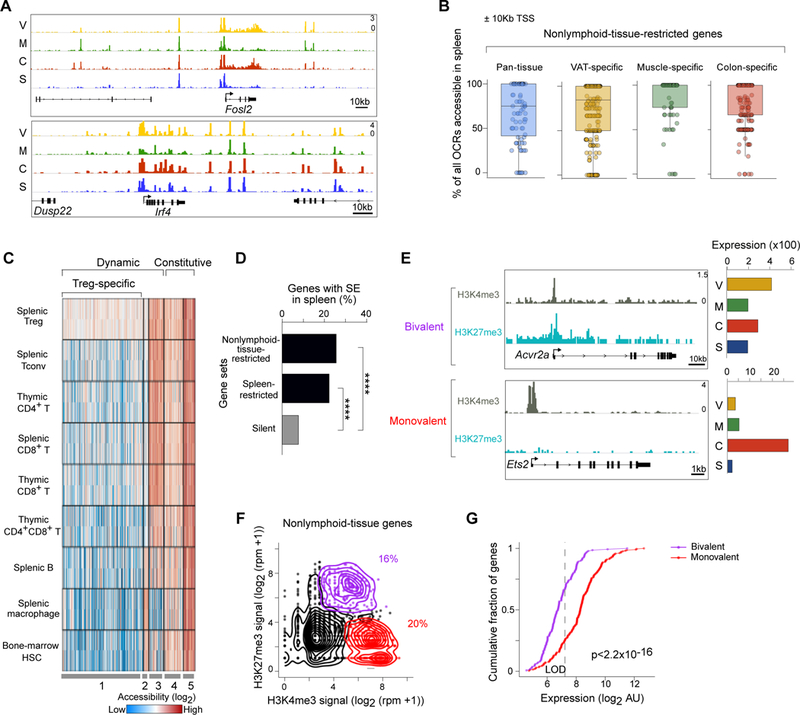
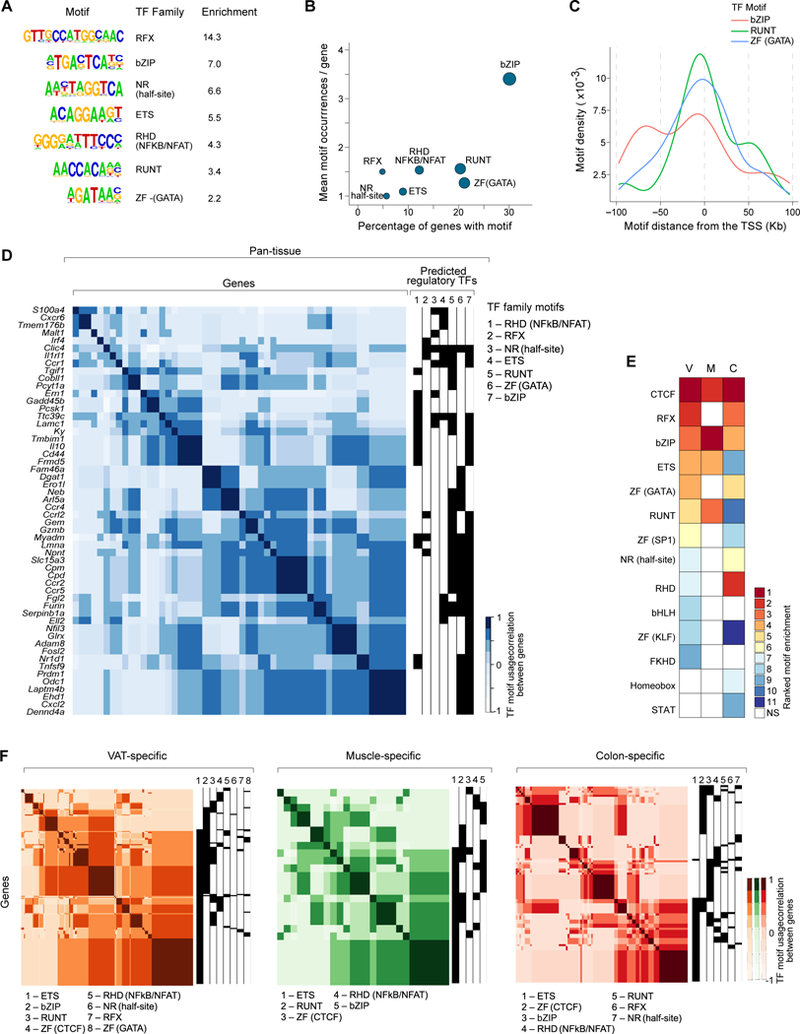
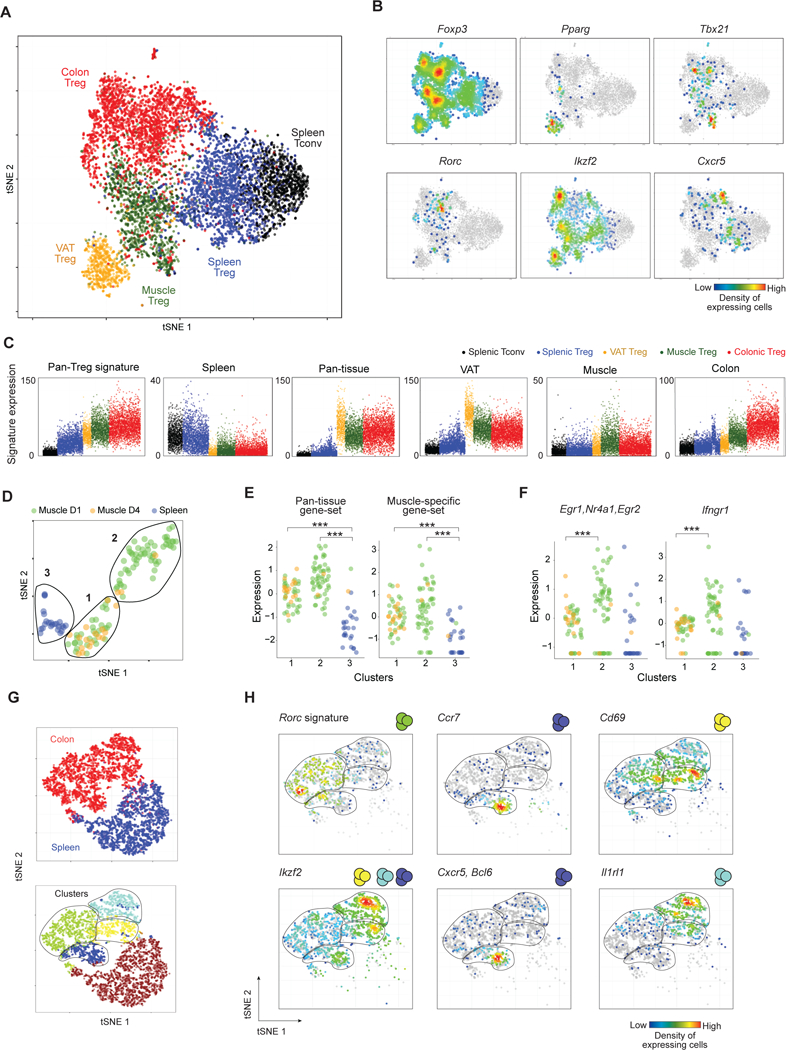
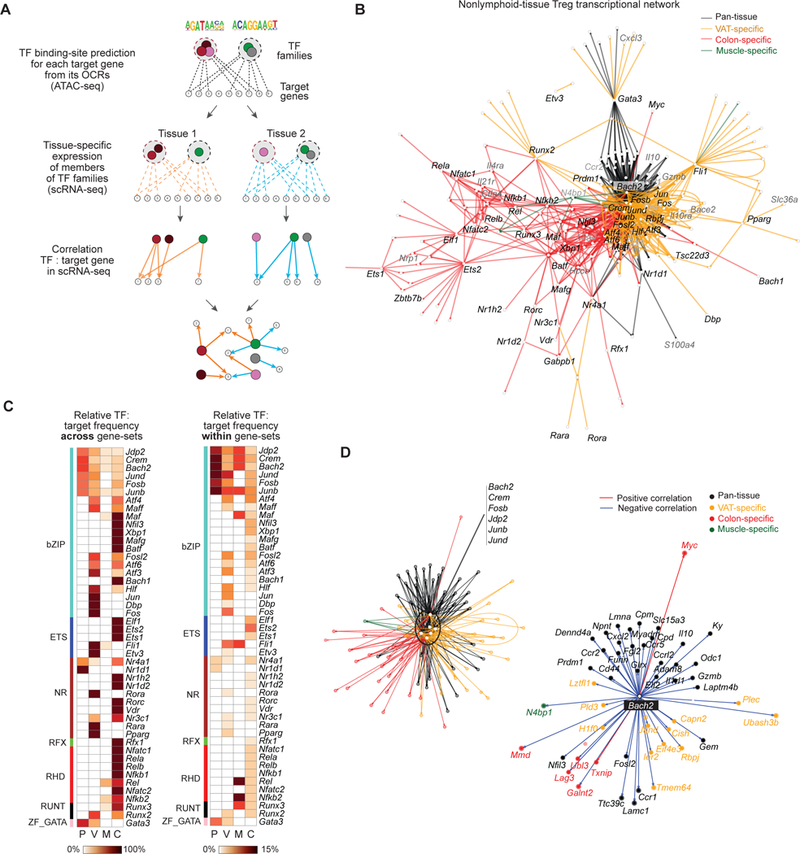
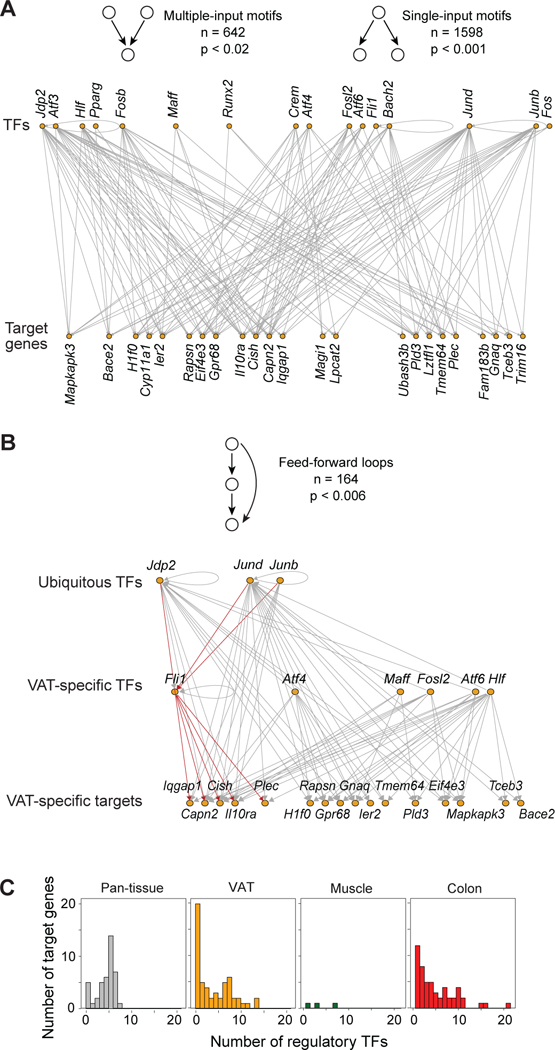
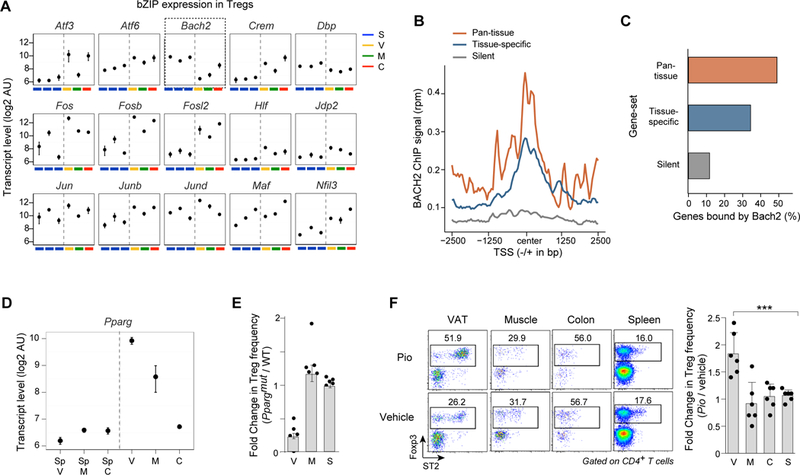
Foxp3+CD4+ regulatory T cells (Tregs) accumulate in certain nonlymphoid tissues, where they control diverse aspects of organ homeostasis. Populations of tissue Tregs, as they have been termed, have transcriptomes distinct from those of their counterparts in lymphoid organs and other nonlymphoid tissues. We examined the diversification of Tregs in visceral adipose tissue, skeletal muscle, and the colon vis-à-vis lymphoid organs from the same individuals. The unique transcriptomes of the various tissue Treg populations resulted from layering of tissue-restricted open chromatin regions over regions already open in the spleen, the latter tagged by super-enhancers and particular histone marks. The binding motifs for a small number of transcription factor (TF) families were repeatedly enriched within the accessible chromatin stretches of Tregs in the three nonlymphoid tissues. However, a bioinformatically and experimentally validated transcriptional network, constructed by integrating chromatin accessibility and single-cell transcriptomic data, predicted reliance on different TF family members in the different tissues. The network analysis also revealed that tissue-restricted and broadly acting TFs were integrated into feed-forward loops to enforce tissue-specific gene expression in nonlymphoid-tissue Tregs. Overall, this study provides a framework for understanding the epigenetic dynamics of T cells operating in nonlymphoid tissues, which should inform strategies for specifically targeting them.


Conflict of interest statement

Competing interests:

the authors declare that they have no competing interests.

Figures

Figure 1.
Figure 1.. Tissue-Treg gene-sets
Microarray data-sets for highly purified tissue-Tregs from epididymal VAT (V) (5), injured skeletal muscle (M) (60) and colonic lamina propria (C) (9), as well as from control lymphoid-organ Treg cells (n = 3 for each tissue). (A) Principal components analysis. PC1, 2, and 3, with their proportions of explained variance. (B) Heatmap of up- and down-regulated genes more than two-fold in tissue- versus lymphoid-Tregs: 1,909 genes ordered by gene-set (with numbers of genes in parentheses). (C) Gene Ontology enrichment in the pan-tissue and tissue-specific gene-sets (61). Numbers of terms enriched under each classification are indicated in parentheses. Fischer Exact Test p-values. (D) Highlighted genes. Genes included under the GO terms enriched in the different tissues. Column numbers correspond to the numbered terms in panel C. See also Table S1.
Figure 2.
Figure 2.. Tissue-associated variation in chromatin accessibility is concentrated at TSS-distal regions
(A) Hierarchical clustering of Tregs by their pair-wise Pearson correlation values for all 75,363 OCRs. (B) Heatmaps of Pearson pair-wise correlation scores for Treg OCRs located within various functional genomic elements. Treg populations were clustered as in A, with the color bar at right demarcating biological replicates. (C) Classification of OCRs. Those OCRs with ATAC signal ≥ 3-fold higher in each non-lymphoid-tissue:splenic Treg pairing were clustered by whether their “up” status was shared across all three, two, or only one non-lymphoid tissue. Pan-Treg OCRs were not differentially accessible in any of the pairings. Heatmap shows the ATAC signal (in reads per million) in different OCR classes. (D) ATAC-seq reads (left) for example genes whose OCR patterns matched their mRNA expression patterns (right) across the Treg subsets. The Tconv track shows minimal accessibility at Foxp3 in non-Treg CD4+ splenic T cells.
Figure 3.
Figure 3.. Priming of tissue-restricted genes by widespread open chromatin, super-enhancers and bivalent TSSs
(A) ATAC-seq reads for two tissue-restricted genes with prominent OCRs in the spleen. (B) Quantification of OCR priming in the spleen for tissue-restricted genes. For each pan-tissue or tissue-specific up-regulated gene (dots), all OCRs were identified within 10Kb of its TSS, and the fraction open in the spleen are plotted. See also Figure S2. (C) Heatmap shows accessibility of the top quartile of primed OCRs (~2,100) across T cell, myeloid and progenitor cell types. Data are from the ImmGen ATAC-seq resource. (D) The association of super-enhancers in splenic Tregs with genes whose expression is either spleen- or tissue-restricted, compared with the background association of SEs with silent genes. Binomal test **** p<0.0001. See also Figure S3. (E) Examples of tissue-restricted genes whose TSSs are either mono- or bivalently marked by histone modifications in splenic Tregs. Note the minimal expression of these genes in splenic Tregs (according to microarray data). (F) Histone modifications at the TSSs of tissue-restricted genes in splenic Tregs (n=1,135 genes). For each gene, the levels of H3K4me3 and H3K27me3 within 1Kb of its TSS are shown, derived from re-analysis of published ChIP-seq data (30). Colors represent TSSs passing cutoffs for monovalency (H3K4me3 alone, red), bivalency (H3K4me3 + H3K27me3, purple) or TSSs below both cutoffs (black). (G) Expression differences in splenic Tregs between mono- and bi-valently marked tissue-restricted genes. p-value is from a two-sided K-S test. LOD, level of detection.
Figure 4.
Figure 4.. A limited number of TF-family motifs are associated with tissue-restricted gene signatures in Tregs
(A) TF family motifs enriched in OCRs within 100kb of the TSS of genes up-regulated in Tregs from all three non-lymphoid tissues. Enrichment represents the fold-change in frequency of the motif in these OCRs vs. control regions and only significantly enriched motifs (p < 0.01) are shown. (B) The percentage of pan-tissue genes containing ≥ 1 instance of each motif within 100kb of its TSS (x-axis) vs. the average number of motif occurrences per gene (y-axis). (C) The positions of bZIP, RUNT, and GATA motifs are shown for the set of pan-tissue OCRs found within 100Kb of pan-tissue-genes. (D) Clustering of pan-tissue genes based on their ATAC-predicted regulatory TF families. TF motifs were linked to each gene based on their presence in an OCR assigned to that gene. Each gene then received a 0 or 1 score for each of the seven TF families shown, and genes were then clustered according to their pair-wise correlation scores. (E) TF-family motifs significantly enriched in OCRs within 100kb of the TSSs of each set of tissue-specific up-regulated genes. Enrichment values within each set are ranked to allow comparison across subsets. (F) As in panel D, except tissue-specific genes were clustered.
Figure 5.
Figure 5.. scRNA-seq analysis of tissue-Tregs
(A) tSNE plot of the tissue and splenic Tregs single-cell datasets (n = 7455 cells). (B) Same tSNE plots as in A, highlighting cells expressing characteristic Treg TFs or sub-population markers: Pparg (VAT Tregs), Rorc (colonic pTregs), Ikzf2 (tTregs), Tbx21 (Tregs in a Th1 milieu), Cxcr5 (follicular Tregs). Coloring signifies the density of expressing cells. (C) Single-cell expression of the indicated gene-sets, as per Fig. 1 (Z-score). Pan-Treg signature from Hill et all (40). The spleen signature is the pan-tissue down signature (per Fig. 1). (D) tSNE plot of the CelSeq data-sets of spleen and muscle Tregs 1 (D1) and 4 days (D4) after injury. Lines delimit cell clusters 1–3 identified by k-means. (E) Single-cell expression of the pan-tissue and muscle-specific gene-sets in splenic (blue) and muscle Tregs isolated at day 1 (green) and 4 (yellow) post-injury (Z-score). p<0.001, by two-tailed t-test. (F) As in panel E, except expression of early TCR-induced genes (Nr4a1, Egr1, Egr2) (left) or the Ifgnr1 gene (right) ***, p<0.001. Colors relate to the indicated gene-sets. See also Figure S4. (G) tSNE plot of colonic and splenic Treg single-cell transcriptomes. Top: colonic (red) and splenic (blue) Tregs. Bottom: Colors and lines delimit cell clusters identified by k-means. (H) Same tSNE plot as in G showing the density of cells expressing specific markers separating the different colonic clusters: Ikzf2, Ccr7, Cxcr5/Bcl6, Cd69, Il1rl1 and the Rorc signature.
Figure 6.
Figure 6.. Architecture of the tissue-Treg transcriptional network
(A) A schematic of network construction, integrating ATAC-seq and scRNA-seq data. First, TF families are linked to target genes when their binding site is enriched in the associated OCRs (see ATAC-seq correlation heatmaps in Fig. 4D, F). The network is then refined i) by identifying TF members within each family that are expressed in each tissue (using scRNA-seq) and ii) by keeping connections with significant correlations between the TFs and target genes in the scRNA-seq data. (B) Directed graph of the tissue-Treg transcriptional network. Each node represents a gene. A directed edge connects a TF and its target-gene if the target has the TF family’s motif in an associated OCR (ATAC-seq) and if their expression is correlated in the scRNA-seq data. Node and edge colors reflect the gene-set to which the target-gene belongs. Gene names are those of key TFs (black) and target genes (grey) in the network. (C) TF: target gene correlations. Left: The percentage of target genes that are linked to each TF (rows) falling in the four gene sets (columns: Pan-tissue, VAT, Muscle and Colon). Row values sum to one. Right: The percentage of genes in each set (columns) linked to each TF (rows). Columns sum to one. (D) Network blow-ups. Left: Central hub in the tissue-Treg network. Subgraph of B with the ubiquitous TFs and their connection to pan-tissue and tissue-specific target-genes. Edge color as in B. Right: Subgraph of D with Bach2 and its connections to pan-tissue and tissue-specific target-genes. Node colors relate to the gene-sets and edge colors to positive (red) or negative (blue) correlations with Bach2. See also Figures S5.
Figure 7.
Figure 7.. VAT-Treg transcriptional network connectivity
(A) Single- and multiple-input motif instances in the VAT-Treg subnetwork from Fig. 6B. Top and bottom rows represent TFs and gene-targets, respectively. Schematics of the motif types on top, with the number of instances and p-values for enrichment (null distribution based on 1000 degree-preserving randomizations, see Supplementary Methods). (B) Feed-forward loop instances that include the ubiquitous TFs in the VAT-Treg subnetwork from Fig. 6B. Top, middle and bottom rows represent the ubiquitous TFs, VAT-specific TFs, and target-genes, respectively. Red lines are particular examples discussed in the text. Schematics of the motif-types on top, with the number of instances and p-values for enrichment. (C) Distribution of the number of connected TFs in each gene-set.
Figure 8.
Figure 8.. Validation of tissue-Treg TF networks
(A) Expression of bZIP family TFs across splenic and non-lymphoid-tissue-Treg subsets. Arbitrary Units represent transcript levels from microarray data. (B) Average genomic occupancy of BACH2 in spleen-derived induced Treg cells at TSSs of genes up-regulated in all three tissue-Treg subsets (pan-tissue), only one of them (tissue-specific VAT, muscle and colon, combined into a single list for this analysis), or a control set of genes not expressed in Tregs. Raw ChIP-seq data from GEO GSE45975, were re-analyzed for this study (see Methods). (C) Percentage of genes in each set that have a BACH2 peak within 10Kb of their TSS. (D) Expression of Pparg across Treg subsets, as in panel A. (E) Effects of Treg-specific PPARγ-deletion on Treg accumulation in skeletal muscle on day four following cardiotoxin injury (the peak of Treg accumulation). Data are represented as the fold-change in the Treg frequency of each PPARgmut mouse vs. the average frequency in wild-type mice in muscle (M) or spleen (S), within each experiment. n = 3 – 5 mice per group from three experiments. (F) Left: Frequencies of Foxp3+ Tregs in various tissues following a 10-day treatment with 10mg/kg pioglitazone. Dot plots are representative of n = 2–3 mice per group from two experiments. Right: Effects of pioglitazone on each Treg subset measured as fold-change in the Treg frequency of each pioglitazone-treated mouse vs. the average frequency from vehicle-treated mice within each experiment. n = 2–3 mice per group from two experiments. V = VAT, M = muscle, C = colon, S = spleen.

Similar articles

Cited by

References

    1. Plitas G, Rudensky AY, Regulatory T Cells: Differentiation and Function. Cancer Immunol Res 4, 721–725 (2016). - PMC - PubMed
    1. Panduro M, Benoist C, Mathis D, Tissue Tregs. Annu. Rev Immunol 34, 609–633 (2016). - PMC - PubMed
    1. Feuerer M et al., Lean, but not obese, fat is enriched for a unique population of regulatory T cells that affect metabolic parameters. Nat Med 15, 930–939 (2009). - PMC - PubMed
    1. Kolodin D et al., Antigen- and cytokine-driven accumulation of regulatory T cells in visceral adipose tissue of lean mice. Cell Metab 21, 543–557 (2015). - PMC - PubMed
    1. Cipolletta D et al., PPAR-γ is a major driver of the accumulation and phenotype of adipose tissue Treg cells. Nature. 486, 549–553 (2012). - PMC - PubMed

Publication types

Substances