. 2018 Nov 2;293(44):17218-17228.
doi: 10.1074/jbc.RA118.003036. Epub 2018 Sep 14.

Fibroblast growth factor receptor 5 (FGFR5) is a co-receptor for FGFR1 that is up-regulated in beta-cells by cytokine-induced inflammation

Affiliations

Fibroblast growth factor receptor 5 (FGFR5) is a co-receptor for FGFR1 that is up-regulated in beta-cells by cytokine-induced inflammation

Romario Regeenes et al. J Biol Chem. .

Abstract

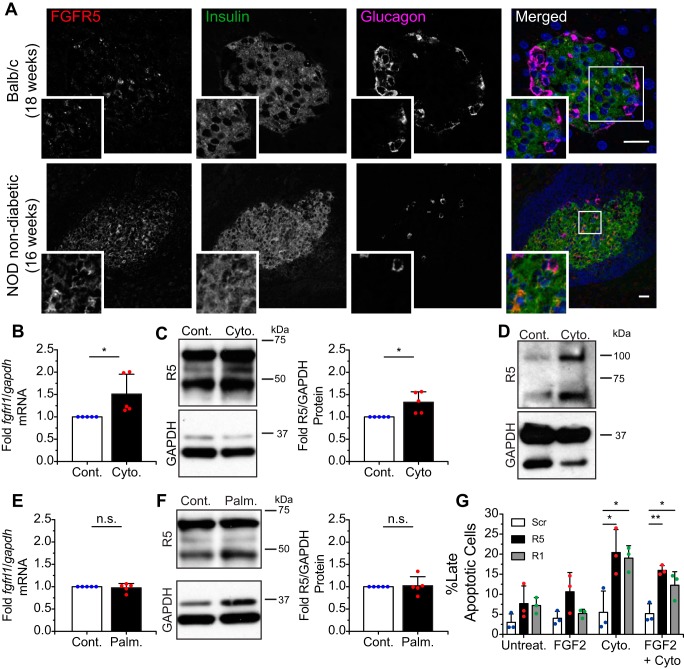
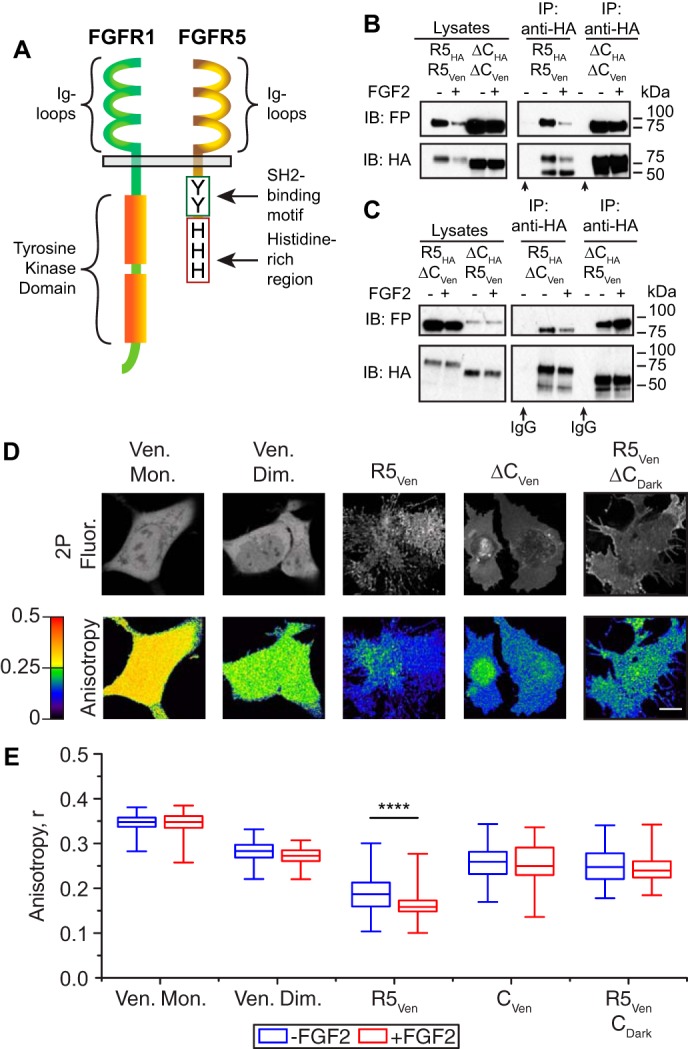
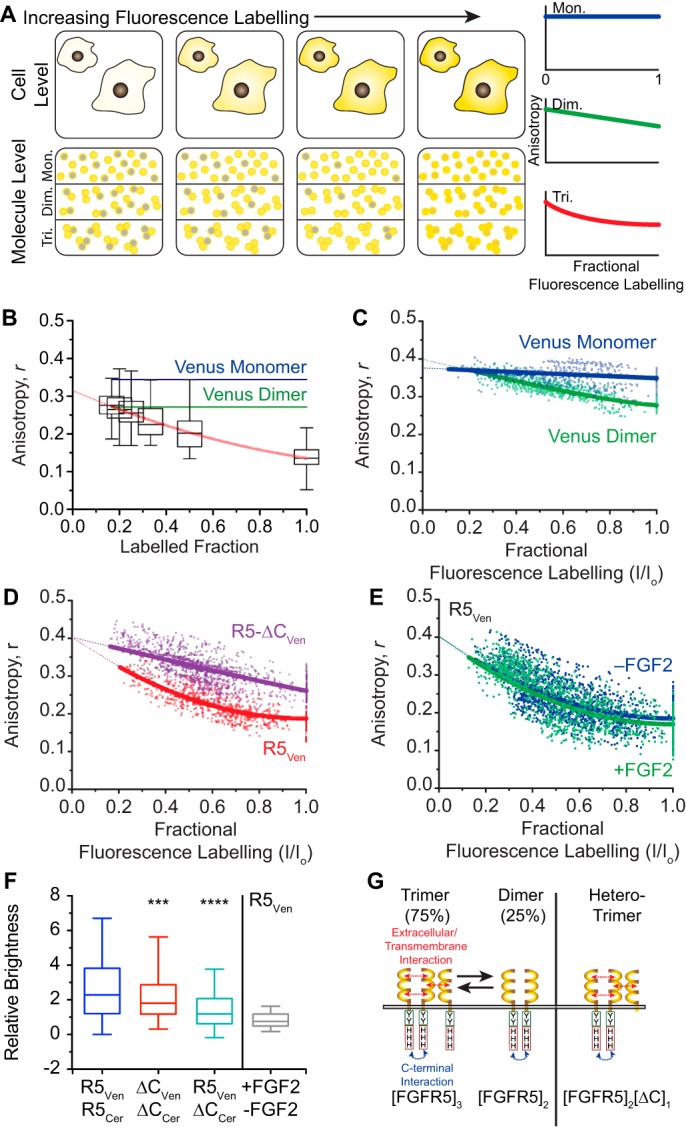
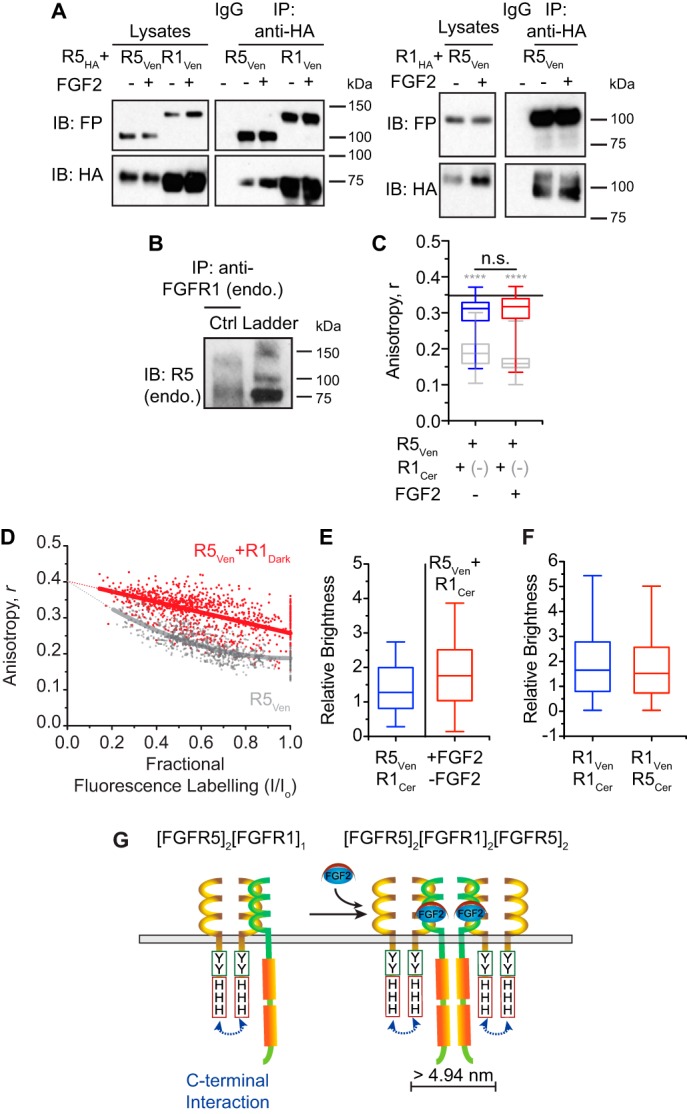
Fibroblast growth factor receptor-1 (FGFR1) activity at the plasma membrane is tightly controlled by the availability of co-receptors and competing receptor isoforms. We have previously shown that FGFR1 activity in pancreatic beta-cells modulates a wide range of processes, including lipid metabolism, insulin processing, and cell survival. More recently, we have revealed that co-expression of FGFR5, a receptor isoform that lacks a tyrosine-kinase domain, influences FGFR1 responses. We therefore hypothesized that FGFR5 is a co-receptor to FGFR1 that modulates responses to ligands by forming a receptor heterocomplex with FGFR1. We first show here increased FGFR5 expression in the pancreatic islets of nonobese diabetic (NOD) mice and also in mouse and human islets treated with proinflammatory cytokines. Using siRNA knockdown, we further report that FGFR5 and FGFR1 expression improves beta-cell survival. Co-immunoprecipitation and quantitative live-cell imaging to measure the molecular interaction between FGFR5 and FGFR1 revealed that FGFR5 forms a mixture of ligand-independent homodimers (∼25%) and homotrimers (∼75%) at the plasma membrane. Interestingly, co-expressed FGFR5 and FGFR1 formed heterocomplexes with a 2:1 ratio and subsequently responded to FGF2 by forming FGFR5/FGFR1 signaling complexes with a 4:2 ratio. Taken together, our findings identify FGFR5 as a co-receptor that is up-regulated by inflammation and promotes FGFR1-induced survival, insights that reveal a potential target for intervention during beta-cell pathogenesis.

Keywords: beta cell (B-cell); cytokine; diabetes; fibroblast growth factor (FGF); fibroblast growth factor receptor (FGFR); fluorescence resonance energy transfer (FRET); inflammation; islet; metabolism; pancreas.


Conflict of interest statement

The authors declare that they have no conflicts of interest with the contents of this article

Figures

Figure 1.
Figure 1.
Endogenous FGFR5 expression is elevated in beta-cells exposed to pro-inflammatory cytokines but not glucolipotoxicity. A, immunodetection of endogenous FGFR5 (far left; red in overlay) is elevated in the surviving islets of age-matched NOD female mice not displaying overt diabetes compared with BALB/c controls. Insulin (second from left; green in overlay), glucagon (second from right; magenta in overlay), and DAPI (right; blue in overlay) identify beta-cells, alpha-cells, and cell nuclei, respectively. Scale bars, 25 μm. B, βTC3 cells chronically stimulated by pro-inflammatory cytokines (TNFα, IFN-γ, and IL-1β) for 24 h (Cyto.) expressed higher levels of fgfrl1 compared with the gapdh reference gene when compared with PBS-treated cells (Cont.). n = 4 independent qPCR experiments. C, Western immunoblots of βTC3 whole-cell lysate revealed greater levels of FGFR5 protein relative to GAPDH in cells challenged with pro-inflammatory cytokines. n = 5 independent experiments. D, human donor islets also exhibited an increase in FGFR5 protein levels when challenged with the same pro-inflammatory conditions (25 islets each). E, expression levels of fgfrl1 mRNA remained unchanged when βTC3 cells were cultured in medium supplemented with 0.4 mm palmitate (Palm.). n = 4 independent experiments. F, FGFR5 protein expression was also not altered by palmitate supplementation. n = 5 independent experiments. *, p < 0.05; n.s., no significance by unpaired two-sample t test. G, βTC3 cells treated with scrambled siRNA control (Scr), siRNA targeting FGFR5 (R5), or FGFR1 (R1) were co-stained with Annexin V–APC and 7-AAD for assessment of cell viability by flow cytometry. Quantification of the late apoptotic fraction (Annexin V+ve/7-AAD+ve) revealed that loss of FGFR5 expression increased beta-cell apoptosis during cytokine-induced stress. * and **, p < 0.05 and p < 0.01, respectively, based on one-way ANOVA.
Figure 2.
Figure 2.
FGFR5 exists as preformed higher aggregates at the plasma membrane. A, FGFR5 exhibits extracellular ligand-binding Ig loops similar in structure to canonical FGFRs and a unique truncated noncatalytic C terminus. HA-tagged full-length FGFR5 (R5HA) or C terminus–deficient FGFR5 (ΔCHA) were co-expressed in AD293 cells at a 1:1 molar ratio with Venus-tagged constructs (R5Ven or ΔCVen) in either a homogeneous (B) or heterogeneous (C) pattern. Cultures were stimulated in the absence (−) or presence (+) of FGF2 (10 ng/ml; supplemented with heparin sulfate; 10 min). FGFR5 immunoprecipitated (IP) with variant isoforms of itself, as detected by Western immunoblotting (IB). The ability of FGFR5-ΔC to pull down FGFR5 indicates that the unique intracellular domain is not required for this molecular association. D, a panel of representative images showing 2-photon fluorescence intensity (2P Fluor.) and anisotropy image maps of AD293 cells expressing Venus monomer (Ven. Mon.), tandem Venus dimer (Ven. Dim.), R5Ven, ΔCVen, and R5Ven co-expressed with untagged FGFR5-ΔC (ΔCDark). Changes in anisotropy between the Venus monomer and dimer controls illustrate the independence of this measurement to fluorescence intensity. Scale bar, 10 μm. E, the average anisotropy of each sample in the absence (−) and presence (+) of FGF2 reveals that R5Ven forms a higher-order (n > 2) oligomer that further aggregates with FGF2 stimulation. Truncation of the intracellular domain (ΔCVen) presents a receptor with an average anisotropy value closer to the Venus dimer, independent of FGF2 stimulation. Values from n = 61–165 cells analyzed and pooled from four independent experiments performed on different days are represented as box–whisker plots. Boxes delineate the 25th and 75th percentiles, and center lines indicate the medians. Whiskers extend 1.5 times the interquartile range from the 25th and 75th percentiles. ****. p < 0.0001 based on one-way ANOVA.
Figure 3.
Figure 3.
Anisotropy enhancement curves suggest that FGFR5 forms trimers. A, progressively increasing fluorescence labeling of randomly distributed populations of monomers, dimers, and trimers exhibit differences in the apparent aggregate state. These changes are reflected by the relationship between anisotropy and fluorescence labeling, where monomers (top third of bottom panel; blue curve) appear zero-order, dimers (middle third of bottom panel; green curve) appear first-order (or linear), and trimers (bottom third of bottom panel; red curve) appear second-order. B, the anisotropy of R5Ven increased when co-expressed with increasing amounts of R5Dark (i.e. untagged R5), reflecting a decrease in the fluorescence-labeled fraction. The line of best fit is shown in red. Values from n = 87–162 cells analyzed from three independent experiments performed on different days are represented as box–whisker plots. C, enhancement curves constructed with anisotropy measurements from time series images of AD293 cells expressing Venus monomer and Venus dimer controls that were progressively photobleached after each image acquisition. The slope of the line of best fit for Venus monomer was relatively flat, whereas Venus dimer exhibited a first-order relationship. D, anisotropy enhancement curves for R5Ven exhibited a curve of best fit that approximated a trimeric oligomerization state (2.73 ± 0.05 monomers/aggregate), whereas R5-ΔCVen is best approximated as a dimeric state (2.05 ± 0.05 monomers/aggregate). E, the R5Ven enhancement curve profile is similar in the absence (blue) or presence (green) of FGF2. Enhancement curve data were constructed by analyzing between 18 and 95 cells through 11 frames within a photobleach sequence from three independent experiments performed on different days. F, relative brightness values for Venus-tagged constructs expressed in the absence and presence of Cerulean-tagged constructs suggest that R5Ven is a trimer (blue) and ΔCVen is a dimer (red) and that co-expression of ΔCCer forces R5Ven to undergo a trimer-to-dimer (3 to 2) transition (green). The relative brightness of R5Ven expressed alone in the presence versus absence of FGF2 (gray) revealed no change in the aggregation state. Values from n = 53–163 cells/experiment are represented as box–whisker plots. Boxes delineate the 25th and 75th percentiles, and center lines indicate the medians. Whiskers extend 1.5 times the interquartile range from the 25th and 75th percentiles. *** and ****, p < 0.001 and p < 0.0001, respectively, based on one-way ANOVA. G, model depicting a mixture of FGFR5 homotrimers and homodimers on the plasma membrane. The homotrimer is formed by both C-terminal and extracellular/transmembrane interaction, whereas the stable homodimer is due to C-terminal interaction.
Figure 4.
Figure 4.
FGFR5 forms a heterocomplex with FGFR1 that responds to FGF2 ligand stimulation. A, left blots, HA-tagged R5 (R5HA) was co-expressed with Venus-tagged R5 (R5Ven) or R1 (R1Ven). Right blots, HA-tagged R1 (R1HA) was co-expressed with R5Ven. Cells were stimulated in the absence (−) or presence (+) of FGF2 (10 ng/ml; supplemented with heparin sulfate; 10 min). Co-immunoprecipitation (IP) with anti-HA antibodies and Western immunoblotting (IB) for the fluorescent protein (FP) reveal an association between FGFR5 and FGFR1. No changes were observed in the presence of ligand stimulation by this method. B, immunoprecipitation with anti-FGFR1 antibody and Western immunoblotting for FGFR5 reveal an association between endogenous FGFR5 and FGFR1. C, anisotropy values of AD293 cells expressing R5Ven and R1Dark at a 1:2 ratio in the absence (blue) and presence (red) of FGF2. The anisotropy of Venus monomer is indicated as a black line, and R5Ven is indicated as gray box–whisker plots as previously presented in Fig. 2E. Values from n = 59–67 cells analyzed from three independent experiments performed on different days are represented as box–whisker plots. **** (gray), p < 0.0001 between R5Ven (gray) and R1Cer in the absence (blue) or presence (red) of FGF2; n.s., indicates no significant difference between the absence (blue) and presence (red) of R5Ven + R1Cer by one-way ANOVA. D, anisotropy enhancement curve produced by progressive photobleaching of AD293 cells expressing R5Ven + R1Dark (red) overlaid on an enhancement curve from cells expressing R5Ven (gray; previously represented in Fig. 3D) reveals a trimer-to-dimer transition upon co-expression of R1Dark. E, the relative brightness comparing R5Ven in the absence and presence of Cerulean-tagged FGFR1 (R1Cer) also suggests a trimer-to-dimer (3 to 2) transition. The relative brightness of cells co-expressing R5Ven with R1Cer in the presence versus absence of FGF2 suggests a doubling of the aggregate. Values from n = 167–213 cells analyzed from five independent experiments performed on different days are represented as box–whisker plots. F, relative brightness comparing R1Ven in the absence versus presence of either R1Cer or R5Cer indicates that FGFR5 co-expression forces a dimer-to-monomer transition (2 to 1) of FGFR1 aggregates. Values from n = 78–92 cells analyzed from four independent experiments performed on different days are represented as box–whisker plots. Boxes delineate the 25th and 75th percentiles, and center lines indicate the medians. Whiskers extend 1.5 times the interquartile range from the 25th and 75th percentiles. G, model depicting FGFR5 and FGFR1 interaction at the plasma membrane. FGFR5 and FGFR1 form a 2:1 heterocomplex ((FGFR5)2/(FGFR1)1) that further aggregates to a 4:2 heterocomplex upon stimulation with FGF2 ((FGFR5)4/(FGFR1)2). The inability to detect FGF2-induced aggregation by FGFR5 homoFRET but observation by N&B analysis of both FGFR5 and FGFR1 suggests that FGFR5 homodimers are on the opposite side of the complex ((FGFR5)2/(FGFR1)2/(FGFR5)2), separated by >4.95 nm.

Similar articles

Cited by

References

    1. Suh J. M., Jonker J. W., Ahmadian M., Goetz R., Lackey D., Osborn O., Huang Z., Liu W., Yoshihara E., and van Dijk T. H., Havinga R., Fan W., Yin Y. Q., Yu R. T., Liddle C., et al. (2014) Endocrinization of FGF1 produces a neomorphic and potent insulin sensitizer. Nature 513, 436–439 10.1038/nature13540 - DOI - PMC - PubMed
    1. Wang H., Iezzi M., Theander S., Antinozzi P. A., Gauthier B. R., Halban P. A., and Wollheim C. B. (2005) Suppression of Pdx-1 perturbs proinsulin processing, insulin secretion and GLP-1 signalling in INS-1 cells. Diabetologia 48, 720–731 10.1007/s00125-005-1692-8 - DOI - PubMed
    1. Hart A. W., Baeza N., Apelqvist A., and Edlund H. (2000) Attenuation of FGF signalling in mouse β-cells leads to diabetes. Nature 408, 864–868 10.1038/35048589 - DOI - PubMed
    1. Sun M. Y., Yoo E., Green B. J., Altamentova S. M., Kilkenny D. M., and Rocheleau J. V. (2012) Autofluorescence imaging of living pancreatic islets reveals fibroblast growth factor-21 (FGF21)-induced metabolism. Biophys. J. 103, 2379–2388 10.1016/j.bpj.2012.10.028 - DOI - PMC - PubMed
    1. Silva P. N., Altamentova S. M., Kilkenny D. M., and Rocheleau J. V. (2013) Fibroblast growth factor receptor like-1 (FGFRL1) interacts with SHP-1 phosphatase at insulin secretory granules and induces beta-cell ERK1/2 protein activation. J. Biol. Chem. 288, 17859–17870 10.1074/jbc.M112.440677 - DOI - PMC - PubMed

Publication types

MeSH terms

Substances