. 2018 Nov 2;293(44):17166-17187.
doi: 10.1074/jbc.RA118.004767. Epub 2018 Sep 14.

Two distinct conformations of factor H regulate discrete complement-binding functions in the fluid phase and at cell surfaces

Affiliations

Two distinct conformations of factor H regulate discrete complement-binding functions in the fluid phase and at cell surfaces

Amy J Osborne et al. J Biol Chem. .

Abstract

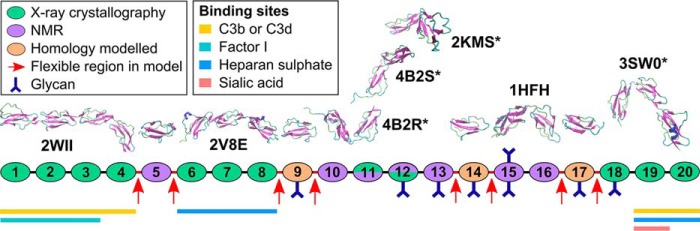
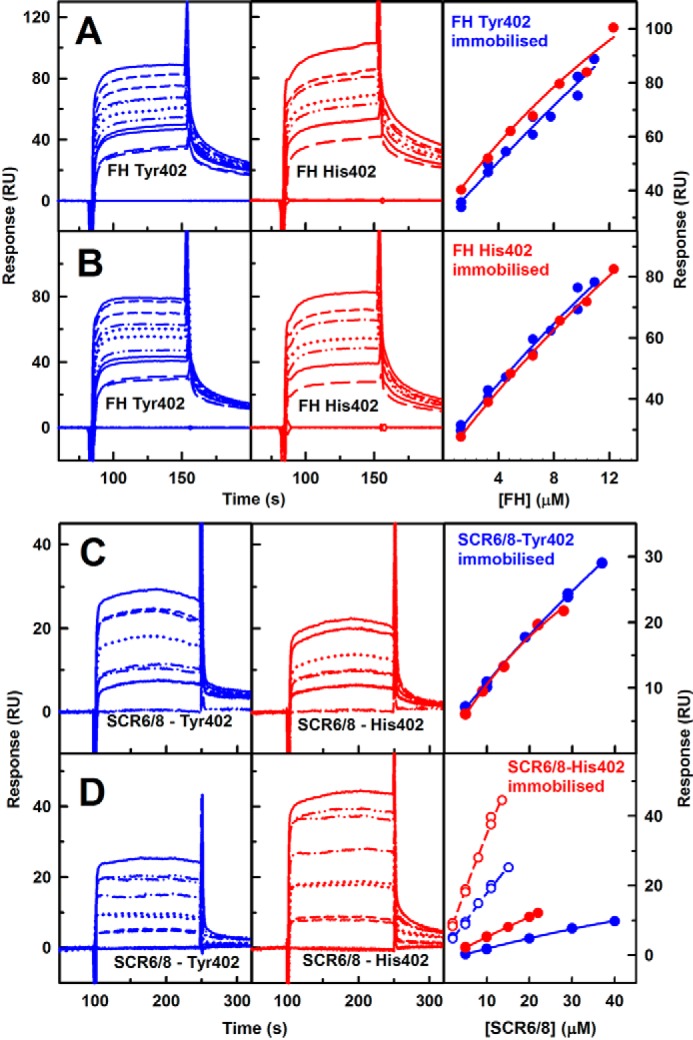
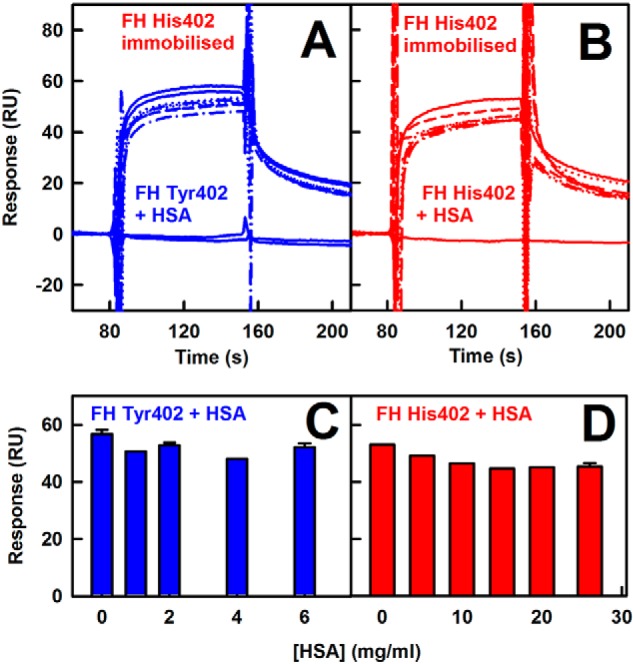
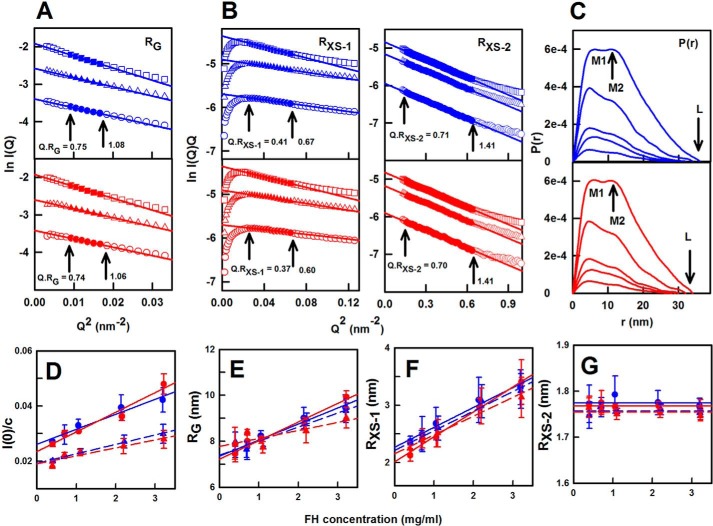
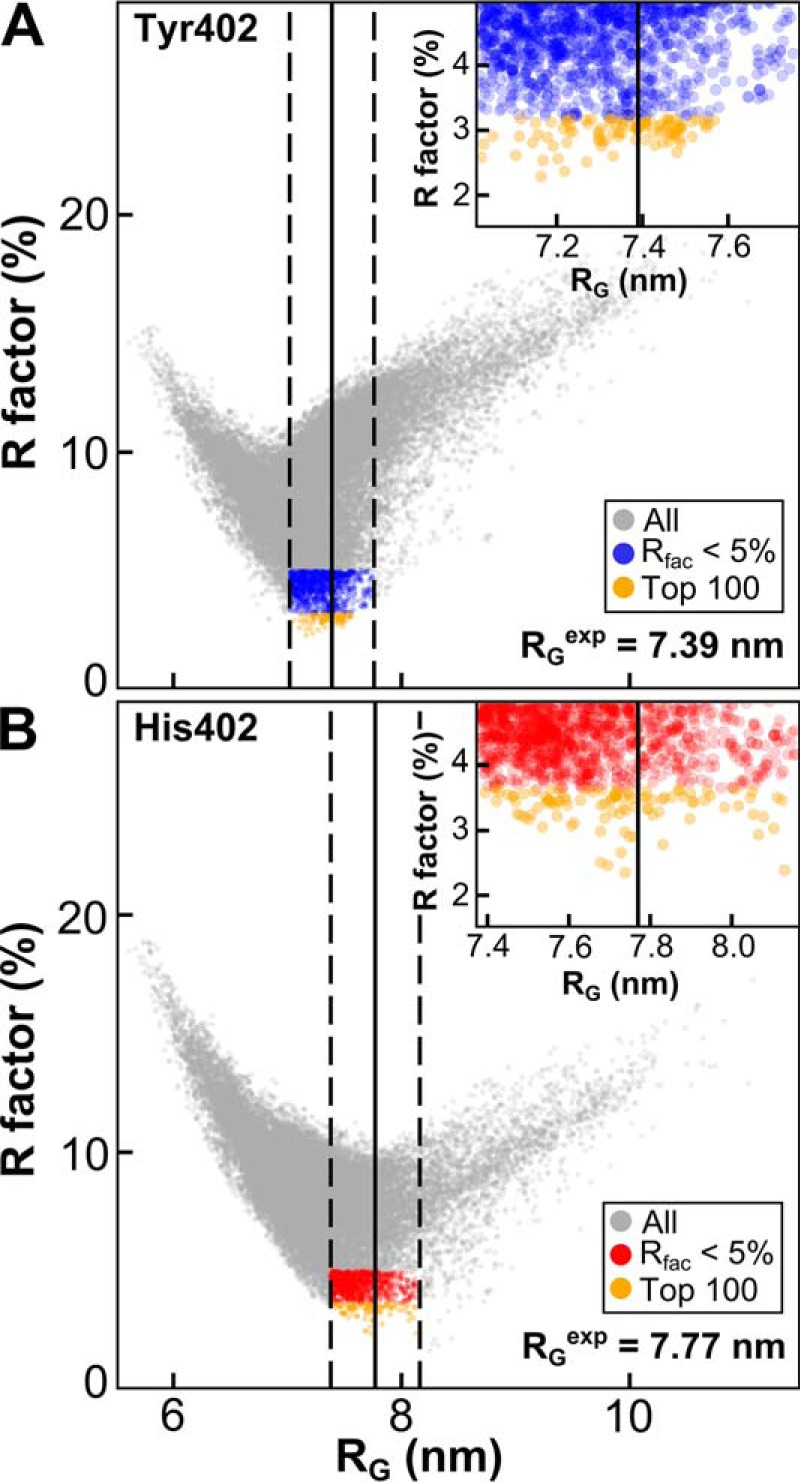
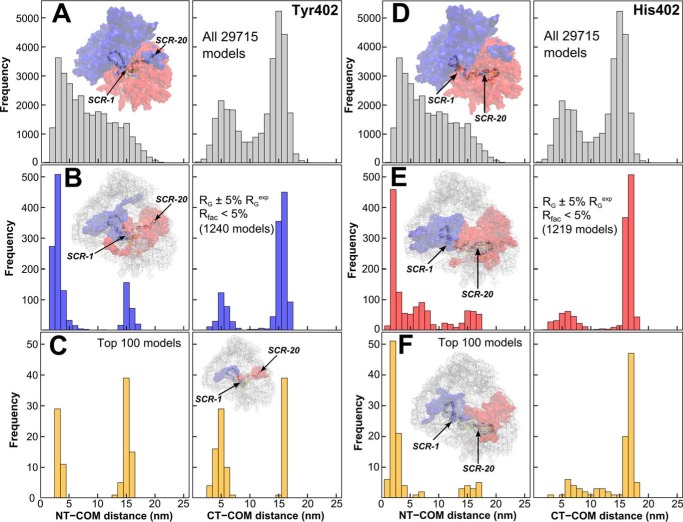
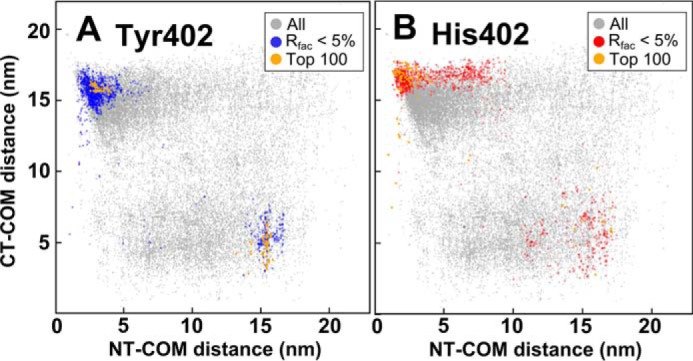
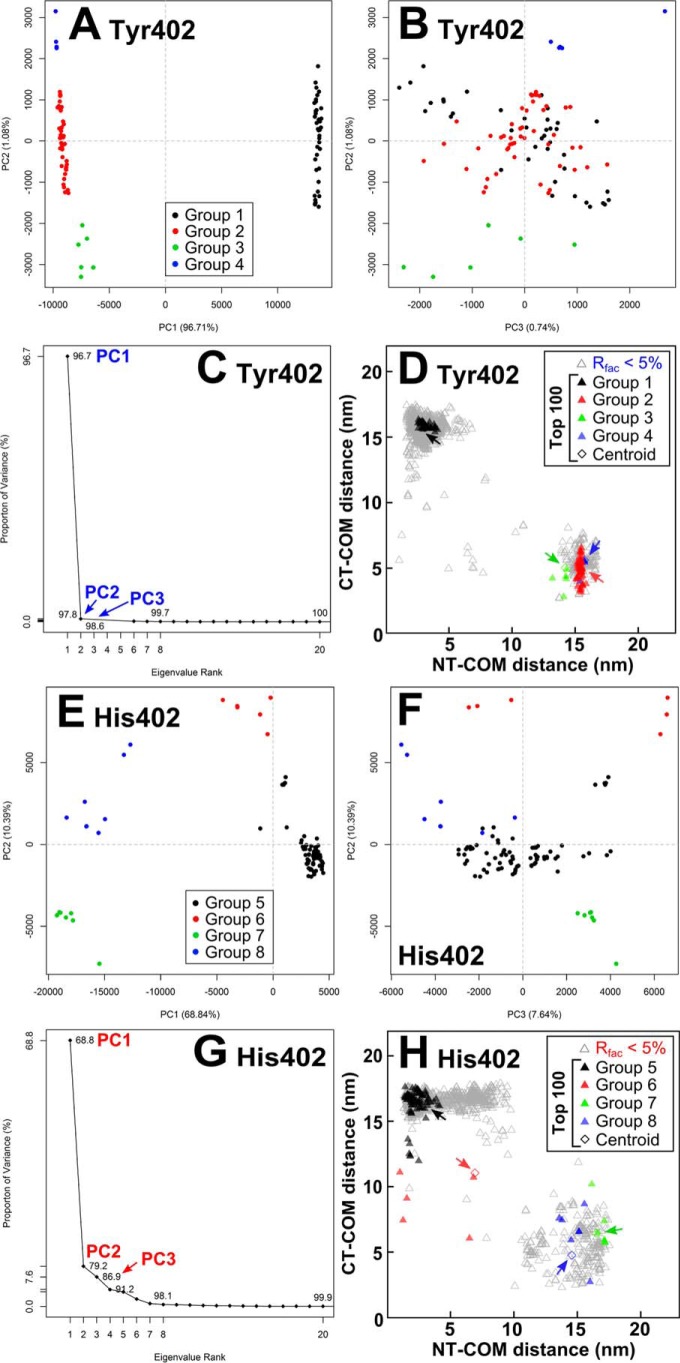
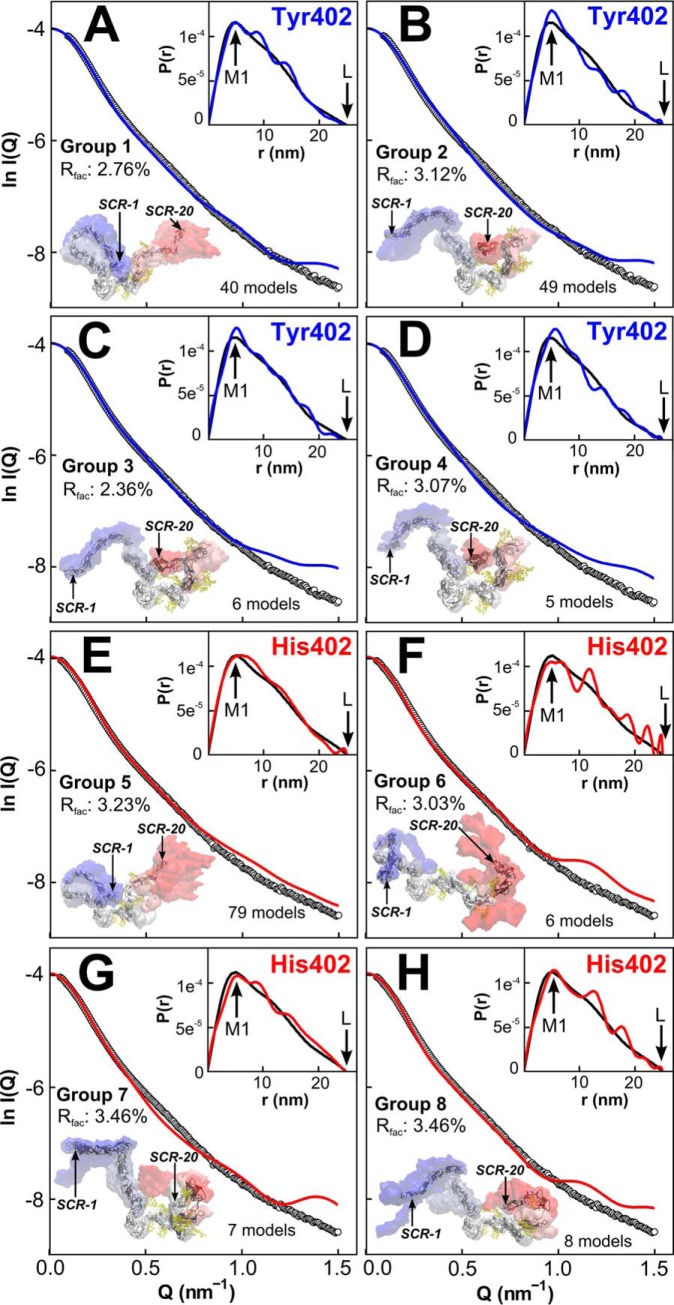
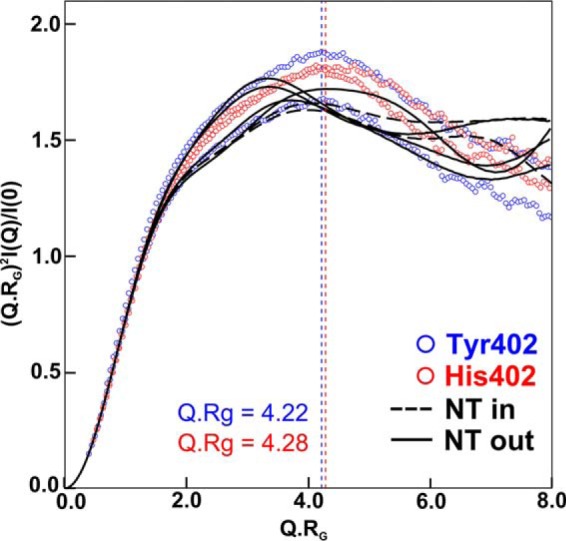
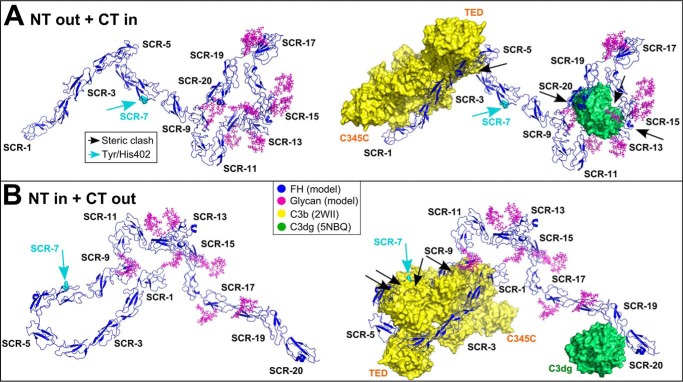
Factor H (FH) is the major regulator of C3b in the alternative pathway of the complement system in immunity. FH comprises 20 short complement regulator (SCR) domains, including eight glycans, and its Y402H polymorphism predisposes those who carry it to age-related macular degeneration. To better understand FH complement binding and self-association, we have studied the solution structures of both the His-402 and Tyr-402 FH allotypes. Analytical ultracentrifugation revealed that up to 12% of both FH allotypes self-associate, and this was confirmed by small-angle X-ray scattering (SAXS), MS, and surface plasmon resonance analyses. SAXS showed that monomeric FH has a radius of gyration (Rg ) of 7.2-7.8 nm and a length of 25 nm. Starting from known structures for the SCR domains and glycans, the SAXS data were fitted using Monte Carlo methods to determine atomistic structures of monomeric FH. The analysis of 29,715 physically realistic but randomized FH conformations resulted in 100 similar best-fit FH structures for each allotype. Two distinct molecular structures resulted that showed either an extended N-terminal domain arrangement with a folded-back C terminus or an extended C terminus and a folded-back N terminus. These two structures are the most accurate to date for glycosylated full-length FH. To clarify FH functional roles in host protection, crystal structures for the FH complexes with C3b and C3dg revealed that the extended N-terminal conformation accounted for C3b fluid-phase regulation, the extended C-terminal conformation accounted for C3d binding, and both conformations accounted for bivalent FH binding to glycosaminoglycans on the target cell surface.

Keywords: C3b activity; Monte Carlo modeling; X-ray scattering; analytical ultracentrifugation; complement; complement regulation; immune system; innate immunity; molecular modeling; solution structure; surface plasmon resonance (SPR).


Conflict of interest statement

The authors declare that they have no conflicts of interest with the contents of this article

Figures

Figure 1.
Figure 1.
Cartoon of the 20 SCR domains in FH. Each SCR domain is represented by an ellipse color-coded to indicate the starting atomistic structure (green, X-ray crystallography; purple, NMR; orange, homology modeling). Ribbon views of the seven SCR structures used to model FH are shown above the cartoon, together with their PDB codes. The asterisks signify newer SCR structural models that became available after the previous full-length FH models were published. Below the cartoon, the FH functional binding sites are denoted by horizontal bars for each of C3b, C3d, factor I, heparan sulfate, and sialic acid.
Figure 2.
Figure 2.
Size-exclusion gel filtration of homozygous FH. Pairs of homozygous purified FH Tyr-402 and His-402 at A, 0.9 mg/ml, and B, 0.3 mg/ml, were loaded onto a SuperoseTM 6 prep grade XK 16/60 column immediately after AUC sedimentation velocity experiments. Here and below, data for the Tyr-402 and His-402 allotypes are denoted in blue and red, respectively.
Figure 3.
Figure 3.
Sedimentation velocity c(s) size-distribution analyses for FH Tyr-402 and FH His-402. All analyses correspond to 1.1 mg/ml FH. A, representative sedimentation boundary fits corresponding to FH Tyr-402 (blue) and FH His-402 (red) are shown using only every 10th scan for clarity. The experimental data are shown in black. B, peaks 1–3 in the c(s) analyses for five FH Tyr-402 and five FH His-402 samples (red) are shown in different line styles. The averaged c(s) plots for FH Tyr-402 and FH His-402 are shown at the right. The monomer peak 1 at 5.7 S is normalized to 100. C, full c(s) analyses for FH Tyr-402 and FH His-402 reveal up to nine FH oligomer species starting with peaks 1 and 2 for monomer and dimer and extending to peak 9 for presumed nonamers. D, proportion of FH oligomers was derived by integration of the c(s) analyses for peaks 2–9 for the five FH Tyr-402 and FH His-402 samples at concentrations between 0.5 and 2.4 mg/ml. Statistical error bars are shown where visible. The mean proportion of oligomers is shown as horizontal lines.
Figure 4.
Figure 4.
Mass spectrometry of FH Tyr-402 and FH His-402. The FH monomer, dimer, and trimer peaks are marked by M, D, and T and their measured molecular weights. A, homozygous FH Tyr-402/Val-62 was studied at 3.9 mg/ml (25.3 μm) in 140 mm ammonium acetate buffer, pH 7.0. B, same FH Tyr-402/Val-62 sample was studied at 4.4 mg/ml (28.6 μm) in 1 m ammonium acetate buffer, pH 7.0. C, homozygous FH His-402/Val-62 was studied at 3.9 mg/ml (25.3 μm) in 140 mm ammonium acetate buffer, pH 7.0. D, same FH His-402/Val-62 sample was studied at 3.6 mg/ml (23.4 μm) in 1 m ammonium acetate buffer, pH 7.0.
Figure 5.
Figure 5.
Surface plasmon resonance analysis of FH Tyr-402 and FH His-402 self-association. The sensorgrams are shown after subtraction of that recorded with the buffer only. In the right panels, no KD values were determined because these were greater than 40 μm. A, 800 RU of homozygous FH Tyr-402/Val-62 was immobilized on a CM3 chip. FH Tyr-402/Val-62 was analyzed at eight concentrations of 0 μm (measured twice), 1.30 μm (twice), 3.24 μm (twice), 4.53 μm, 6.48 μm (twice), 7.77 μm, 9.72 μm (twice), and 10.93 μm from bottom to top. FH His-402/Val-62 was analyzed at eight concentrations of 0 μm (twice) and 1.30, 3.24, 4.86, 6.48, 8.42, 10.37, and 12.31 μm. Here and below, binding affinities were fitted using the maximum response values. B, 800 RU of homozygous FH His-402/Val-62 was immobilized on a CM3 chip. The same FH Tyr-402/Val-62 and FH His-402/Val-62 concentrations were used. C, 150 RU of SCR-6/8 Tyr-402 was immobilized on a CM4 chip. SCR-6/8 Tyr-402 was analyzed at concentrations of six concentrations of 0 μm (twice), 5 and 10 μm (twice), 19 μm, 29 μm (twice), and 37 μm from bottom to top. For the His-402 allotype, six concentrations of 0 μm (twice), 5 and 10 μm (twice), 19 and 29 μm (twice), and 37 μm were used, each measured in duplicate. D, 400 RU of SCR-6/8 His-402 was immobilized on a CM4 chip The binding affinities were likewise fitted using the maximum response values (open circles). A second experiment with 150 RU of SCR-6/8 His-402 immobilized on a CM4 chip and six concentrations of 0, 5, 10, 15, 20, and 22 μm SCR-6/8 is also shown (filled circles).
Figure 6.
Figure 6.
Surface plasmon resonance analysis of FH self-association in the presence of HSA. 800 RU of FH His-402 was immobilized on a CM3 chip. The sensorgrams are shown after subtraction of the sensorgram with those of HSA at the corresponding concentrations. The buffer sensorgram is shown at the bottom. A, FH Tyr-402/Val-62 at 4.53 μm was analyzed with HSA at concentrations between 0 and 6 mg/ml. B, FH His-402 at 4.53 μm was analyzed with HSA at concentrations of 0–26 mg/ml. C and D, bar charts show the maximum responses from A and B, respectively. Error bars are shown where large enough to be observed.
Figure 7.
Figure 7.
X-ray scattering analyses of FH Tyr-402 and FH His-402. In the Rg and RXS Guinier analyses, the filled symbols correspond to the I(Q) data used to determine the Rg or RXS values, and the straight lines correspond to the best fit through those points. The Q·Rg fit ranges are arrowed. A, Rg plots of ln I(Q) versus Q2 at low Q values for FH Tyr-402 (blue) and FH His-402/Val-62 (red) at concentrations of 1.1 mg/ml (○), 2.2 mg/ml (▵), and 3.2 mg/ml (□). The Q fit range was 0.09–0.13 nm−1. B, corresponding cross-sectional RXS-1 and RXS-2 fits of ln I(Q). Q versus Q2 values are shown using Q fit ranges of 0.16–0.26 and 0.4–0.8 nm−1, respectively. C, distance distribution function P(r) analyses are shown at concentrations of 0.4, 0.7, 1.1, 2.2, and 3.3 mg/ml. D–G, concentration dependences of the I(0)/c, Rg, RXS-1, and RXS-2 parameters are shown for FH Tyr-402 and FH Tyr-402/Val-62 (blue; ● and ▴) and FH His-402/Val-62 (red; ● and ▴). Each value was measured in quadruplicate and then averaged and fitted by linear regression except in G when the mean was shown. Statistical error bars are shown where visible. D, I(0)/c intensities were measured in two beam sessions, resulting in two different pairs of lines. E, the Rg values at zero concentration were 7.39 ± 0.25 and 7.35 ± 0.13 nm (FH Tyr-402) and 7.22 ± 0.15 and 7.77 ± 0.27 nm (FH His-402) (Table 3). F, RXS-1 values at zero concentration were 2.21 ± 0.06 and 2.27 ± 0.06 nm (FH Tyr-402), and 2.02 ± 0.06 and 2.15 ± 0.06 nm (FH His-402). G, averaged RXS-2 values were 1.77 and 1.77 nm (FH Tyr-402) and 1.76 and 1.75 nm (FH His-402).
Figure 8.
Figure 8.
Atomistic modeling searches for the FH solution structure. The 29,715 FH models were fitted to one experimental scattering curve for each of homozygous FH Tyr-402/Val-62 (A) and FH His-402/Val-62 (B), each extrapolated to zero concentration. Gray corresponds to all FH models. The blue/red subsets corresponds to FH models that passed two filters, namely Rg within ±5% of the experimental Rg and an R-factor of <5%. Orange corresponds to the 100 best-fit FH models (see inset). The vertical black lines represent the experimental Rg for FH Tyr-402 (7.39 nm) and FH His-402 (7.77 nm). The dashed lines represent the ±5% upper and lower boundaries of these Rg values.
Figure 9.
Figure 9.
Center-of-mass separation frequencies in the FH Tyr-402 and FH His-402 models. A and D, top two panels (gray) show the separations (NT-COM and CT-COM) between the N-terminal α-carbon (NT) and C-terminal α-carbon (CT) to the center of mass (COM) for all 29,715 FH models. B and E, separations are shown for the filtered 1240 and 1219 FH models (Fig. 8). C and F, separations are shown for the 100 best-fit FH models. For each set of FH models, the density plot shows the N-terminal half in blue, the C-terminal half in red, and the best-fit model as a cartoon.
Figure 10.
Figure 10.
Separation densities in the FH Tyr-402 and FH His-402 models. For each of the Tyr-402 (A and B), joint NT-COM and CT-COM separations for the FH Tyr-402 and FH His-402 models are compared with each other. Blue/red corresponds to the filtered FH models, and orange corresponds to the 100 best-fit FH models (Fig. 8).
Figure 11.
Figure 11.
Principal component analyses of the 100 best-fit models for FH Tyr-402 and FH His-402. For FH Tyr-402 (A and B) and FH His-402 (E and F), the 100 best-fit models were grouped by PCA into four groups, 1–4 (black, red, green, and blue, respectively), as exemplified by the first three principal components (PC2 versus PC1 and PC3 versus PC2). C and G, first three eigenvalue rankings (PC1 to PC3) accounted for variances of 98.5 and 86.9% in the 100 best-fit FH models. D and H, black, red, green, and blue triangles correspond to the PCA groups 1–4 and 5–8 in each set of best-fit 100 models. The four arrowed diamonds correspond to the average (centroid) model for each PCA group.
Figure 12.
Figure 12.
Scattering curve fits for the centroid PCA models for FH. For FH Tyr-402 (A–D) and FH His-402 (E–H). the four panels display the centroid FH model for the PCA groups 1–4 and 5–8, respectively, in density plots. The number of FH models in each PCA group is displayed. The experimental curve is denoted by black circles, and the theoretical curve is denoted as solid blue/red lines. The inset shows the P(r) curves for the experimental data (black line) and modeled curve (blue/red line). For each PCA group, the conformational space is represented as blue (NT), white or red (CT) density. The average (centroid) model of each PCA group is depicted as a black cartoon in which SCR-1 and SCR-20 are arrowed.
Figure 13.
Figure 13.
Normalized Kratky plots for the experimental and best-fit FH curves. The four experimental curves are shown in blue and red for the Tyr-402 and His-402 allotypes, respectively, which peak at Q·Rg values of 4.22 and 4.28, respectively. For both allotypes, the theoretical curves for four N-terminal extended and two C-terminal extended FH models are shown as black solid and dashed lines, respectively. These correspond to the two sets of centroid models of Fig. 12, B, C, D, and H and Fig. 12, A and E, respectively.
Figure 14.
Figure 14.
Best-fit FH centroid models superimposed onto C3b and C3dg. For both allotypes, the most representative N-terminal extended (A) and C-terminal extended (B) FH models are shown as blue ribbon traces (left). These correspond to the centroid models shown in Figs. 12, B and E, respectively. The coordinates are available for download in supporting Materials. These models were superimposed onto the SCR-1/4-C3b and SCR-19/20-C3dg crystal structures, in which C3b is shown as a yellow surface and C3dg is shown as a green surface (right, PDB codes 2WII and 5NBQ). The eight FH glycans are shown in magenta. The cyan arrow indicates Tyr-402/His-402. Black arrows indicate steric clashes of FH with C3b or C3dg.

References

    1. Law S. K., and Reid K. B. (1995) in Complement (Male D., ed) 2nd Ed., IRL Press at Oxford University Press, Oxford, UK
    1. Whaley K., and Ruddy S. (1976) Modulation of the alternative complement pathways by β1H globulin. J. Exp. Med. 144, 1147–1163 10.1084/jem.144.5.1147 - DOI - PMC - PubMed
    1. Pangburn M. K., Schreiber R. D., and Müller-Eberhard H. J. (1977) Human complement C3b inactivator: isolation, characterization, and demonstration of an absolute requirement for the serum protein β1H for cleavage of C3b and C4b in solution. J. Exp. Med. 146, 257–270 10.1084/jem.146.1.257 - DOI - PMC - PubMed
    1. Farries T. C., Seya T., Harrison R. A., and Atkinson J. P. (1990) Competition for binding sites on C3b by CR1, CR2, MCP, factor B and factor H. Complement Inflamm. 7, 30–41 10.1159/000463124 - DOI - PubMed
    1. Weiler J. M., Daha M. R., Austen K. F., and Fearon D. T. (1976) Control of the amplification convertase of complement by the plasma protein β1H. Proc. Natl. Acad. Sci. U.S.A. 73, 3268–3272 10.1073/pnas.73.9.3268 - DOI - PMC - PubMed

Publication types

LinkOut - more resources