. 2018 Oct 2;115(40):E9333-E9342.
doi: 10.1073/pnas.1801920115. Epub 2018 Sep 14.

Physical basis for long-distance communication along meiotic chromosomes

Affiliations

Physical basis for long-distance communication along meiotic chromosomes

Kyle R Fowler et al. Proc Natl Acad Sci U S A. .

Abstract

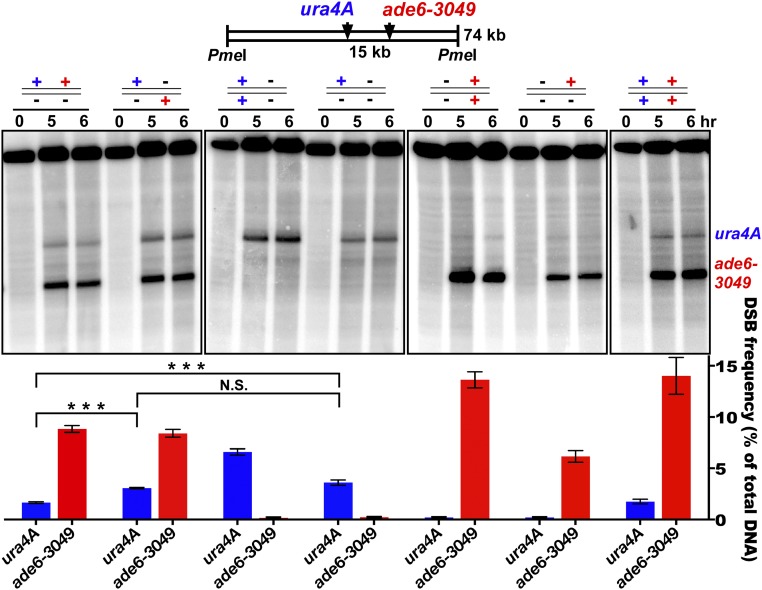
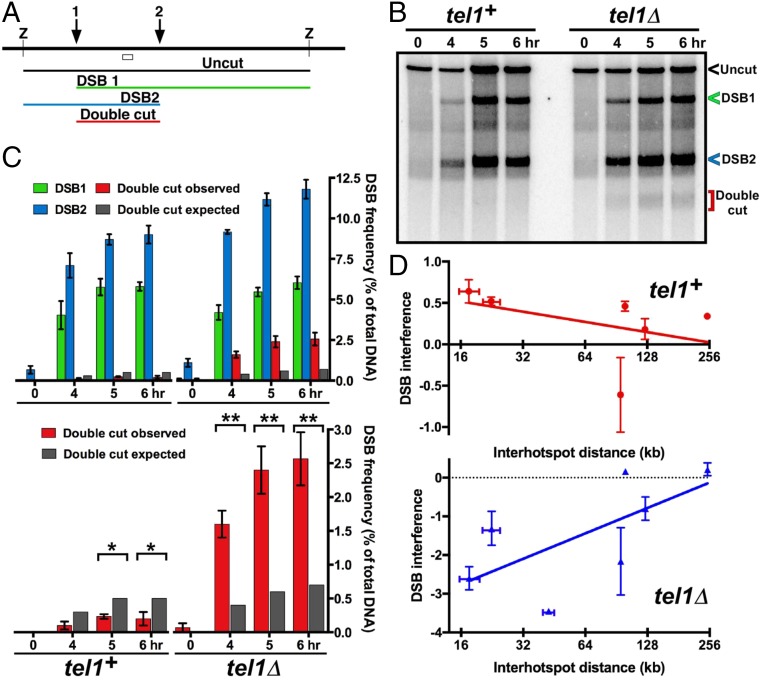
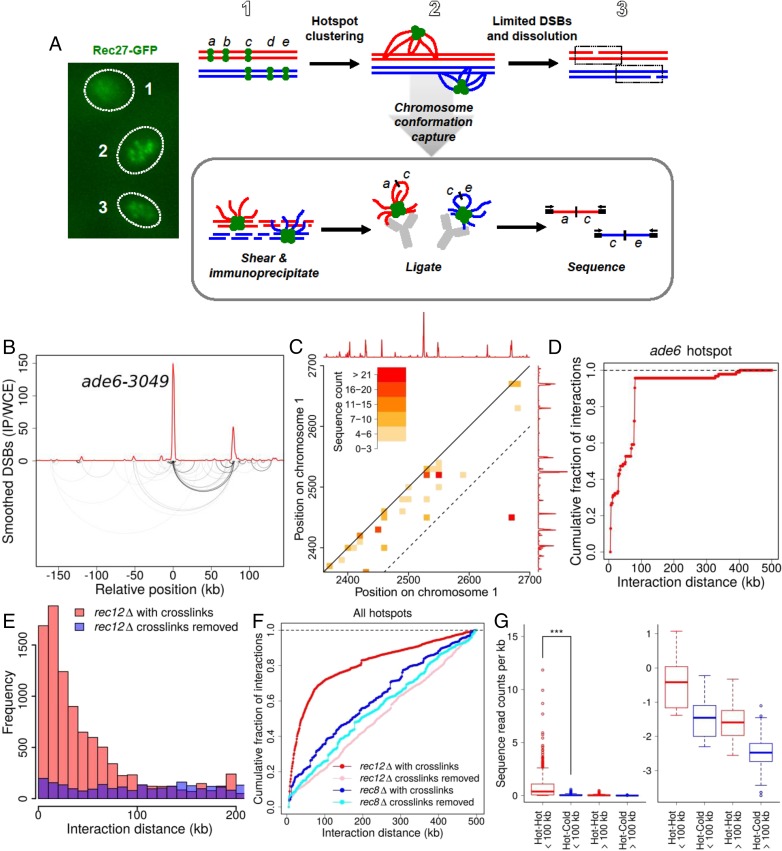
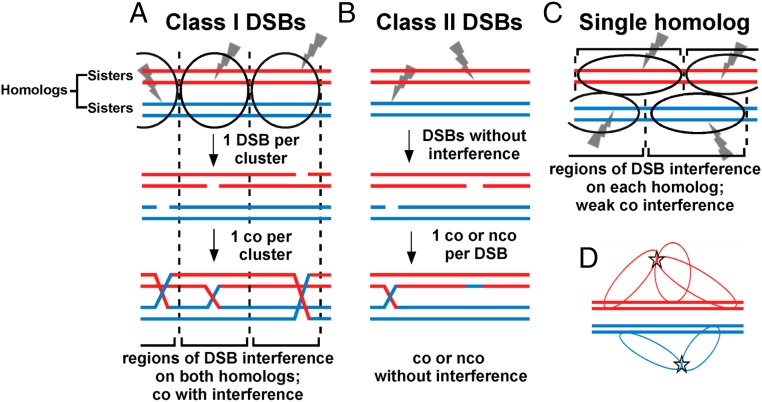
Viable gamete formation requires segregation of homologous chromosomes connected, in most species, by cross-overs. DNA double-strand break (DSB) formation and the resulting cross-overs are regulated at multiple levels to prevent overabundance along chromosomes. Meiotic cells coordinate these events between distant sites, but the physical basis of long-distance chromosomal communication has been unknown. We show that DSB hotspots up to ∼200 kb (∼35 cM) apart form clusters via hotspot-binding proteins Rec25 and Rec27 in fission yeast. Clustering coincides with hotspot competition and interference over similar distances. Without Tel1 (an ATM tumor-suppressor homolog), DSB and crossover interference become negative, reflecting coordinated action along a chromosome. These results indicate that DSB hotspots within a limited chromosomal region and bound by their protein determinants form a clustered structure that, via Tel1, allows only one DSB per region. Such a "roulette" process within clusters explains the observed pattern of crossover interference in fission yeast. Key structural and regulatory components of clusters are phylogenetically conserved, suggesting conservation of this vital regulation. Based on these observations, we propose a model and discuss variations in which clustering and competition between DSB sites leads to DSB interference and in turn produces crossover interference.

Keywords: DNA break interference; DSB hotspot clustering; S. pombe; crossover interference; meiosis.


Conflict of interest statement

The authors declare no conflict of interest.

Figures

Fig. 1.
Fig. 1.
DSB hotspots compete with each other over ∼200-kb regions. (A) Rec12 (Spo11 homolog; green ball) forms DSBs, remains covalently linked to 5′ ends, and is removed by an endonuclease to expose 3′ single-stranded tails (30, 58). Tails invade homologous DNA to form joint DNA molecules, resolved to form cross-overs as shown or non–cross-overs. Each line is ssDNA, blue and red from each parent; dashed lines indicate newly synthesized DNA. (B) DSBs are reduced at hotspots within ∼100 kb of the Rec25, Rec27-dependent ade6-3049 hotspot (4, 10, 24). Shown is DSB frequency, measured by ChIP-chip of Rec12-DNA covalent complexes, on part of Chr 3 with (ade6-3049; red line) or without (ade6-3057; blue line) a hotspot. (C) DSB frequency is increased only on the chromosome with hotspot alteration. (Upper) Natural hotspot mbs1 on Chr 1 (mbs1+ vs. mbs1-20 deletion). (Lower) ade6 hotspot on Chr 3 (ade6-3049 vs. ade6-3057). (SI Appendix, Fig. S1) (11). Individual points (+) are microarray values at other hotspots ≤50 kb of each side of the compared hotspot. Heat maps (densest in magenta) indicate densities of other points. Scales, log10. (D) Competition extends ∼100 kb on each side of a hotspot. Hotspot peaks surrounding mbs1 or ade6-3049 were integrated in the presence or absence of mbs1 or ade6-3049; each hotspot’s DSB ratio was plotted against its distance from mbs1 or ade6-3049. Values >1 indicate more breakage in the absence of each hotspot. Data were averaged (blue line) using a 50-kb sliding window in 25-kb steps. Median ratio is 0.95 (solid red line); dashed red lines indicate median ± two SD.
Fig. 2.
Fig. 2.
DSB competition acts along a homolog (in cis) but not between homologs (in trans). ura4A (blue) and ade6-3049 (red) DSB hotspots on Chr 3 were on the same (in cis; leftmost lane set) or different (in trans, second lane set) parental homologs. +, hotspot present; −, hotspot absent. DSBs were assayed at the indicated times after induction of meiosis in rad50S [wild-type DSB distribution (59)]. Data (mean ± SEM; n = 3 or 4) show the percent of DNA broken at the indicated hotspot (assay probe at the right end of the PmeI fragment). The fourth lane set from the left (no ade6 hotspot) shows that the ura4A hotspot is reduced by ade6-3049 in cis (first lane set; ***P < 0.0005 by unpaired t test) but not in trans [second lane set; P > 0.07 by unpaired t test; N.S. (not significant)]. The first two lane sets show that ade6-3049 reduces the ura4 hotspot more in cis than in trans (***P < 0.0001 by unpaired t test). See SI Appendix, Table S3 for individual data and SI Appendix, Fig. S2 for additional competitive pairs.
Fig. 3.
Fig. 3.
Interference of DSB formation at nearby hotspots depends on Tel1 DNA damage-response protein kinase. (A) Scheme for assaying DSB frequency at either one or both hotspots (1 and 2) by Southern blot hybridization of DNA cut by restriction enzyme Z; the open box indicates the probe position. (B) DSB interference between two hotspots about 15 kb apart near the left end of Chr 2. (C) The observed doubly broken fragment (red bars) is less frequent than expected from independent breakage at the two hotspots (dark gray bars) in wild type but is more frequent than expected in tel1Δ. See SI Appendix, Figs. S3–S5 and Table S1 for additional data. (D) DSB interference is positive in tel1+ but negative in tel1Δ mutants. Error bars indicate SEM or range (SI Appendix, Table S1).
Fig. 4.
Fig. 4.
Physical clustering of DSB hotspots is limited to an ∼200-kb chromosomal region. (A) Scheme for determining clustering of DSB hotspots bound by LinE proteins, such as Rec27-GFP, which form a limited number of foci (or clusters of foci) in meiotic nuclei (Left) (31), perhaps corresponding to the steps in the Upper row. DNA within each cluster is cross-linked to a tagged LinE protein and analyzed as indicated in the box (see text). (B) Analysis of DNA bound by Rec27-GFP, which binds DSB hotspots with high specificity (4), shows preferential ligation of the ade6-3049 hotspot DNA to another hotspot ∼80 kb away (lower arcs; darker lines indicate greater frequency). Ligated sequences were omitted if neither end mapped to a hotspot. The red line indicates DSB frequency relative to genome median, determined by microarray hybridization (4). See also SI Appendix, Fig. S7. (C) Standard contact heat-map of ligations (hot–hot and hot–cold) in the 2,350–2,700 kb region of Chr 1. DSB frequency relative to the genome median (red line, on a linear scale) is from ref. . The dashed line indicates positions 100 kb apart on the chromosome; note that most of the intense interactions are within this limit, with the exception of ligations between two hotspots about 250 kb apart. See also SI Appendix, Figs. S8–S10. (D) Summation of all ligations between the ade6-3049 hotspot and DNA within 500 kb of each side. (E) Distance between pairs of sites ligated among all genomic hotspots with chromatin cross-links maintained until after ligation (red bars) or with cross-links removed just before ligation (purple bars; blue where these values are greater than those with maintained cross-links). (F) Summation of ligations between all genomic hotspots with chromatin cross-links maintained until after ligation (red line) or with cross-links removed just before ligation (pink line). Preferential ligations between nearby hotspots are much less frequent and extend greater distances in the absence of the Rec8 cohesin subunit with (dark blue line) or without (light blue line) maintenance of chromatin cross-links (see also SI Appendix, Fig. S13). (G, Left) Ligations between hotspots <100 kb apart are more frequent than those >100 kb apart (***P < 0.001 by unpaired t test). (Right) The same data are shown on a log10 scale for clarity of low levels. Data are the number of ligations per kilobase; mean values (thick horizontal bars) are flanked by the 25th and 75th percentiles (boxes) and 95th percentiles (whiskers). See SI Appendix, Fig. S6D for additional data with Rec25 and with another tag for immunoprecipitation and SI Appendix, Figs. S6–S13 for additional data.
Fig. 5.
Fig. 5.
Model for crossover interference based on DSB interference among clustered DSB hotspots. Each horizontal line is one sister chromatid (dsDNA molecule), red for one parental homolog (pair of sister chromatids) and blue for the other. Ovals indicate clusters, within which one DSB (gray lightning bolt) occurs. (A) In species with complete interference, clusters of activated DSB hotspots on both homologs form in a limited chromosomal region; only one DSB (class I) is made in each cluster. Consequently, no more than one crossover is made in that region, resulting in crossover interference. In a population of cells, clusters are distributed more or less randomly; interference is thus complete in short genetic intervals but becomes less in longer genetic intervals and is negligible in genetic intervals equal to or greater than that resulting from one crossover (50 cM). (B) In some species, class II DSBs are also formed but are not cluster-controlled and consequently do not manifest interference. Crossover interference is incomplete but is greater if class I DSBs outnumber class II DSBs. (C) In some species, such as fission yeast, clusters form between activated DSB hotspot sites on one homolog, not two. Consequently, DSBs (class I) manifest interference (on one DNA molecule), but cross-overs manifest only weak interference, since DSBs form independently on the two homologs (Discussion). (D) Flexible chromatin loops enable very distant DSB hotspots bound by their activating protein determinants to form a cluster. DSB hotspots on chromatin loops could extend from the chromosomal axis (central thick lines, each a dsDNA molecule or sister chromatid) and thereby allow activated DSB hotspots to form a cluster (star), even though they might be at the extremities of the chromosome. Clusters might form over both homologs (as in A) or over only one homolog (as in C).

References

    1. Petronczki M, Siomos MF, Nasmyth K. Un ménage à quatre: The molecular biology of chromosome segregation in meiosis. Cell. 2003;112:423–440. - PubMed
    1. Sturtevant AH. The behavior of the chromosomes as studied through linkage. Z Indukt Abstamm Vererbungsl. 1915;13:234–287.
    1. Lam I, Keeney S. Mechanism and regulation of meiotic recombination initiation. Cold Spring Harb Perspect Biol. 2014;7:a016634. - PMC - PubMed
    1. Fowler KR, Gutiérrez-Velasco S, Martín-Castellanos C, Smith GR. Protein determinants of meiotic DNA break hot spots. Mol Cell. 2013;49:983–996. - PMC - PubMed
    1. Loidl J. S. pombe linear elements: The modest cousins of synaptonemal complexes. Chromosoma. 2006;115:260–271. - PubMed

Publication types

MeSH terms