. 2018 Oct 2;115(40):E9429-E9438.
doi: 10.1073/pnas.1802155115. Epub 2018 Sep 14.

Contributions of the glycocalyx, endothelium, and extravascular compartment to the blood-brain barrier

Affiliations

Contributions of the glycocalyx, endothelium, and extravascular compartment to the blood-brain barrier

Nikolay Kutuzov et al. Proc Natl Acad Sci U S A. .

Abstract

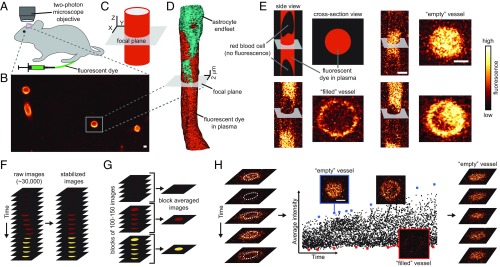
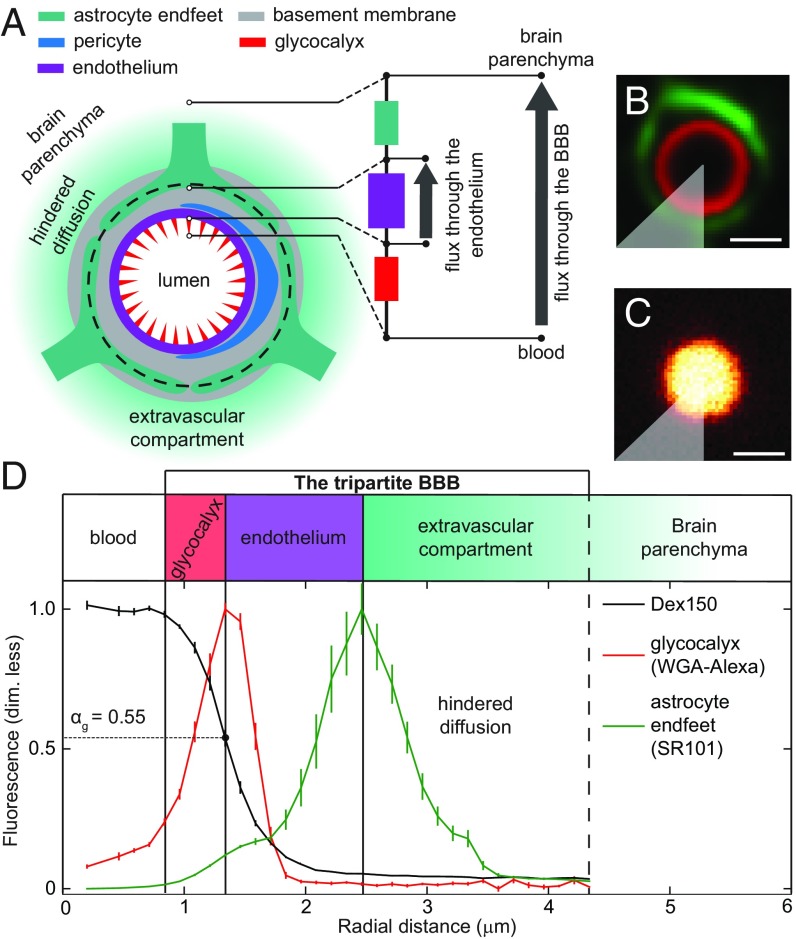
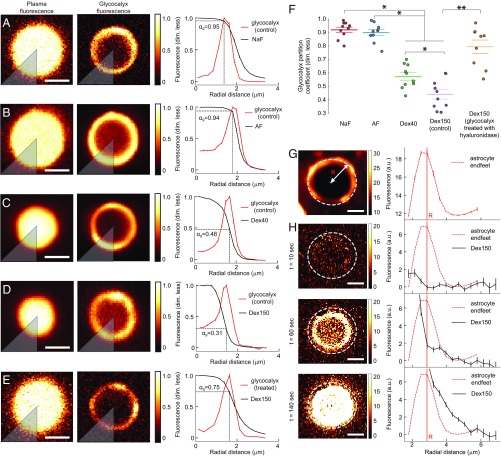
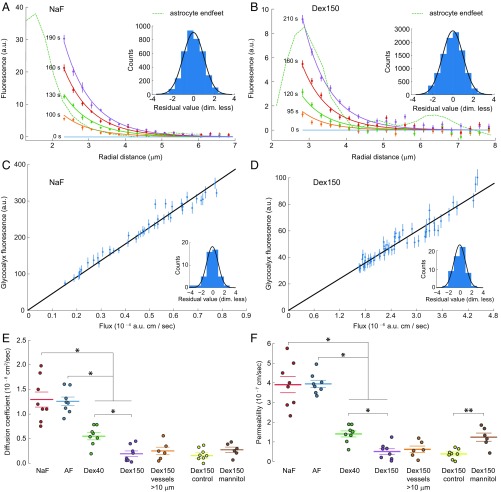
The endothelial cells that form the blood-brain barrier (BBB) are coated with glycocalyx, on the luminal side, and with the basement membrane and astrocyte endfeet, on the abluminal side. However, it is unclear how exactly the glycocalyx and extravascular structures contribute to BBB properties. We used two-photon microscopy in anesthetized mice to record passive transport of four different-sized molecules-sodium fluorescein (376 Da), Alexa Fluor (643 Da), 40-kDa dextran, and 150-kDa dextran-from blood to brain, at the level of single cortical capillaries. Both fluorescein and Alexa penetrated nearly the entire glycocalyx volume, but the dextrans penetrated less than 60% of the volume. This suggested that the glycocalyx was a barrier for large but not small molecules. The estimated permeability of the endothelium was the same for fluorescein and Alexa but several-fold lower for the larger dextrans. In the extravascular compartment, co-localized with astrocyte endfeet, diffusion coefficients of the dyes were an order of magnitude lower than in the brain parenchyma. This suggested that the astrocyte endfeet and basement membrane also contributed to BBB properties. In conclusion, the passive transport of small and large hydrophilic molecules through the BBB was determined by three separate barriers: the glycocalyx, the endothelium, and the extravascular compartment. All three barriers must be taken into account in drug delivery studies and when considering BBB dysfunction in disease states.

Keywords: astrocytes; blood–brain barrier; diffusion; glycocalyx; permeability.


Conflict of interest statement

The authors declare no conflict of interest.

Figures

Fig. 1.
Fig. 1.
The imaging setup and pipeline of data analysis. (A) Images of brain vessels were collected from anesthetized mice through a cranial window with a two-photon microscope. Fluorescent dyes were continuously injected into a femoral vein with a pump. (B) An image of a brain region, showing blood vessels filled with Dex150. Only blood vessels oriented perpendicular to the focal plane were recorded and analyzed. (C) We modeled the selected blood vessels as cylinders, oriented perpendicular to the focal plane (gray area) and surrounded by a medium that was rotationally symmetric about the vessel. (D) Reconstruction of capillary geometry from images taken at different depths. The vessel is perpendicular to the focal plane, and it is approximately a cylinder for 10 μm above and below the focal plane. (E) Comparison between fast-scanned images of two blood vessels, one viewed from the side, another viewed in cross-section. When blood cells are imaged, they replace the plasma and, hence, the fluorescent dye is absent (“filled” vessel). Consequently, filled vessels have dark shadows of various shapes inside them. (F) Before analysis, all recorded images were stabilized to correct for tissue movement (see SI Appendix, Image Registration). (G) To estimate the diffusion coefficient of the dye, D*, in the extravascular compartment, stabilized images were block-averaged in time. (H) The average fluorescence intensity in the central part of the vessel (dotted white circles) was calculated for each recorded image and plotted as a function of time (Right). The points of highest intensity (blue) represent the fluorescence intensity in plasma. Images without blood cells (“empty” vessels) that corresponded to these points were extracted (SI Appendix, Fig. S6) and used to calculate the coefficient, αg, of dye partitioning between the plasma and the glycocalyx. The points of lowest intensity (red) correspond to most of the vessel volume being occupied by a blood cell (“filled” vessel). (Scale bar, 2 μm.)
Fig. 2.
Fig. 2.
Components of the tripartite BBB. Glycocalyx and astrocyte endfeet were labeled and used as landmarks to locate the components of the tripartite BBB on recorded images. (A) Simplified diagram showing the main components of the BBB. We partitioned the BBB into three compartments—glycocalyx (red), endothelium (purple), and extravascular compartment (green)—based on their functional transport properties (glycocalyx partition coefficient, permeability, and diffusion coefficients) revealed by our data. The transport properties of these three compartments are analogous to three Ohmic resistors connected in series (schematic on the right side in A; see Discussion for more explanation). Thus, for a given concentration difference across the BBB, the glycocalyx and the extravascular compartment reduce the drop in concentration across the endothelium, and hence reduce the flux through it, in a manner that depends on the type of molecules in question. (B) Glycocalyx (red) and astrocyte endfeet (green) were labeled with WGA-Alexa and SR101, respectively. (C) Distribution of Dex150 fluorescence in the vessel lumen. The intensity is normalized by its maximum value. (D) Radial intensity profiles were obtained by selecting a sector (gray area, in B and C) and averaging the pixel values located at the same distances from the center of the vessel (SI Appendix, Fig. S1). The maxima of WGA-Alexa and SR101 fluorescence intensities defined the inner and outer boundaries, respectively, of the endothelium. The partition coefficient, αg, is the ratio between the fluorescence intensities of the dye at the peak of the WGA-Alexa distribution (red in B) and in the plasma (C). Error bars were estimated, as described in SI Appendix, Statistics. (Scale bar, 2 μm.)
Fig. 3.
Fig. 3.
Analysis of the glycocalyx partition coefficient of the dye and its diffusion in the extravascular compartment. Glycocalyx partition coefficients (αg) were determined for (A) NaF, (B) AF, (C) Dex40, (D) Dex150, and (E) Dex150 (after enzymatically treating the glycocalyx). All extracted images of empty vessels (Fig. 1H) were normalized to the fluorescence intensity measured at the center of the vessel, and then, the normalized images were averaged. The resulting images of plasma fluorescence (Left) and glycocalyx fluorescence (Middle) were split into eight sectors (a single sector is shown in gray); for each sector, the αg was estimated from the radial intensity distributions (Right). The mean value of all eight sectors was used as the total estimated partition coefficient, αg. For the dyes that effectively permeated the glycocalyx (NaF and AF), the intensity of plasma fluorescence (left column) in the center of the vessel was almost the same as the intensity in the glycocalyx. For the dyes that permeated the glycocalyx less effectively (Dex40 and Dex150), the plasma fluorescence distribution was narrower (left column), and the plasma fluorescence intensity in the glycocalyx was reduced. The relative reduction in fluorescence was quantified as αg. (F) Partition coefficients show that NaF and AF were distributed nearly throughout the entire glycocalyx volume, whereas Dex40 and Dex150 occupied less than 60% of the glycocalyx. Enzymatic treatment of the glycocalyx significantly increased the partition coefficient for Dex150. (G) Astrocyte endfeet fluorescence (Left) and its radial intensity profile (Right), obtained by azimuthal averaging of pixel intensities. (H) Time sequence of Dex150 fluorescence images (Left) and corresponding radial intensity profiles (Right) show the dye distribution as it penetrates the endothelium and travels into the extravascular compartment (outside the white circle). Before analysis, all images were stabilized and block-averaged (see Fig. 1 F and G). Pixels in the center of the vessel were oversaturated to enhance the weaker fluorescence in the extravascular compartment. Only data with rotationally symmetric fluorescence distributions were used for the analysis, which allowed us to model these data with Eq. 1. For a discussion on factors that can affect the extravascular fluorescence intensity, see SI Appendix, Fig. S9. Error bars were estimated as described in SI Appendix, Statistics. (Scale bar, 2 μm.) *P < 0.05, one-way ANOVA with Tukey’s post hoc test. **P < 0.001, Wilcoxon rank-sum test.
Fig. 4.
Fig. 4.
Diffusion coefficients of the extravascular compartment and permeabilities of the vascular endothelium. (A and B) Experimentally measured radial distributions of fluorescence intensity of NaF and Dex150 (points with error bars) and the space-time distribution of fluorescence according to simple diffusion with bleaching, as described by Eq. 1 (lines), which was fitted to the experimental fluorescence data. Different colors indicate different times of measurement and solutions to Eq. 1 at corresponding times. The dashed line indicates the fluorescence of the astrocyte endfeet. (Insets) Histograms of the standardized residuals of the fits shown. A standard Gaussian distribution of standardized residuals indicates a perfect fit. For comparison, a standard Gaussian distribution is plotted (black line) on each histogram. (C and D) Fluorescence intensity in the glycocalyx plotted against the flux across the endothelium. The fluorescence intensities in the glycocalyx are experimental results from inside the blood vessel, and the fluxes across the endothelium are derived from the dependence of the extravascular fluorescence intensity on radial distance. The slope of the straight line through the origin was fitted to the data shown. The permeability of the vascular endothelium was estimated as the reciprocal of that slope (SI Appendix, Eq. 6). (Insets) Same as in A and B. (E and F) Vessel size and BBB integrity effects on (E) diffusion coefficients of fluorescent dyes in the extravascular compartment and (F) endothelial permeability. Mannitol was used to compromise the integrity of the BBB. Individual points represent measurements in different mice; horizontal lines represent the mean, and error bars are the ±SEM. Error bars were estimated as described in SI Appendix, Statistics. *P < 0.05, one-way ANOVA with Tukey’s post hoc test. **P < 0.01, Wilcoxon rank-sum test.

Similar articles

Cited by

References

    1. Fenstermacher JD, Blasberg RG, Patlak CS. Methods for quantifying the transport of drugs across brain barrier systems. Pharmacol Ther. 1981;14:217–248. - PubMed
    1. Gjedde A. High- and low-affinity transport of D-glucose from blood to brain. J Neurochem. 1981;36:1463–1471. - PubMed
    1. Patlak CS, Blasberg RG, Fenstermacher JD. Graphical evaluation of blood-to-brain transfer constants from multiple-time uptake data. J Cereb Blood Flow Metab. 1983;3:1–7. - PubMed
    1. Blasberg RG, Patlak CS, Fenstermacher JD. Selection of experimental conditions for the accurate determination of blood—Brain transfer constants from single-time experiments: A theoretical analysis. J Cereb Blood Flow Metab. 1983;3:215–225. - PubMed
    1. Huxley VH, Curry FE, Adamson RH. Quantitative fluorescence microscopy on single capillaries: Alpha-lactalbumin transport. Am J Physiol. 1987;252:H188–H197. - PubMed

Publication types

MeSH terms