. 2018 Dec;17(12):2551-2563.
doi: 10.1158/1535-7163.MCT-18-0177. Epub 2018 Sep 14.

PLK1 Inhibition Targets Myc-Activated Malignant Glioma Cells Irrespective of Mismatch Repair Deficiency-Mediated Acquired Resistance to Temozolomide

Affiliations

PLK1 Inhibition Targets Myc-Activated Malignant Glioma Cells Irrespective of Mismatch Repair Deficiency-Mediated Acquired Resistance to Temozolomide

Fumi Higuchi et al. Mol Cancer Ther. 2018 Dec.

Abstract

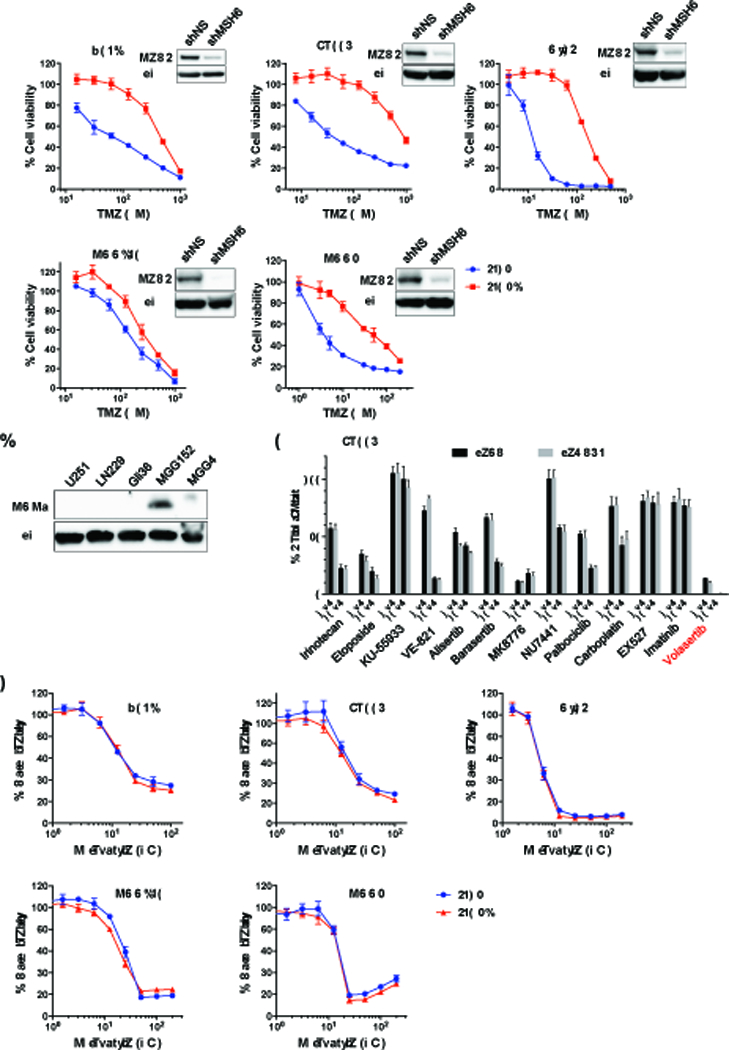
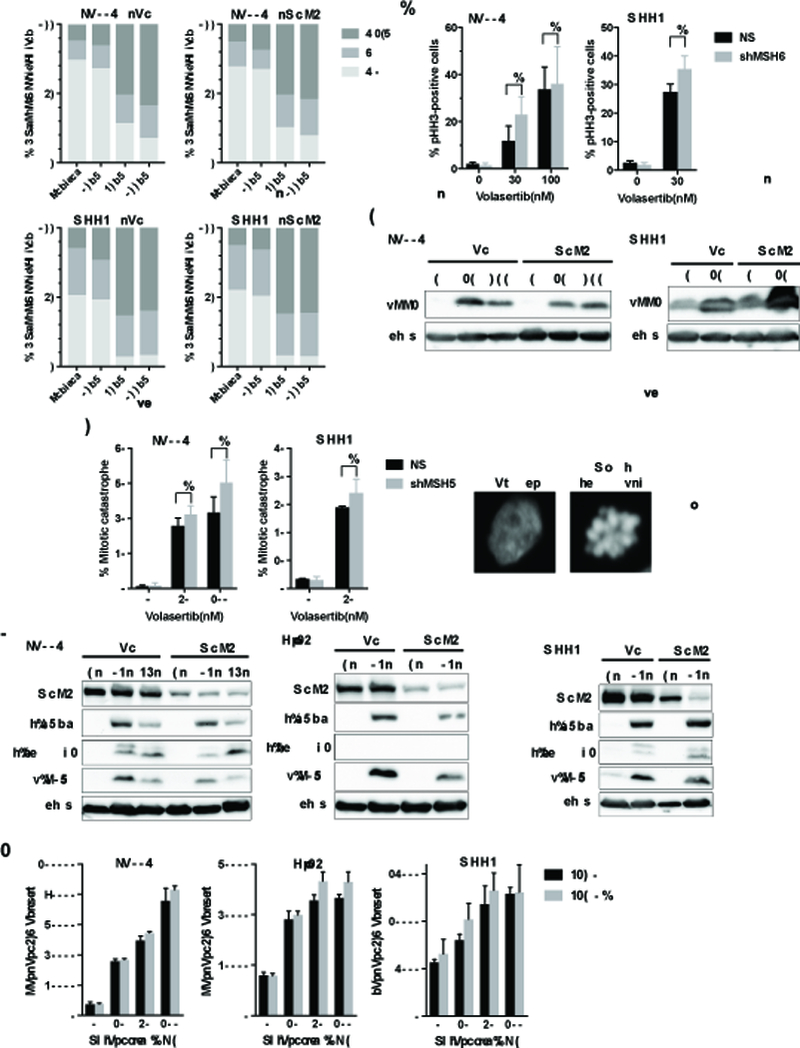
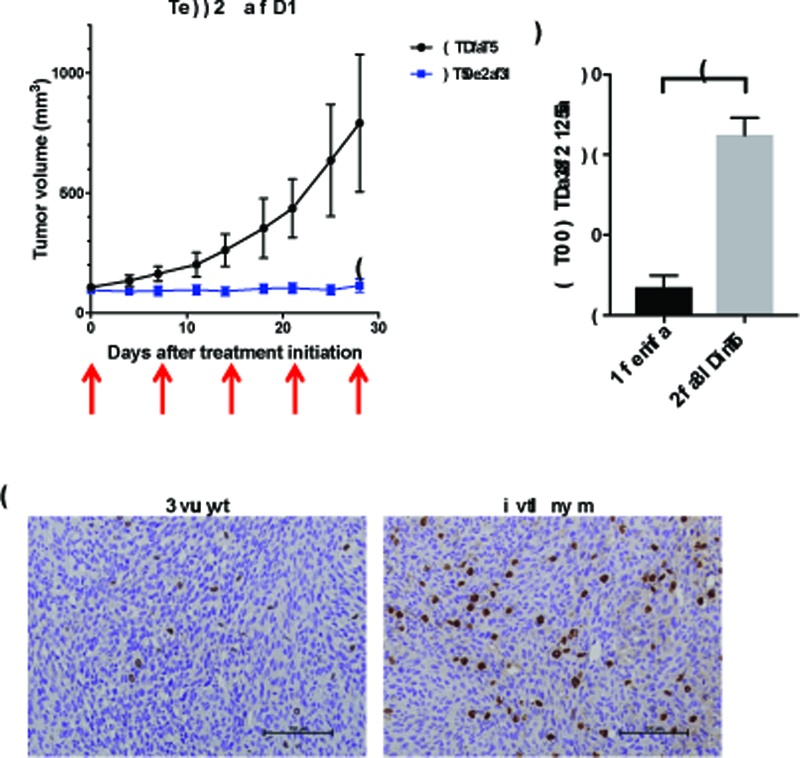
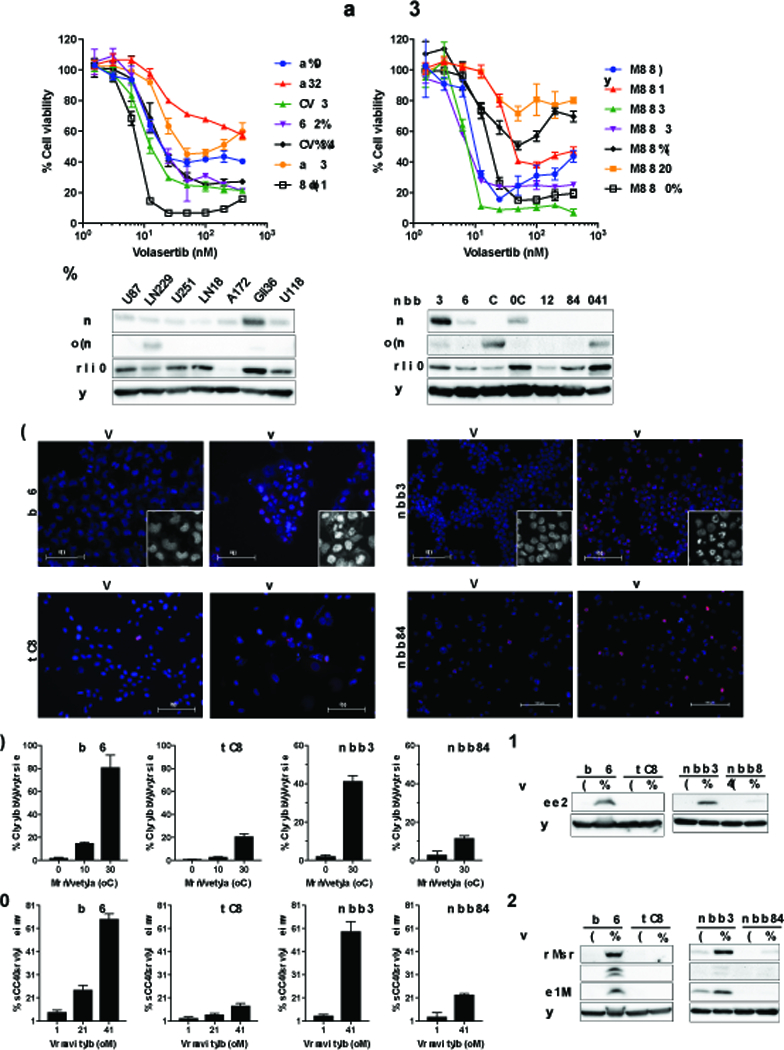
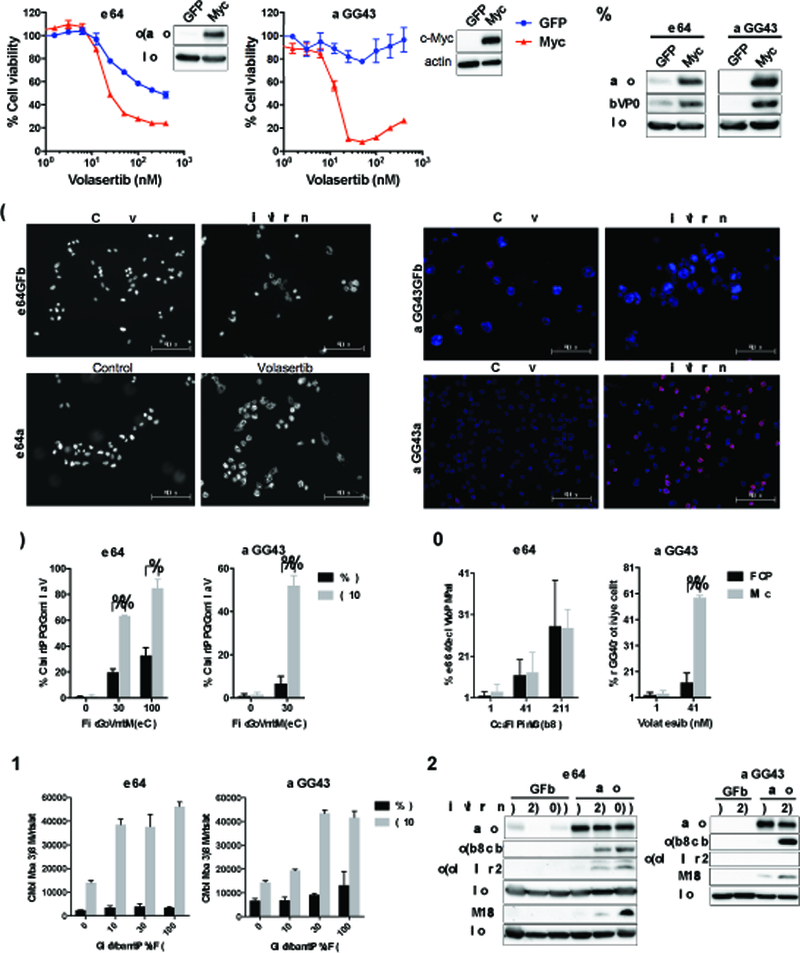
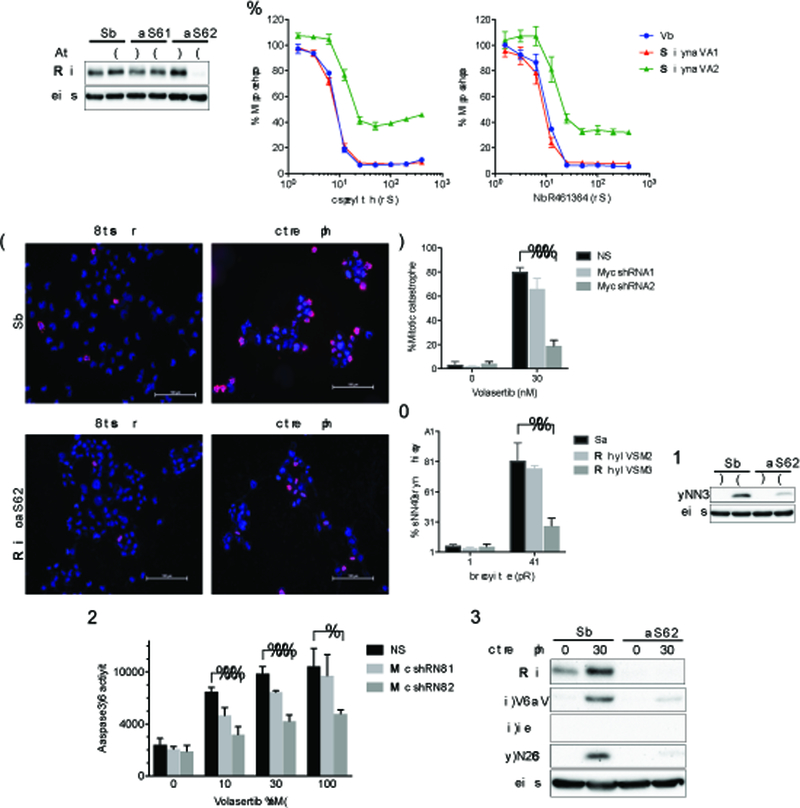
Mismatch repair (MMR) deficiency through MSH6 inactivation has been identified in up to 30% of recurrent high-grade gliomas, and represents a key molecular mechanism underlying the acquired resistance to the alkylating agent temozolomide (TMZ). To develop a therapeutic strategy that could be effective in these TMZ-refractory gliomas, we first screened 13 DNA damage response modulators for their ability to suppress viability of MSH6-inactivated, TMZ-resistant glioma cells. We identified a PLK1 selective inhibitor, Volasertib, as the most potent in inhibiting proliferation of glioblastoma cells. PLK1 inhibition induced mitotic catastrophe, G2-M cell-cycle arrest, and DNA damage, leading to caspase-mediated apoptosis in glioblastoma cells. Importantly, therapeutic effects of PLK1 inhibitors were not influenced by MSH6 knockdown, indicating that their action is independent of MMR status of the cells. Systemic treatment with Volasertib potently inhibited tumor growth in an MMR-deficient, TMZ-resistant glioblastoma xenograft model. Further in vitro testing in established and patient-derived cell line panels revealed an association of PLK1 inhibitor efficacy with cellular Myc expression status. We found that cells with deregulated Myc are vulnerable to PLK1 inhibition, as Myc overexpression sensitizes, whereas its silencing desensitizes, glioblastoma cells to PLK1 inhibitors. This discovery is clinically relevant as glioma progression post-TMZ treatment is frequently accompanied by MYC genomic amplification and/or pathway activation. In conclusion, PLK inhibitor represents a novel therapeutic option for recurrent gliomas, including those TMZ-resistant from MMR deficiency. Genomic MYC alteration may serve as a biomarker for PLK inhibitor sensitivity, as Myc-driven tumors demonstrated pronounced responses.


Conflict of interest statement

Conflicts of Interest:

All authors have no conflicts of interest to report with regard to this manuscript.

Figures

Figure 1.
Figure 1.. Volasertib inhibits the proliferation of glioma cells independent of MSH6 status.
(A) Cell viability assay to determine temozolomide (TMZ) dose response in glioblastoma cells engineered with a non-targeting shRNA (shNS, blue) or MSH6-directed shRNA (shMSH6, red) lentivirus. MSH6 inactivation rendered glioma cell lines (U251, LN229 and Gli36) and patient-derived glioma sphere lines (MGG152 and MGG4) more resistant to TMZ. Immunoblot for each cell line confirmed MSH6 knockdown. Actin was used as a loading control. Cells were treated with specified concentrations of TMZ, and cell viability was evaluated by CellTiter Glo on day 6. (B) Immunoblot for MGMT in parental (unmodified) cell lines used for Figure 1A. Actin was used as a loading control. (C) A compound screening of 13 DNA damage response modulators in LN229shNS (non-silencing) and LN229shMSH6 cells at 1 and 10 μM. Cell viability was measured by CellTiter Glo on day 6. Also see Supplementary Figure S1. (D) Volasertib dose response in control (shNS, blue) and MSH6-knockdown (shMSH6, red) glioblastoma cells. Cell viability was measured by CellTiter Glo assay at 72 hours.
Figure 2.
Figure 2.. Volasertib induces G/2M cell cycle arrest, apoptosis and DNA damage in both MSH6-intact and deficient glioma cells.
(A) Flow cytometric analysis showing cell cycle distribution of LN229 (shNS, shMSH6) and MGG4 (shNS, shMSH6) cells treated with Volasertib at indicated concentrations for 24 hours. (B) LN229 (shNS, shMSH6) and MGG4 (shNS, shMSH6) cells with/without Volasertib treatment (30 or 100 nM for 24 hours) were stained with DAPI and pHH3 antibody. % pHH3 positive cells was quantified in at least 100 cells per experiment. (C) Immunoblot of pHH3 expression in LN229 (shNS, shMSH6) and MGG4 (shNS, shMSH6) cells treated with indicated doses of Volasertib for 24 hours. Actin was used as a loading control. (D) In the same experiment as B, % cells with abnormal mitosis (mitotic catastrophe; shown right is a representative seen in MGG4, along with control healthy nucleus) was evaluated in at least 100 cells per experiment. (E) Immunoblot of MSH6, cleaved-PARP (c-PARP), cleaved-caspase3 (c-caspase3) and phospho-H2Ax (p-H2Ax) expression in shNS and shMSH6 cell lines treated with/without Volasertib (30 nM, 24 or 48 hours). Actin blot was used as a loading control. (F) shNS and shMSH6 glioblastoma cells were treated with indicated concentrations of Volasertib for 24 hours. Caspase3/7 activity was measured by Caspase-Glo 3/7 assay. In B and D, NS, not statistically significant (student t-test).
Figure 3.
Figure 3.. PLK1 inhibitor suppresses MMR-deficient, TMZ-resistant glioma tumor growth in vivo.
(A) Tumor growth curves in LN229shMSH6 xenograft model. Animals were treated with Volasertib (40 mg/kg i.v. once a week x 5 cycles)(N=5) or PBS (Control, N=6). Data are presented as mean tumor volume and SD in each group. Arrows indicate dates of treatment. *, P=0.017, PBS vs Volasertib on day 27 (Mann-Whitney test). (B, C) Nude mice bearing established flank LN229shMSH6 tumors were treated i.v. with a single dose of 40mg/kg Volasertib (N=3) or PBS (Control, N=3). Flank tumors were collected at 24 hours after dosing, and pHH3 immunohistochemistry was performed (brown) (B). Scale bars, 100 μm. (C) Quantification of B is shown. *, P=0.006, PBS (Control) vs Volasertib (student t-test).
Figure 4.
Figure 4.. Testing PLK1 inhibitors in an extended panel identifies Myc as a candidate molecular marker associated with efficacy.
(A) A cohort of glioblastoma cell lines (left) and patient-derived glioma sphere lines (right) were treated with different concentrations of Volasertib. Cell viability was measured by CellTiter Glo at 72 hours. (B) Immunoblot of Myc, N-Myc and PLK1 in glioblastoma cell lines (left) and patient-derived glioma sphere lines (right). Actin was used as a loading control. (C-G) Myc dysregulated glioblastoma preferentially induces apoptosis, DNA damage and mitotic catastrophe in response to Volasertib treatment. (C-E) Myc expressers (Gli36, MGG4) and low/no Myc expressers (U87, MGG75) were treated with and without 30 nM Volasertib for 24 hours and immunostained with pHH3 (red) followed by counterstaining with DAPI (C). Insets are magnified images to better show nuclear morphology. Scale bars, 100 μm. % cells with abnormal mitosis (mitotic catastrophe) were quantified in at least 100 cells per experiment (D). % pHH3 positive cells were measured in at least 100 cells per experiment (E). (F) Immunoblot of pHH3 in Gli36, U87, MGG4, MGG75 cells treated with control or Volasertib (30 nM, 24 hours). (G) Immunoblot of cleaved PARP (c-PARP), cleaved caspase3 (c-caspase3) and p-H2Ax in Gli36, U87, MGG4, MGG75 cells treated with Volasertib (30 nM, 24 hours) compared to control treatment. In F and G, actin was used as a loading control.
Figure 5.
Figure 5.. Myc overexpression upregulates PLK1 expression and sensitizes glioblastoma cells to PLK1 inhibitors.
(A) U87 and MGG75 cells stably transduced with GFP or Myc cDNA were established. Immunoblot confirmed Myc expression with actin used as loading control. GFP (blue) and Myc (red) cells were treated with specified concentrations of Volasertib, and cell viability evaluated at 72 hours by CellTiter Glo. (B) Myc overexpression upregulates PLK1 expression. Immunoblot of Myc and PLK1 in GFP and Myc cells (U87, MGG75). Actin blot as loading control. (C-G) Myc overexpressing lines (U87, MGG75) preferentially induce mitotic catastrophe, DNA damage and apoptosis in response to Volasertib treatment. (C-E) GFP and Myc cells were treated with/without Volasertib at 30 nM for 24 hours and immunostained for pHH3 with DAPI nuclear staining. Black and white pictures are shown for U87GFP and U87Myc to allow better visualization of nuclear morphology. % cells with abnormal mitosis (mitotic catastrophe)(D) and % pHH3 positive cells (E) were measured in at least 100 cells per experiment. In D and E, *, P<0.005. **, P<0.0001 (student t-test). (F) GFP and Myc cells were treated with indicated concentrations of Volasertib for 24 hours. Caspase3/7 activity was evaluated by Caspase-Glo 3/7 assay. (G) Immunoblotting of Myc, cleaved PARP (c-PARP), cleaved caspase3 (c-caspase 3) and p-H2Ax expression in GFP and Myc cells after treatment with Volasertib (0, 30, 100 nM) for 24 hours. Actin was used as a loading control.
Figure 6.
Figure 6.. Myc silencing desensitizes glioblastoma cells to PLK1 inhibitors.
(A) Gli36 cells stably transduced with a non-targeting (shNS) or tetracycline-regulatable cMyc shRNA (shRNA1, shRNA2) vectors were established. Cells were lysed after exposed to doxycycline (Dox) for 72 hours. Immunoblotting confirmed a decrease in Myc by shRNA2. Actin was used as a loading control. (B) Gli36-shNS (NS, blue), Gli36-MycshRNA1 (Myc shRNA1, red) and Gli36c-MycshRNA2 (Myc shRNA2, green) cells were treated with different concentrations of Volasertib (left) and GSK461364 (right). Cell viability was evaluated by CellTiter Glo at 72 hours. (C-E) Gli36-NS (NS) and Gli36-MycshRNA2 (Myc shRNA2) cells were treated with/without Volasertib at 30 nM for 24 hours and immunostained for pHH3 (red) and counterstained with DAPI. Scale bars, 100 μm. % cells with abnormal mitosis (mitotic catastrophe) (D) and pHH3 positive cells (E) were evaluated in at least 100 cells per experiment. (F) Immunoblot of pHH3 expression in Gli36-NS and Gli36-MycshRNA2 cells with/without Volasertib treatment (30 nM, 24 hours). Actin was used as a loading control. (G) Gli36NS (NS), Gli36-MycshRNA1 (Myc shRNA1) and Gli36-MycshRNA2 (Myc shRNA2) cells were treated with indicated concentrations of Volasertib for 24 hours. Caspase3/7 activity was evaluated by Caspase-Glo 3/7 assay. (H) Immunoblot of Myc, cleaved PARP (c-PARP), cleaved caspase3 (c-caspase3) and p-H2Ax expression in Gli36-NS (NS) and Gli36-MycshRNA2 (shRNA2) cells after treatment with Volasertib (0, 30 nM) for 24 hours. Actin blot was used as a loading control. In D, E and G, *, P<0.01; **, P<0.005; ***, P<0.001 (student t-test).

Similar articles

Cited by

References

    1. Wahl M, Phillips JJ, Molinaro AM, Lin Y, Perry A, Haas-Kogan DA, et al. Chemotherapy for adult low-grade gliomas: clinical outcomes by molecular subtype in a phase II study of adjuvant temozolomide. Neuro Oncol. 2017;19:242–51. - PMC - PubMed
    1. van den Bent MJ, Baumert B, Erridge SC, Vogelbaum MA, Nowak AK, Sanson M, et al. Interim results from the CATNON trial (EORTC study 26053–22054) of treatment with concurrent and adjuvant temozolomide for 1p/19q non-co-deleted anaplastic glioma: a phase 3, randomised, open-label intergroup study. Lancet. 2017;390:1645–53. - PMC - PubMed
    1. Stupp R, Mason WP, van den Bent MJ, Weller M, Fisher B, Taphoorn MJ, et al. Radiotherapy plus concomitant and adjuvant temozolomide for glioblastoma. The New England journal of medicine. 2005;352:987–96. - PubMed
    1. Stupp R, Hegi ME, Mason WP, van den Bent MJ, Taphoorn MJ, Janzer RC, et al. Effects of radiotherapy with concomitant and adjuvant temozolomide versus radiotherapy alone on survival in glioblastoma in a randomised phase III study: 5-year analysis of the EORTC-NCIC trial. The Lancet Oncology. 2009;10:459–66. - PubMed
    1. Comprehensive genomic characterization defines human glioblastoma genes and core pathways. Nature. 2008;455:1061–8. - PMC - PubMed

Publication types

MeSH terms