. 2018 Sep 14;9(1):3748.
doi: 10.1038/s41467-018-06145-w.

A conserved glycine harboring disease-associated mutations permits NMDA receptor slow deactivation and high Ca2+ permeability

Affiliations

A conserved glycine harboring disease-associated mutations permits NMDA receptor slow deactivation and high Ca2+ permeability

Johansen B Amin et al. Nat Commun. .

Abstract

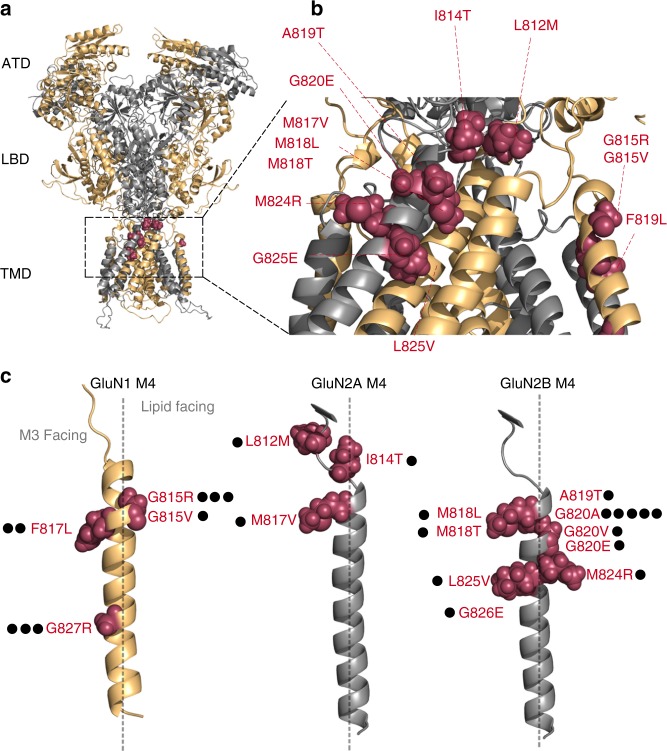
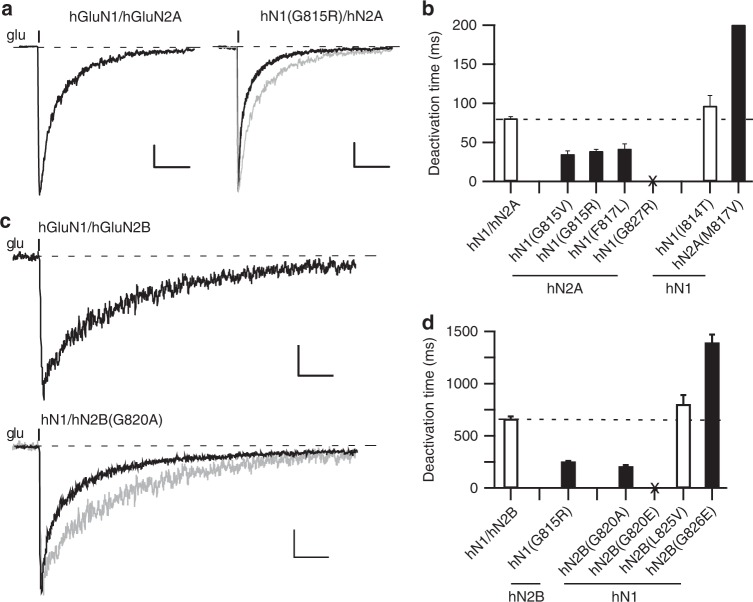
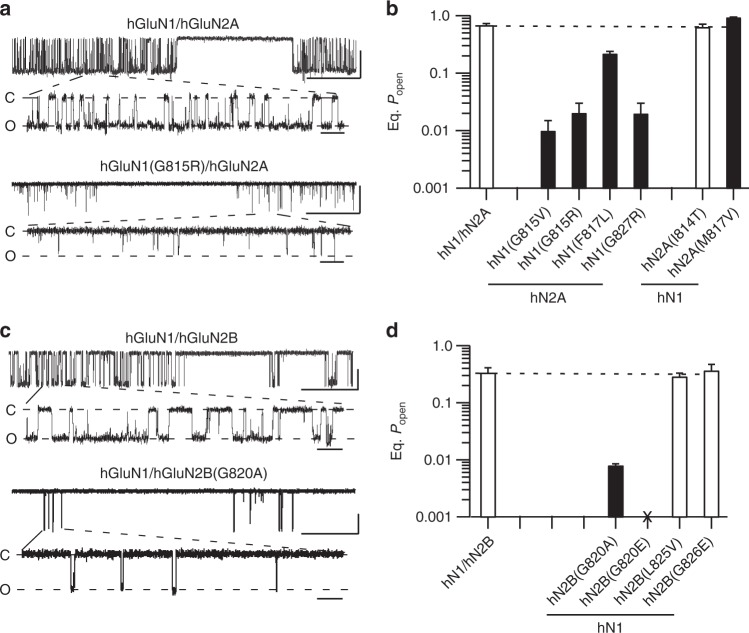
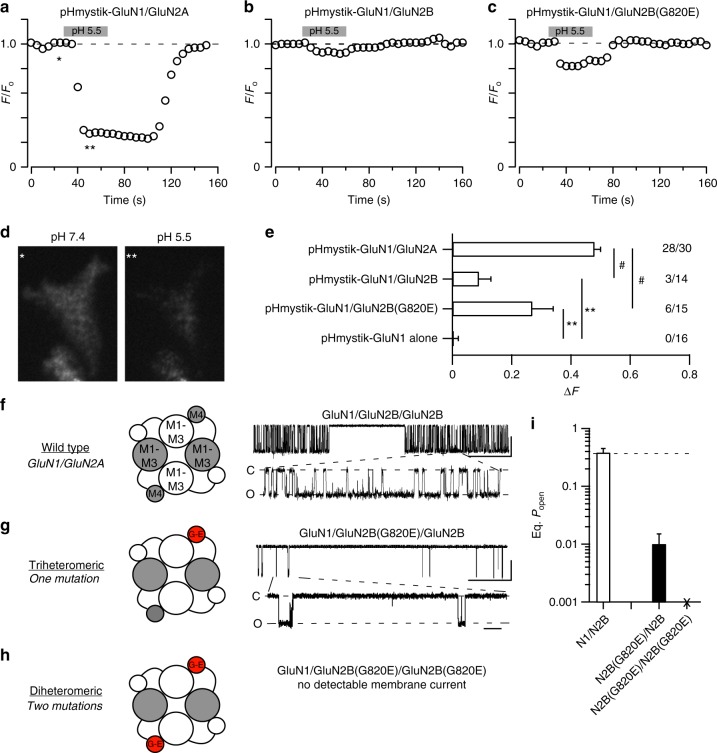
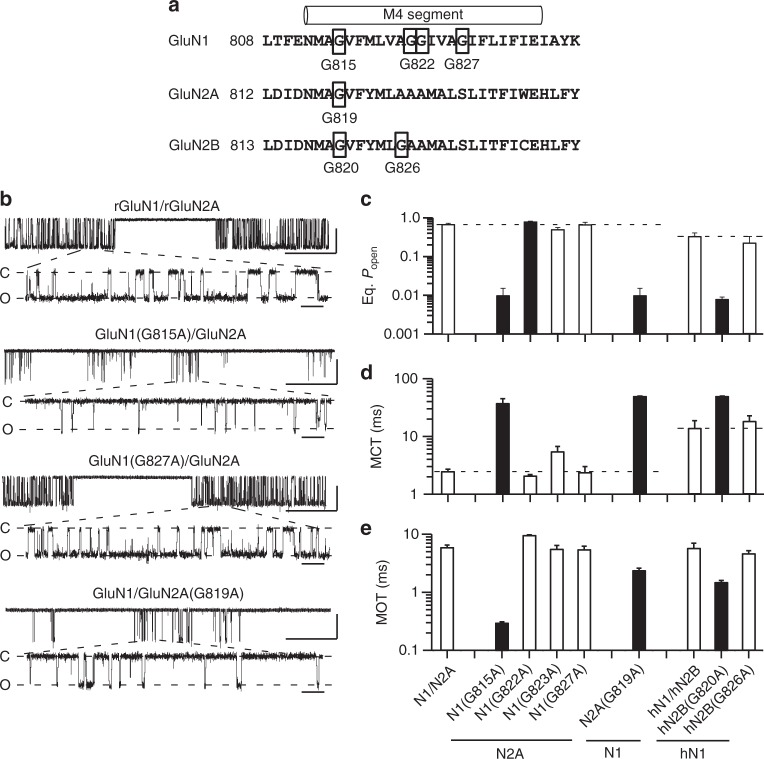
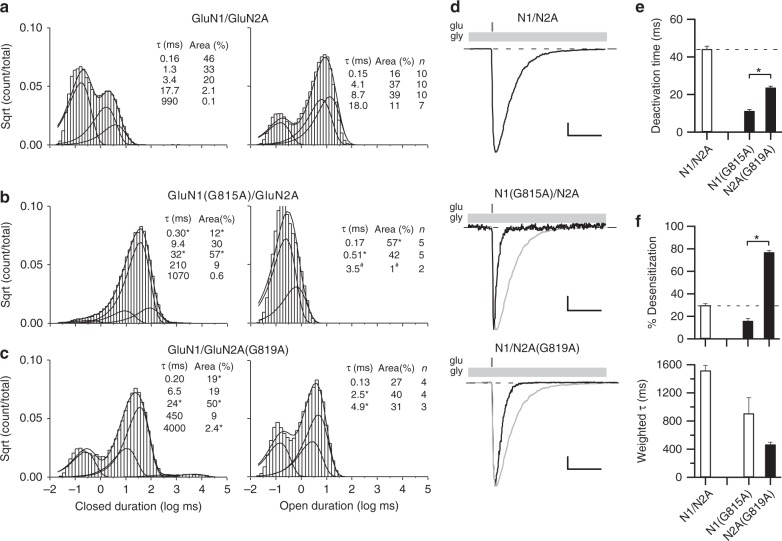
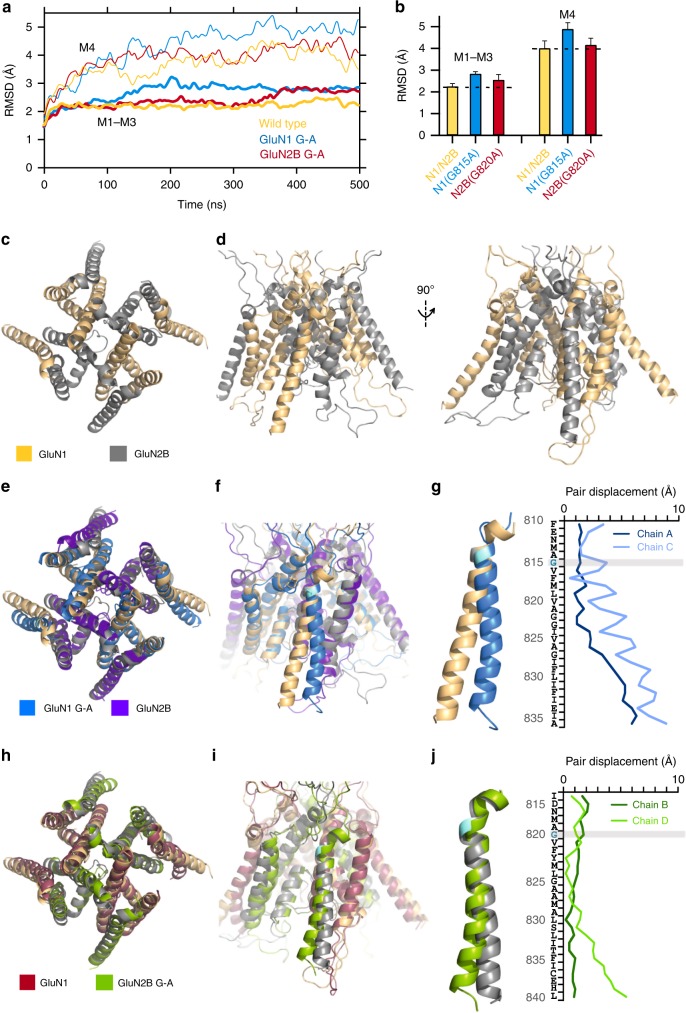
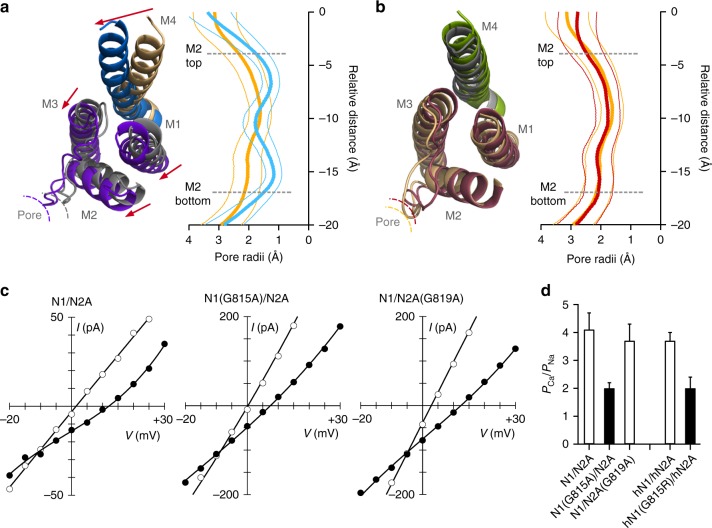
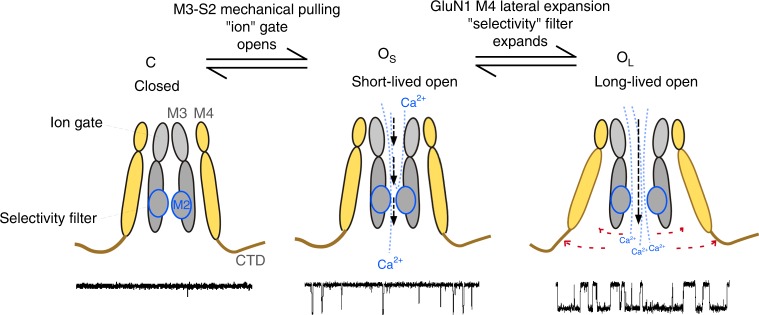
A variety of de novo and inherited missense mutations associated with neurological disorders are found in the NMDA receptor M4 transmembrane helices, which are peripheral to the pore domain in eukaryotic ionotropic glutamate receptors. Subsets of these mutations affect receptor gating with dramatic effects, including in one instance halting it, occurring at a conserved glycine near the extracellular end of M4. Functional experiments and molecular dynamic simulations of constructs with and without substitutions at this glycine indicate that it acts as a hinge, permitting the intracellular portion of the ion channel to laterally expand. This expansion stabilizes long-lived open states leading to slow deactivation and high Ca2+ permeability. Our studies provide a functional and structural framework for the effect of missense mutations on NMDARs at central synapses and highlight how the M4 segment may represent a pathway for intracellular modulation of NMDA receptor function.


Conflict of interest statement

The authors declare no competing interests.

Figures

Fig. 1
Fig. 1
Topology of NMDA receptors and distribution of missense mutations in and around the M4 transmembrane segments. a Model NMDAR structure (structure based on 4TLM of GluN1/GluN2B) lacking the intracellular C-terminal domain (CTD). Subunits are colored light orange (GluN1) and gray 60% (GluN2). For iGluRs, the tetrameric complex is composed of four highly modular domains: the extracellularly located amino-terminal (ATD) and ligand-binding (LBD) domains; the membrane-spanning transmembrane domain (TMD) forming the ion channel; and the CTD. Positions highlighted in magenta are disease-associated missense mutations in the GluN1, GluN2A, or GluN2B M4 transmembrane segment or the S2-M4 linker (L812M and I814T in GluN2A). b An enlarged view of the extracellular end of the TMD highlighting the distribution of missense mutations in and around the M4 segments. c The GluN1, GluN2A, and GluN2B M4 segments indicting the specific location of missense mutations. Each dot represents a patient in which the mutation has been identified (Supplementary Table 1). The dashed line separates M3 (leftside) versus lipid (rightside) facing portions of the M4 transmembrane segment
Fig. 2
Fig. 2
Missense mutations in M4 segments alter NMDAR gating. a, c Whole-cell currents from HEK293 cells expressing human NMDAR subunits, either hGluN1/hGluN2A (a) or hGluN1/GluN2B (c) or the same receptor with a missense mutation at the conserved glycine. Currents were elicited by a 2 ms application of glutamate (1 mM) in the continuous presence of glycine (0.1 mM), as approximately occurs at synapses. Gray traces are wild type. Holding potential, −70 mV. Scale bars: (a) 100 pA, wild type; 25 pA, hN1(G815R); (c) 50 pA; time base was 0.2 s for all. b, d Bar graphs (mean ± SEM) (n > 5) showing deactivation rates for hGluN1/hGluN2A (b) or hGluN1/hGluN2B (d) (Supplementary Table 2). No whole-cell current could be detected for hGluN1(G827R)/hGluN2A or hGluN1/hGluN2B(G820E), which were tested on at least three different transfection cycles (Supplementary Figure 2). Solid bars indicate values significantly different from wild type (p < 0.05, t-test)
Fig. 3
Fig. 3
Single channel recordings of missense mutations in M4 segments. a, c Example single channel recordings of hGluN1/hGluN2A (a) or hGluN1/hGluN2B (c) or the same receptor containing missense mutations at the conserved glycine. Recordings were performed in the on-cell configuration (holding potential, +100 mV). Downward deflections are inward currents. For each construct, the top half shows a low-resolution (filtered at 1 kHz) and the bottom half a higher resolution portion of same record (3 kHz). Scale bars: 5 pAs for all; time base is 500 ms (upper trace for each construct) and 20 ms (lower trace for each construct). b, d Equilibrium open probability (eq. Popen) (mean ± SEM) (n > 4 patches) for hGluN1/hGluN2A (b) or hGluN1/hGluN2B (d) (Supplementary Table 3). Solid bars indicate values significantly different from wild type (p < 0.05, t-test). For GluN1/GluN2B(G820E), we could not detect glutamate-activated current either in on-cell patches or whole-cell mode
Fig. 4
Fig. 4
The diheteromeric missense mutation of a conserved glycine is pore dead. ac Assaying surface expression using a pH-sensitive GFP indicates that GluN1/GluN2B(G820E) is expressed on the membrane. GFP intensity as the extracellular solution pH was changed from 7.4 to 5.5 (gray bar, 30 s) and back again. d Representative cell images are from the time-points labeled in a with asterisks. Image pH 7.4 (single asterisk) is baseline fluorescence (Fo), whereas image pH 5.5 (double asterisks) is test fluorescence (Ftest). The change in fluorescence (ΔF = FoFtest) was used as an index of surface expression. Sampling rate, 5 s. The strong fluorescent background for GluN2B constructs presumably reflects subunits trapped in endoplasmic reticulum. e Changes in cell fluorescence at low pH (ΔF). Significant differences from pHmystick-GluN1/GluN2A and pHmystik-GluN1 alone are indicated by # and **, respectively, (p < 0.05, t-test). The numbers (far right) indicate the number of cells that showed detectable changes in fluorescence relative to the total number of cells tested. fh Single channel recordings of NMDAR constructs containing the coiled-coiled domain in C-terminus, either wild type (f), the triheteromeric containing a single copy of G820E (g) or the diheteromeric containing 2 copies of G820E (h), which does not show detectable glutamate-activated current (Figs. 2 and 3), though it expresses on the membrane. The triheteromeric receptor shows detectable single channel activity. Scale bars: 5 pAs for all; time base is 500 ms (upper trace for each construct) and 20 ms (lower trace for each construct). i Mean ( ± SEM) showing eq. Popen for wild type (n = 4) and triheteromeric GluN1/GluN2B/GluN2B(G820E) (n = 3)
Fig. 5
Fig. 5
Alanine substitutions of glycine in the M4 segments reveal that the conserved glycine has a unique functional role in gating. a Sequence of M4 segments and adjacent regions highlighting glycines. b Example single channel recordings in the on-cell configuration of wild type rat GluN1/GluN2A and various receptors containing glycine-to-alanine substitutions. Recordings displayed as in Fig. 3a. Scale bars: 5 pAs for all; time base is 500 ms (upper trace for each construct) and 20 ms (lower trace for each construct). ce Mean ± SEM (n > 4 patches) showing equilibrium open probability (eq. Popen) (c), mean closed time (MCT) (d), and mean open time (MOT) (e) for alanine substitutions of glycines in the M4 segments of rat GluN1 and GluN2A and human GluN1 (hGluN1) and GluN2B (hGluN2B) (Supplementary Table 4). Solid bars indicate values significantly different from their respective wild types (p < 0.01, t-test)
Fig. 6
Fig. 6
Constraining the conserved glycine prevents entry into long-lived open states and speeds deactivation. ac Closed (left) and open (right) time histograms for wild type (a) or for receptors containing an alanine substitution at the conserved glycine in GluN1 (b) or GluN2A (c). All closed time histograms were best fit with 5 exponentials (Supplementary Table 5), whereas open time histograms were best fit typically with 4 (wild type), 2 (GluN1(G815A)), or 3 (GluN2A(G819A)) exponentials (Supplementary Table 6) (see Methods). Smooth lines are associated exponential fits. Insets, mean closed and open state durations (τ, ms), occupancies (α, %), and for open time distributions how many recordings contained that open time (Supplementary Tables 5 & 6). For GluN1(G815A), the longest-lived open state (3.5 ms) was identified in only 2 out of 5 recordings; # indicates that we did not do statistics on this state. d Whole-cell currents in response to a 2 ms application of glutamate (1 mM, gray bars) applied in the continuous presence of glycine (light gray bars). Recordings were made and analyzed as in Fig. 2a but included extracellular 0.05 mM EDTA to remove effects of Zn2+ as done for single channel recordings. Scale bars: 300 pA, wild type; 10 pA, N1(G815A); 100 pA, N2A(G819A); time base is 100 ms for all. e, f Mean ± SEM (n > 5) showing deactivation rates (e) or desensitization properties (f) for constructs shown in d. Solid bars indicate values significantly different from wild type, whereas asterisks indicate values different from each other (p < 0.05, ANOVA,Tukey)
Fig. 7
Fig. 7
MD simulations show that constraining the conserved glycine in GluN1 prevents C-terminal expansion of the M4 as observed in wild type. a Cα RMSDs of the ion channel cores (M1–M3, thick lines) and M4s (thin lines) as a function of simulation time for open state models: wild-type GluN1/GluN2B, light orange; GluN1(G815A)/GluN2B, light blue; GluN1/GluN2B(G820A), maroon (see Methods). b Average RMSD values (250–500 ns). Error bars are standard deviations. c, d Open state of wild-type GluN1/GluN2B TMD shown either top down (c) or side views (d) of the GluN1 (left) or GluN2B (right) M4s. All displayed structures are snapshots close to the average structures calculated over 250–500 ns. e, f GluN1(G815A) overlaid on wild type either from top down (e) or with a side view (f). g Displacements between GluN1(G815A) and wild type for M4 residues in the A and C subunits. h, i GluN2B(G820A) overlaid on wild type either from top down (h) or with a side view (i). j Displacements between GluN2B(G820A) and wild type for M4 residues in the B and D subunits
Fig. 8
Fig. 8
Constraining the conserved G in GluN1 reduces the dimensions of the selectivity filter and Ca2+ permeability. a Left, Cytoplasmic view of model open state structures of wild type and GluN1(G815A). The constrained M4 collapses the adjacent GluN2B ion channel core (M1–M3) including the pore size as defined by the M2 loop. Right, Average pore radius along the channel axis for the M2 pore loop for wild type (gold) and GluN1(G815A) (light blue). ’0’ references the serine (S) in SYTANLAAF in M3. Thick lines are mean values and thinner lines the error bars, which were calculated using block averages based on a time block of 20 ns. b Same as a except construct is GluN2B(G820A) (maroon), which resulted in a less displacement of the M2 loop. c Current-voltage (IV) relationships in an external solution containing high Na+ (140 mM) and 0 added Ca2+ (open circles) or 10 mM Ca2+ (solid circles). The 0 Ca2+ IV is the average of that recorded before and after the 10 mM Ca2+ recording. We used changes in reversal potentials (ΔErev) to calculate PCa/PNa. d Mean ± SEM showing relative calcium permeability (PCa/PNa) calculated from ΔErevs for rat GluN1/GluN2A (n = 7), GluN1(G815A) (n = 8), or GluN2A(G819A) (n = 7) as well as human GluN1/GluN2A (n = 11) and the missense mutation GluN1(G815R) (n = 7). Values either are not (open bars) or are (solids bars) significantly different from each other (p < 0.05, ANOVA, Tukey)
Fig. 9
Fig. 9
Expansion of the inner pore permitted mainly by the GluN1 M4 conserved glycine facilitates NMDAR gating and Ca2+ permeation. Cartoon of NMDAR pore structure, including the influence of the GluN1 M4 on open state stability and selectivity filter integrity. Subunits are colored light orange (GluN1) and gray (GluN2)

References

    1. Noebels J. Precision physiology and rescue of brain ion channel disorders. J. Gen. Physiol. 2017;149:533–546. doi: 10.1085/jgp.201711759. - DOI - PMC - PubMed
    1. Kowal C, et al. Human lupus autoantibodies against NMDA receptors mediate cognitive impairment. Proc. Natl Acad. Sci. USA. 2006;103:19854–19859. doi: 10.1073/pnas.0608397104. - DOI - PMC - PubMed
    1. Pleasure D. Diagnostic and pathogenic significance of glutamate receptor autoantibodies. Arch. Neurol. 2008;65:589–592. doi: 10.1001/archneur.65.5.589. - DOI - PMC - PubMed
    1. Burnashev N, Szepetowski P. NMDA receptor subunit mutations in neurodevelopmental disorders. Curr. Opin. Pharmacol. 2015;20:73–82. doi: 10.1016/j.coph.2014.11.008. - DOI - PubMed
    1. Yuan H, Low CM, Moody OA, Jenkins A, Traynelis SF. Ionotropic GABA and glutamate receptor mutations and human neurologic diseases. Mol. Pharmacol. 2015;88:203–217. doi: 10.1124/mol.115.097998. - DOI - PMC - PubMed

Publication types

MeSH terms