

Metabolomic Profile Predicts Development of Microalbuminuria in Individuals with Type 1 Diabetes
- PMID: 30217994
- PMCID: PMC6138633
- DOI: 10.1038/s41598-018-32085-y
Metabolomic Profile Predicts Development of Microalbuminuria in Individuals with Type 1 Diabetes
Abstract
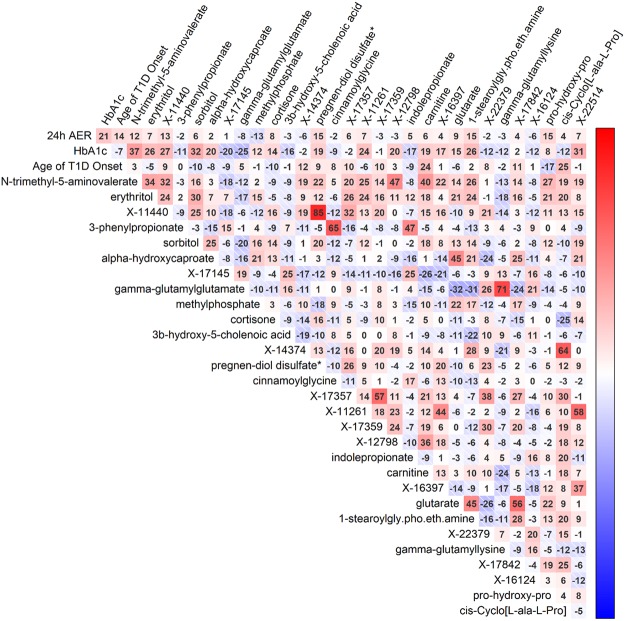
Elevated urinary albumin excretion (microalbuminuria) is an early marker of diabetic nephropathy, but there is an unmet need for better biomarkers that capture the individuals at risk with higher accuracy and earlier than the current markers do. We performed an untargeted metabolomic study to assess baseline differences between individuals with type 1 diabetes who either developed microalbuminuria or remained normoalbuminuric. A total of 102 individuals progressed to microalbuminuria during a median follow-up of 3.2 years, whereas 98 sex-, age- and body mass index (BMI) matched non-progressors remained normoalbuminuric during a median follow-up of 7.1 years. Metabolomic screening identified 1,242 metabolites, out of which 111 differed significantly between progressors and non-progressors after adjustment for age of diabetes onset, baseline glycosylated hemoglobin A1c (HbA1c), and albumin excretion rate (AER). The metabolites that predicted development of microalbumiuria included several uremic toxins and carnitine metabolism related molecules. Iterative variable selection indicated erythritol, 3-phenylpropionate, and N-trimethyl-5-aminovalerate as the best set of variables to predict development of microalbuminuria. A metabolomic index based on these metabolites improved the prediction of incident microalbuminuria on top of the clinical variables age of diabetes onset, baseline HbA1c and AER (ROCAUC = 0.842 vs 0.797), highlighting their ability to predict early-phase diabetic nephropathy.
Conflict of interest statement
P.-H.G. has served on advisory boards for AbbVie, AstraZeneca, Boehringer Ingelheim, Cebix, Eli Lilly, Janssen, Medscape, MSD, Novartis, Novo Nordisk, Sanofi, and has received lecture honoraria from AstraZeneca, Boehringer Ingelheim, Eli Lilly, Elo Water, Genzyme, Medscape, MSD, Novartis, Novo Nordisk and Sanofi. P.-H. G. has also received investigator-initiated grants from Eli Lilly and Roche. E.F. has served on advisory boards for MSD, Boehringer Ingelheim, Sanofi, and has received lecture honoraria from AstraZeneca, Boehringer Ingelheim, Sanofi, Novo Nordisk and Mitsubishi-Tanabe. E.F. has received investigator-initiated funding from Boehringer Ingelheim and Eli Lilly. J.E.C. is a former employee of Metabolon, Inc., Durham, NC.
Figures


References
Publication types
MeSH terms
LinkOut - more resources
Full Text Sources
Other Literature Sources
Medical
Miscellaneous
