. 2018 Sep 14;8(1):13863.
doi: 10.1038/s41598-018-32207-6.

Evaluation of two-point Dixon water-fat separation for liver specific contrast-enhanced assessment of liver maximum capacity

Affiliations

Evaluation of two-point Dixon water-fat separation for liver specific contrast-enhanced assessment of liver maximum capacity

Michael Haimerl et al. Sci Rep. .

Abstract

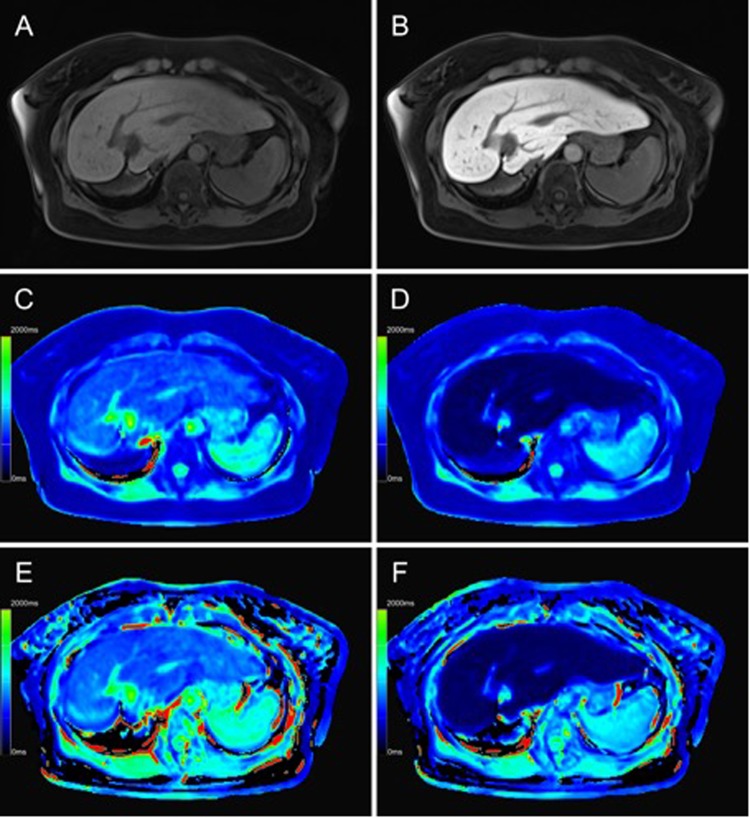
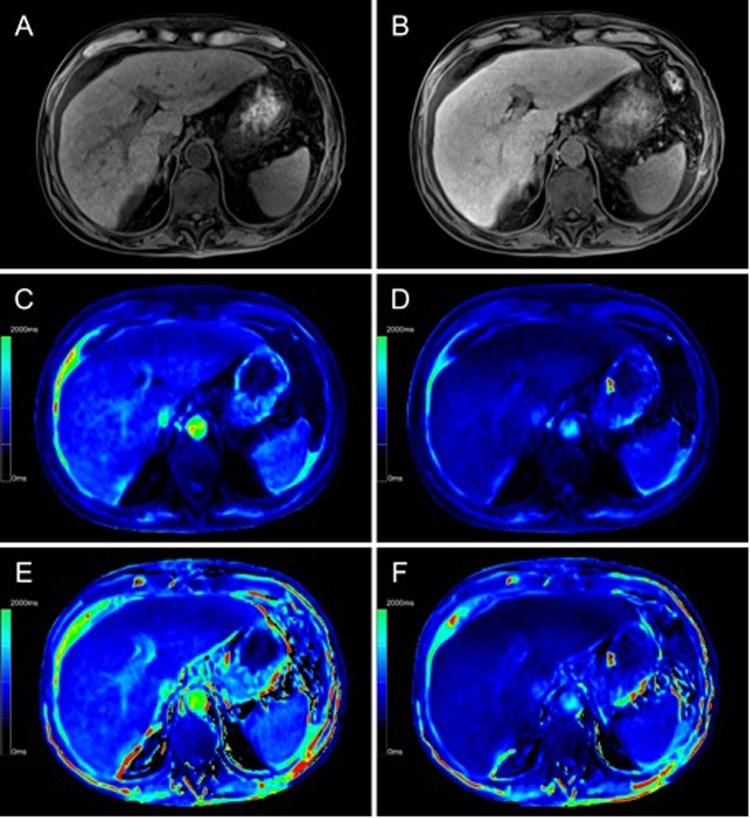
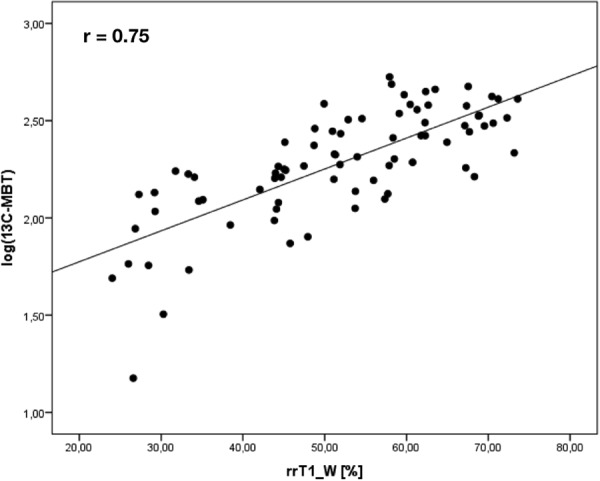
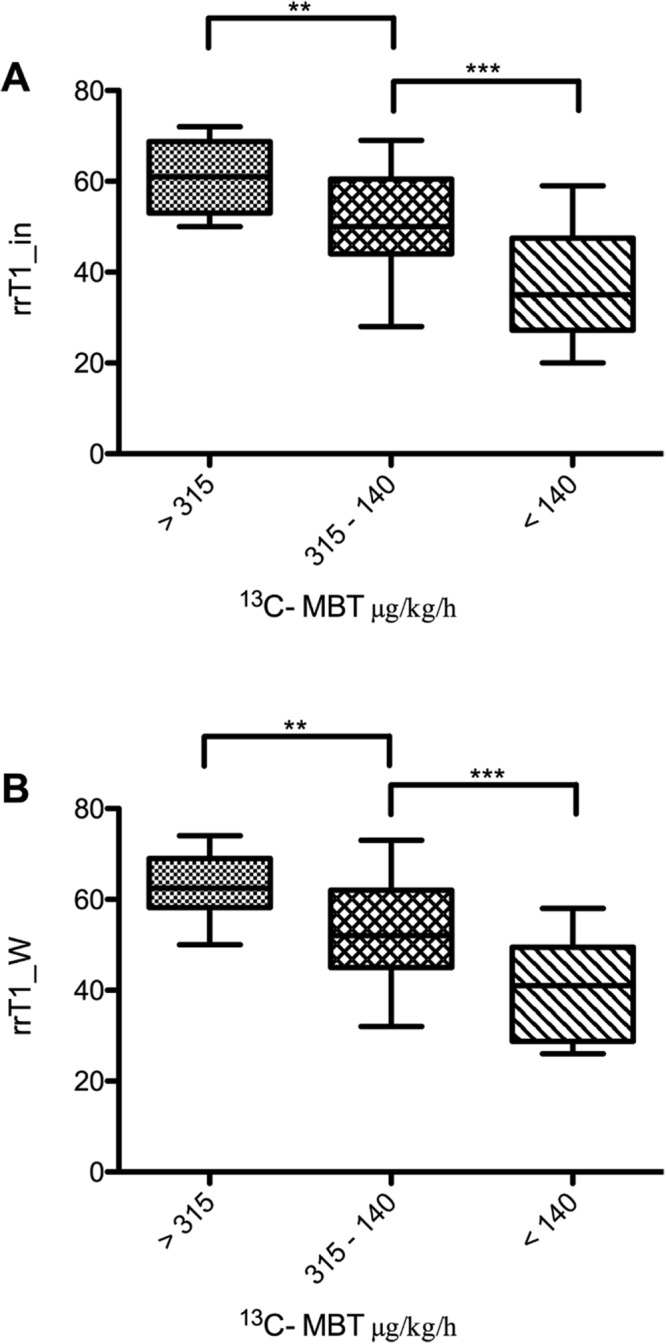
Gadoxetic acid-enhanced magnetic resonance imaging has become a useful tool for quantitative evaluation of liver capacity. We report on the importance of intrahepatic fat on gadoxetic acid-supported T1 mapping for estimation of liver maximum capacity, assessed by the realtime 13C-methacetin breathing test (13C-MBT). For T1 relaxometry, we used a respective T1-weighted sequence with two-point Dixon water-fat separation and various flip angles. Both T1 maps of the in-phase component without fat separation (T1_in) and T1 maps merely based on the water component (T1_W) were generated, and respective reduction rates of the T1 relaxation time (rrT1) were evaluated. A steady considerable decline in rrT1 with progressive reduction of liver function could be observed for both T1_in and T1_W (p < 0.001). When patients were subdivided into 3 different categories of 13C-MBT readouts, the groups could be significantly differentiated by their rrT1_in and rrT1_W values (p < 0.005). In a simple correlation model of 13C-MBT values with T1_inpost (r = 0.556; p < 0.001), T1_Wpost (r = 0.557; p < 0.001), rrT1_in (r = 0.711; p < 0.001) and rrT1_W (r = 0.751; p < 0.001), a log-linear correlation has been shown. Liver maximum capacity measured with 13C-MBT can be determined more precisely from gadoxetic acid-supported T1 mapping when intrahepatic fat is taken into account. Here, T1_W maps are shown to be significantly superior to T1_in maps without separation of fat.


Conflict of interest statement

The authors declare no competing interests.

Figures

Figure 1
Figure 1
Color-coded T1 maps and T1-weighted sequence based on a 3D variable flip angle sequence of the liver parenchyma of a 47-year-old female patient with regular liver capacity (13C-MBT = 327 [µg/kg/h]). T1-weighted VIBE sequence with frequency-selective fat saturation (A,B) and T1 maps (CF) were generated in native (A,C,E) and hepatobiliary phase (B,D,F). Respective T1-shortening effect can be observed as an increase in signal intensity of the liver in a T1-weighted VIBE sequence (B) and as a dark-blue region in color-coded T1 maps, representing a decreased relaxation time (D,F). Fat-water separation was applied according to the Dixon technique for the T1 maps (E,F). When applying fat suppression on T1 maps (E,F), the overall registered relaxation time increased compared with that of T1 maps without fat separation (C,D). The background of the T1 maps was manually set to black to facilitate color visualization.
Figure 2
Figure 2
Color-coded T1 maps and T1-weighted sequence based on a 3D variable flip angle sequence of the liver parenchyma of a 63-year-old male patient with severe reduced liver capacity (13C-MBT = 135 [µg/kg/h]). T1-weighted VIBE sequence with frequency selective fat saturation (A,B) and T1 maps (C–F) were generated in native (A,C,E) and hepatobiliary phase (B,D,F). RespectiveT1-shortening effect can be observed as an increase in signal intensity of the liver in a T1-weighted VIBE sequence (B) and as a dark-blue region in color-coded T1 maps, representing a decreased relaxation time (D,F). Fat-water separation was applied according to the Dixon technique for the T1 maps (E,F). When applying fat suppression on T1 maps (E,F), the overall registered relaxation time increased compared with that of T1 maps without fat separation (C,D). The background of the T1 maps was manually set to black to facilitate color visualization.
Figure 3
Figure 3
Correlation analysis of rrT1_in on logarithmic values of 13C-MBT readout (13C-MBT). Scatterplot of the reduction rate of T1 relaxation time in non-fat-saturated T1 maps (rrT1_in) in logarithmic values of 13C-MBT readouts.
Figure 4
Figure 4
Correlation analysis of rrT1_W on logarithmic values of 13C-MBT readout (13C-MBT). Scatterplot of the reduction rate of T1 relaxation time in fat-saturated water-only T1 maps (rrT1_W), in logarithmic values of 13C-MBT readouts.
Figure 5
Figure 5
Reduction rates of T1 relaxation time by 13C-MBT readouts in T1 maps without fat separation (rrT1_in; A) and water-only T1 maps with fat separation (T1_W; B). The difference in reduction rates of the T1 relaxation time is statistically significant between the first and third groups in T1 maps without fat separation (A: p < 0.001) as well as in T1 maps with fat separation (B: p < 0.001). The difference is also statistically significant from that of the second group, either in T1 maps without fat separation (A: p = 0.003) or water-only T1 maps (B: p = 0.002). Group two differs significantly from group three in T1 maps without fat separation (A: p < 0.001) and T1 maps with fat separation (B: p < 0.001). group 1 13C-MBT >315 [µg/kg/h]: normal liver capacity. group 2 13C-MBT 315-140 [µg/kg/h]: intermediate liver capacity. group 3 13C-MBT <140 [µg/kg/h]: severe impaired liver capacity. Data are shown as the mean T1 reduction rates ± standard deviation. **p < 0.01, ***p < 0.001.

References

    1. Thapa BR, Walia A. Liver Function Tests and their Interpretation. Indian J Pediatr. 2007;74:663–671. doi: 10.1007/s12098-007-0118-7. - DOI - PubMed
    1. Ding Y, Rao SX, Chen C, Li R, Zeng MS. Assessing liver function in patients with HBV-related HCC: a comparison of T(1) mapping on Gd-EOB-DTPA-enhanced MR imaging with DWI. Eur Radiol. 2015;25:1392–1398. doi: 10.1007/s00330-014-3542-x. - DOI - PubMed
    1. Haimerl M, et al. Assessment of clinical signs of liver cirrhosis using T1 mapping on Gd-EOB-DTPA-enhanced 3T MRI. PloS One. 2013;8:e85658. doi: 10.1371/journal.pone.0085658. - DOI - PMC - PubMed
    1. Haimerl M, et al. Gd-EOB-DTPA-enhanced MRI for evaluation of liver function: Comparison between signal-intensity-based indices and T1 relaxometry. Sci Rep. 2017;7:43347. doi: 10.1038/srep43347. - DOI - PMC - PubMed
    1. Kamimura K, et al. Quantitative evaluation of liver function with T1 relaxation time index on Gd-EOB-DTPA-enhanced MRI: Comparison with signal intensity-based indices. J Magn Reson Imaging. 2014;40:884–889. doi: 10.1002/jmri.24443. - DOI - PubMed