. 2018 Sep 14;8(1):13838.
doi: 10.1038/s41598-018-32197-5.

Cells with stemness features are generated from in vitro transformed human fibroblasts

Affiliations

Cells with stemness features are generated from in vitro transformed human fibroblasts

Bartolo Bono et al. Sci Rep. .

Abstract

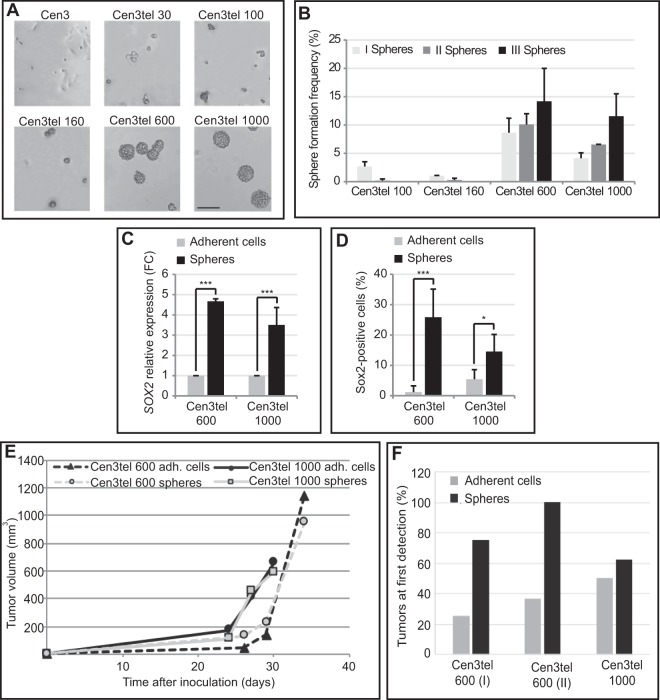
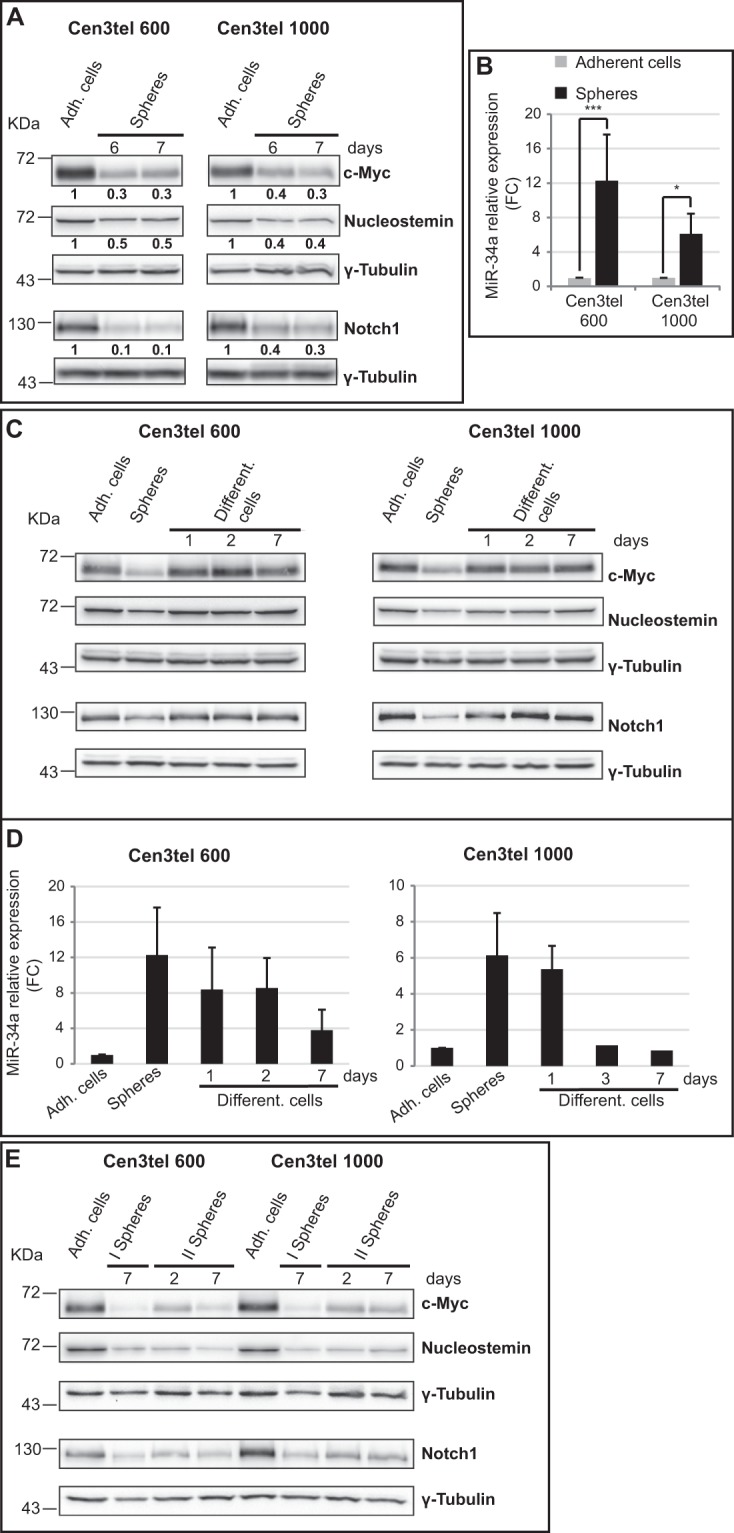
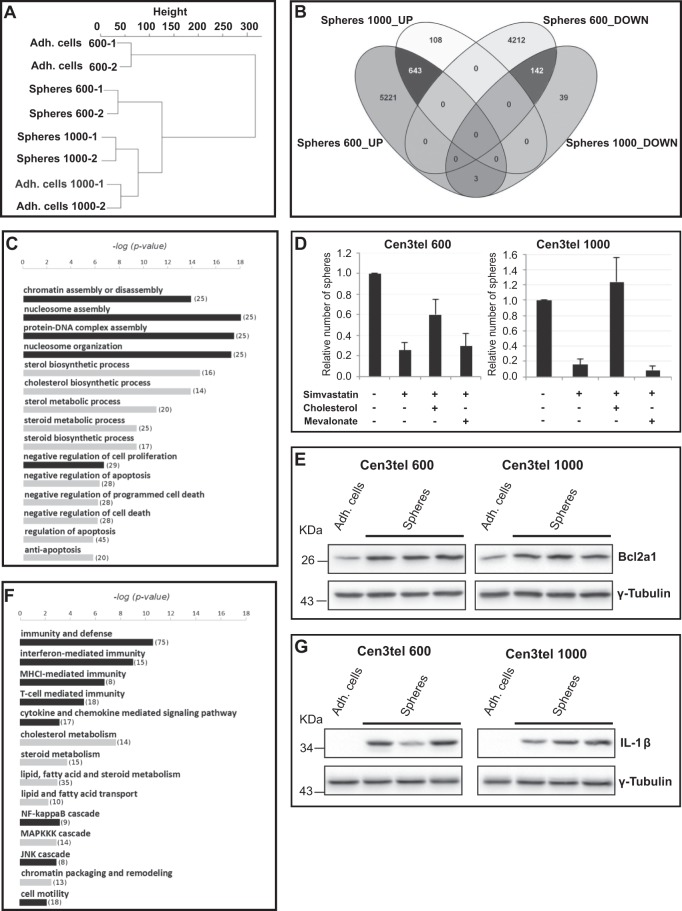
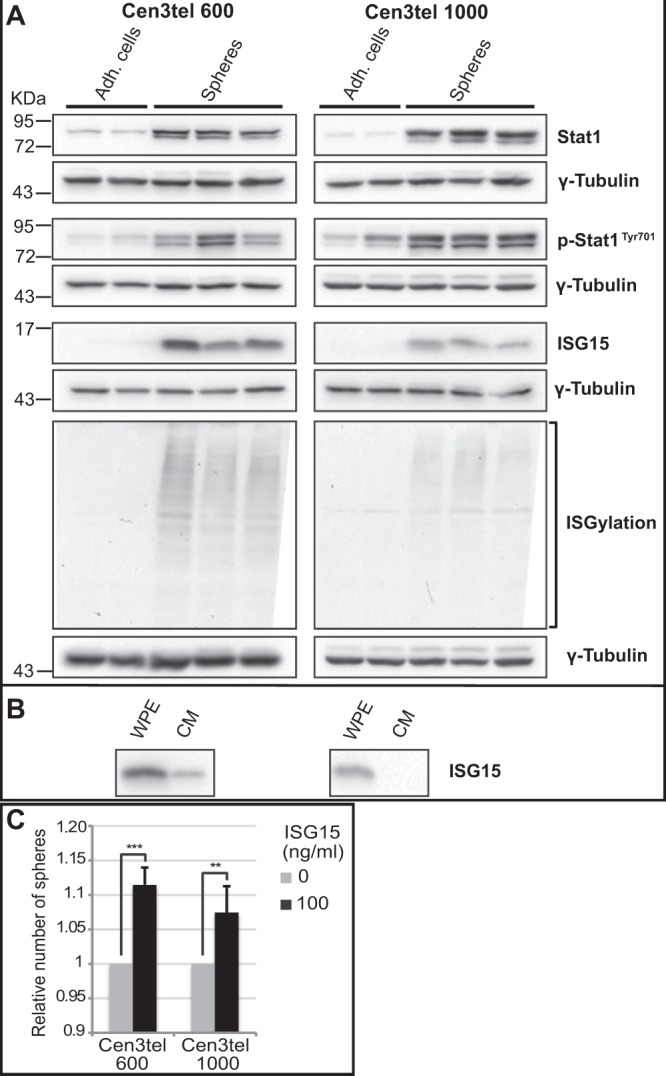
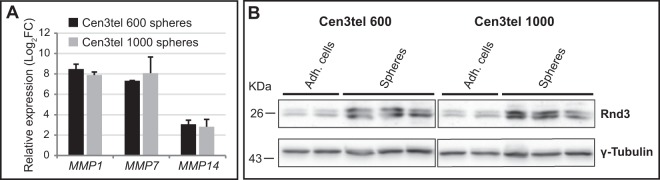
Cancer stem cells (CSCs) have been involved in the maintenance, progression and relapse of several tumors, but their origin is still elusive. Here, in vitro transformed human fibroblasts (cen3tel cells) and the tumorsphere assay were used to search for and possibly characterize CSCs in transformed somatic cells. Cen3tel cells formed spheres showing self-renewal capacity and Sox2 overexpression, suggesting that they contained a subset of cells with CSC-like features. Sphere cells displayed deregulation of a c-MYC/miR-34a circuitry, likely associated with cell protection from apoptosis. Gene expression profiles of sphere cells revealed an extensive transcriptional reprogramming. Genes up-regulated in tumorspheres identified processes related to tumorigenesis and stemness, as cholesterol biosynthesis, apoptosis suppression, interferon and cytokine mediated signalling pathways. Sphere cells engrafted into NSG mice more rapidly than adherent cells, but both cell populations were tumorigenic. These results indicate that, during transformation, human somatic cells can acquire CSC properties, confirming the high plasticity of tumor cells. However, CSC-like cells are not the only tumorigenic population in transformed cells, indicating that the CSC phenotype and tumorigenicity can be uncoupled.


Conflict of interest statement

The authors declare no competing interests.

Figures

Figure 1
Figure 1
(A) Morphology of cen3 primary fibroblasts and cen3tel cells at different stages of propagation (around PDs 30, 100, 160, 600 and 1000) plated in non-adherent culture conditions, in serum free medium supplemented with EGF and FGFb. Cells grown for 7 days in sphere-forming conditions are shown in the pictures taken with a 10X objective. Bars = 200 µm. (B) Frequencies of primary, secondary and tertiary spheres from cen3tel cells at different PDs. Frequencies of cen3tel cells at PD 100 and 160 were measured 14 days after cell seeding, while those of cen3tel cells at PD 600 and PD 1000 after 7 days. Mean and standard deviation (error bars) values were calculated from three independent experiments. (C) RT-qPCR analysis of SOX2 expression in cen3tel 600 and 1000 sphere cells. SOX2 expression in each sphere sample is expressed as fold change (FC) relative to the expression in the corresponding adherent cells. The plot shows the average (FC) of three independent experiments. (D) Cytofluorimetric analysis of Sox2 expression showing the percentage of Sox2 positive cells in cen3tel 600 and 1000 sphere cells and adherent cells. Values are the average of the results of three independent experiments. Error bars: standard deviations. ***p < 0.005, *p < 0.05. (E,F) Tumor induction by adherent and sphere cells in NSG mice. (E) Tumor growth; (F) percentage of tumors found at the first time of detection (26 days for cen3tel 600 cells and 21 days for cen3tel 1000. Cen3tel 600 (I), first experiment, 4 inoculi; cen3tel 600 (II), second experiment, 8 inoculi; cen3tel 1000, 8 inoculi).
Figure 2
Figure 2
c-Myc, Nucleostemin, Notch1 and miR-34a expression in cen3tel 600 and 1000 sphere cells. Sphere cells were collected at 6 or 7 days of growth in serum free medium and the expression levels of c-Myc, Nucleostemin and Notch1 (A) were analyzed by western blotting; miR-34a expression (B) was analyzed in 6 day sphere by RT-qPCR. (A) For each protein, the relative intensity of the band in each sphere sample respect to the corresponding adherent cells is reported in bold below the corresponding lane. (B) MiR-34a expression in each sphere sample is indicated as FC relative to the expression in the corresponding adherent cells. Values are the mean of the results of three independent experiments. Error bars: standard deviations. *p < 0.05, ***p < 0.005 (C) Analysis by western blotting of c-Myc, Nucleostemin and Notch1 expression and (D) of miR-34a by RT-qPCR in sphere cells allowed differentiating in serum containing medium for different time intervals (indicated as Different. cells). In (D) miR-34a expression levels in sphere cells are indicated as FC relative to the corresponding adherent cells and are the mean of the results of three independent experiments. Error bars: standard deviations. (E) Analyisis of c-Myc, Nucleostemin and Notch1 expression in cen3tel 600 and 1000 primary spheres (I Spheres) and secondary spheres (II Spheres) at different days of growth in sphere-forming medium. Secondary spheres were obtained by re-plating I sphere cells in sphere-growing medium. For all the western blots, γ-Tubulin was used as control for protein loading.
Figure 3
Figure 3
Western blot analysis of apoptotic markers in cen3tel 600 and 1000 sphere and adherent cells. Antibodies recognizing the cleaved active forms of caspases 9 and 3 (A) were used, as well as an antibody recognizing both the full-length and the apoptotic cleaved fragment of PARP-1 and an antibody anti-poly ADP ribose (PAR) (B). As apoptosis control, adherent cen3tel cells treated with 100 μM etoposide for 24 hours were used. γ-Tubulin was used as loading control.
Figure 4
Figure 4
Results and validation of the genome-wide microarray gene expression analysis in cen3tel 600 and 1000 adherent and sphere cells. (A) Global gene expression profiling of cen3tel 600 and 1000 adherent and sphere cells. Dendrogram represents the relationship of similarity among the global gene expression profiles of cen3tel 600 and 1000 adherent and sphere cells. The tree diagram was obtained from unsupervised hierarchical clustering using Euclidean distance as similarity metrics and Ward linkage as linkage method. For each cell sample, the two biological replicates are shown. (B) Venn diagram representing the genes up- and down-regulated in cen3tel 600 and 1000 sphere cells relatively to their corresponding adherent cells. The black intersections represent the genes commonly deregulated in the two sphere samples. (C) GO enrichment analysis by David on the list of the commonly up-regulated genes in cen3tel 600 and 1000 sphere cells. The 15 biological processes with the most significant p-value are represented, terms belonging to the same biological items are clustered and indicated with the same color. Within brackets, the number of deregulated genes falling in each biological process is reported. (D) Sphere formation in cen3tel 600 and 1000 cells after inhibition of the cholesterol metabolism gene HMGCR with simvastatin. Cells were plated in sphere forming medium in the presence of simvastatin alone, simvastatin and cholesterol or simvastatin and mevalonate. The number of spheres in exposed cells is relative to that found in untreated cells (E) Western blot analysis of Bcl2a1 expression in cen3tel 600 and 1000 adherent and sphere cells. (F) GO enrichment analysis using the classification implemented by Panther annotation tool within David on the list of the commonly up-regulated genes in cen3tel 600 and 1000 sphere cells. The 14 biological processes with p-value < 0.01 are represented as described above. (G) Western blot analysis of IL1-β expression in cen3tel 600 and 1000 adherent and sphere cells. For all the western blot, γ-Tubulin was used as loading control.
Figure 5
Figure 5
Expression of interferon-related genes in cen3tel 600 and 1000 spheres. (A) Western blot analysis of the expression of Stat1, phospho-Stat1, ISG15 and ISGylated proteins in cen3tel 600 and 1000 sphere cells and adherent cells. Phospho-Stat1Tyr701 is the active form of the transcription factor Stat1. γ-Tubulin was used as loading control. (B) Analysis of the secretion of ISG15 in the culture medium (CM) of cen3tel 600 and 1000 sphere cells. The CM was processed as described in Materials and Methods and analyzed by western blotting with an antibody against ISG15; in the lane of the left, a sample of whole-protein extract (WPE) from sphere cells was loaded as positive control. (C) Secreted ISG15 fosters sphere formation in cen3tel 600 and 1000 cells.
Figure 6
Figure 6
MMP1, MMP7, MMP14 and RND3 expression in cen3tel 600 and 1000 sphere cells. (A) Expression of MMP1, MMP7, MMP14 by RT-qPCR. In the plots, the expression of each gene in sphere cells is indicated as Log2FC relative to its expression in the corresponding adherent cells. Error bars: standard deviations. (B) Evaluation of Rnd3 expression levels in cen3tel 600 and 1000 adherent and sphere cells by western blot analysis. γ-Tubulin expression was used as loading control.

References

    1. Alizadeh AA, et al. Toward understanding and exploiting tumor heterogeneity. Nat Med. 2015;21:846–853. doi: 10.1038/nm.3915. - DOI - PMC - PubMed
    1. Shibue T, Weinberg RA. EMT, CSCs, and drug resistance: the mechanistic link and clinical implications. Nat Rev Clin Oncol. 2017;14:1–19. doi: 10.1038/nrclinonc.2017.44. - DOI - PMC - PubMed
    1. Prasetyanti PR, Medema JP. Intra-tumor heterogeneity from a cancer stem cell perspective. Mol Cancer. 2017;16:41. doi: 10.1186/s12943-017-0600-4. - DOI - PMC - PubMed
    1. Li Y, Laterra J. Cancer Stem Cells: Distinct Entities or Dynamically Regulated Phenotypes? Cancer Res. 2012;72:576–580. doi: 10.1158/0008-5472.CAN-11-3070. - DOI - PMC - PubMed
    1. Scaffidi P, Misteli T. In vitro generation of human cells with cancer stem cell properties. Nat Cell Biol. 2011;13:1051–1061. doi: 10.1038/ncb2308. - DOI - PMC - PubMed

Publication types

Substances