. 2018 Sep 14;8(1):13793.
doi: 10.1038/s41598-018-32227-2.

Skeletal Muscle Dystrophy mutant of lamin A alters the structure and dynamics of the Ig fold domain

Affiliations

Skeletal Muscle Dystrophy mutant of lamin A alters the structure and dynamics of the Ig fold domain

Subarna Dutta et al. Sci Rep. .

Abstract

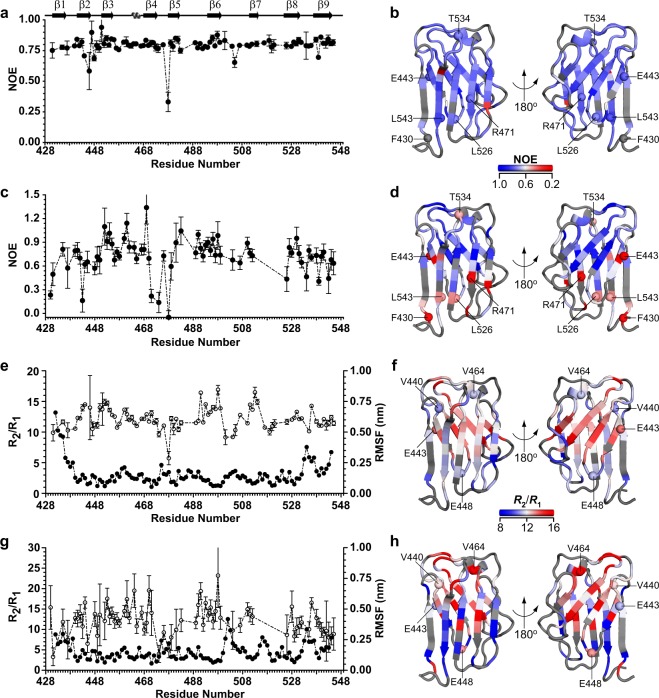
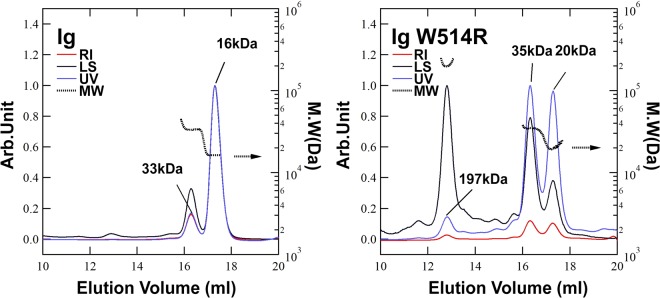
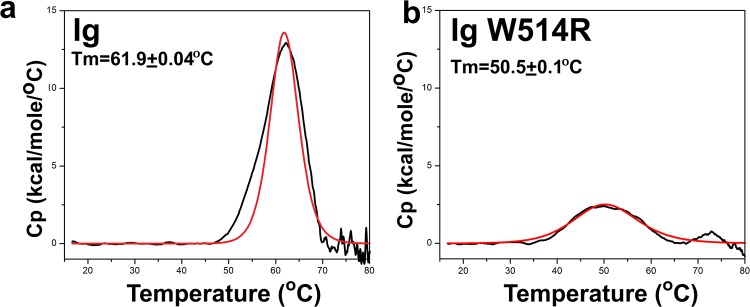
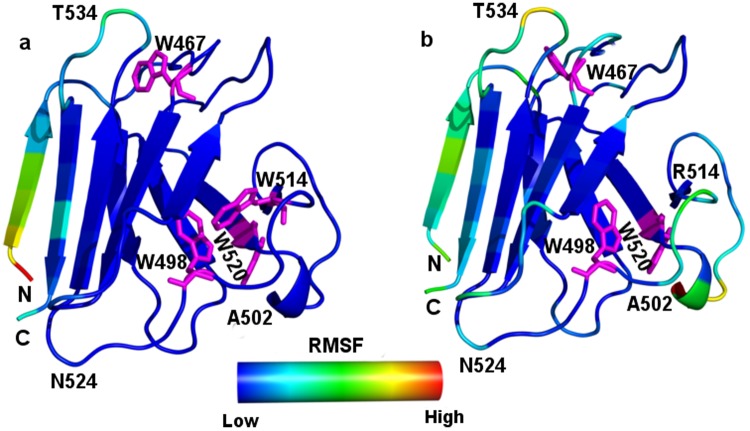
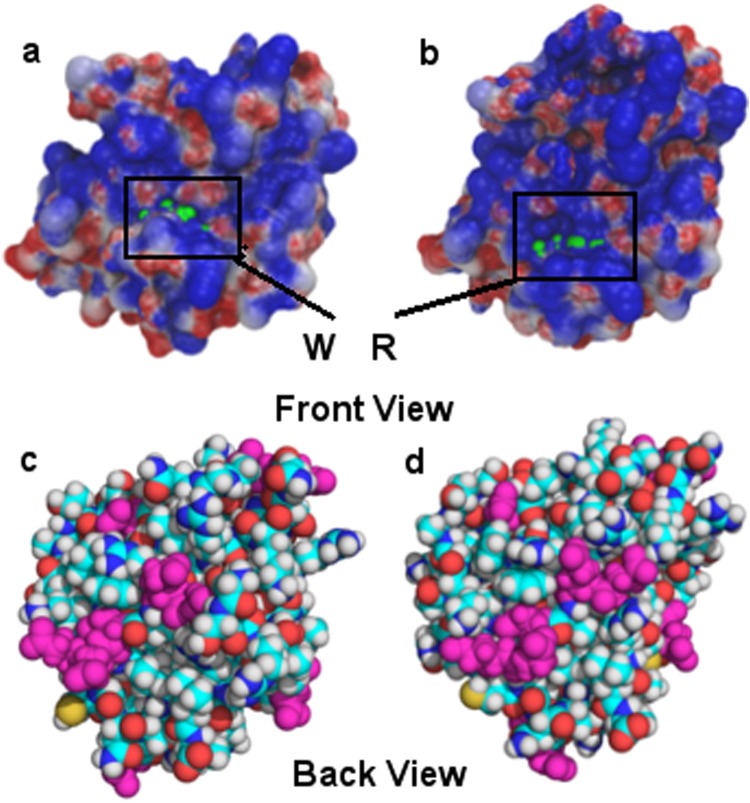
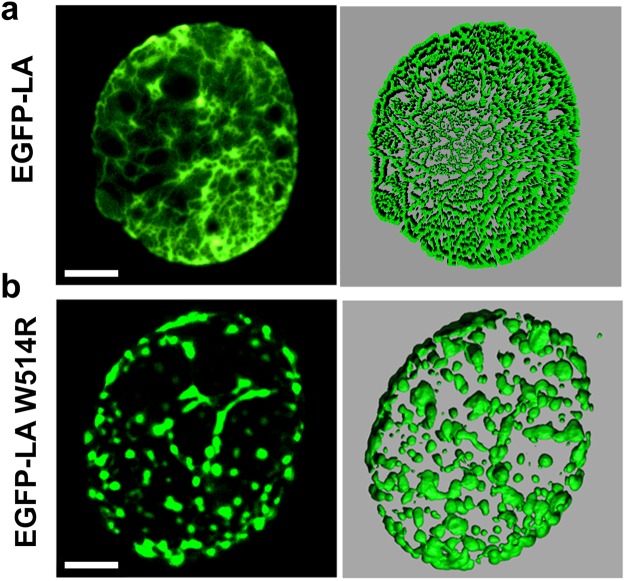
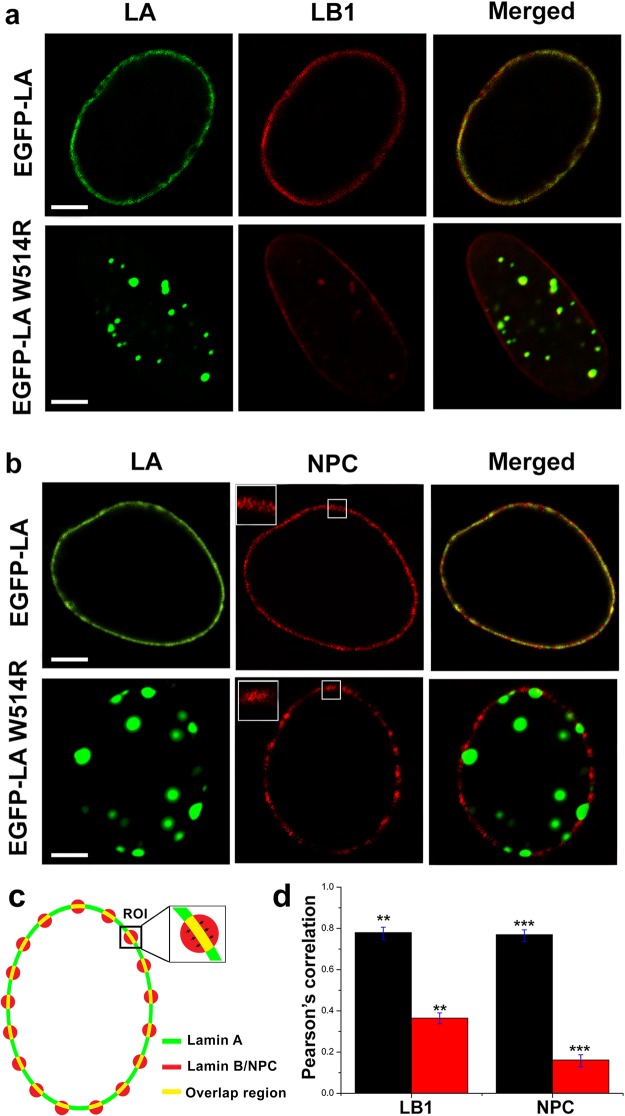
Mutations in the different domains of A-type lamin proteins cause a diverse plethora of diseases collectively termed as laminopathies which can affect multiple organs. Ig fold is one such domain of lamin A which is implicated in numerous nuclear interactions wherein the mutations lead to different laminopathies. W514R is one such mutation in the Ig fold which leads to severe phenotypes in Skeletal Muscle Dystrophy (SMD) which is a class of laminopathies. In this report, we elucidated gross alterations in structure and dynamics at the level of individual amino acids. These studies indicate altered conformational features of residues in the close vicinity of W514. Imaging of mammalian cells transfected with the mutant have shown distinct perturbation of the nuclear meshwork with concomitant alteration in nuclear interactions as a result of increased oligomerization of Ig W514R. Hence, this novel approach of amalgamating theoretical and experimental procedures to predict the severity of a mutant in the context of laminopathies could be extended for numerous lamin A mutants.


Conflict of interest statement

The authors declare no competing interests.

Figures

Figure 1
Figure 1
Overexpression profile of Ig proteins: (a) Over expressed Ig and Ig W514R purified to near homogeneity have been analysed on 4–20% gradient gel in the top panel. The bottom panel shows characterization of the proteins by anti-His antibody. The strips shown in the gel/blot are cropped from the original gels/blot as shown in Supplementary Fig. S7.
Figure 2
Figure 2
Ig W514R alters the secondary and tertiary structure: (a) Far UV CD spectra of Ig (black)and Ig W514R (red) at 25 °C. (b) Steady state fluorescence emission spectra (λex = 295 nm) of Ig (black) and Ig W514R (red). (c)Fluorescence anisotropy values of Ig and Ig W514R are plotted as bar graphs incorporating the standard errors. Fluorescence anisotropy values of Ig and Ig W514R are plotted as bar graphs incorporating the standard errors.
Figure 3
Figure 3
15N-1H HSQC spectra of Ig fold domain, wild type (black) and mutant W514R (Red), acquired at 14.2 T external magnetic field with the backbone resonance assignments.
Figure 4
Figure 4
NMR chemical shift comparison between wild type Ig and mutant Ig W514R: (a) Residue specific plot of amide chemical shift changes between the wild type and the mutant Ig W514R, (b) Values of amide chemical shift changes mapped on the NMR structure (PDB: 1IVT). Some representative residues with relatively higher value of backbone amide chemical shift change are shown in spheres. (c) Correlation curve between the 13Cα chemical shift of wild type vs. mutant Ig W514R (r2 = 0.998). (d) Plot of residue specific 13Cα chemical shift differences between the wild type and the mutant Ig W514R, (e) 13Cα chemical shift differences as mapped on the NMR structure. Some of the residues showing relatively significant differences between the wild type and the mutant are shown as spheres in the NMR structures.
Figure 5
Figure 5
Ig W514R shows different dynamics compared to the wild type: Plots of residue specific {1H}-15N-heteronuclear NOE of wild type (a) and mutant Ig W514R (c) respectively, while (b) (wild type) and (d) (mutant) represent the corresponding values mapped on the NMR structure (PDB: 1IVT). Plots of R2/R1 relaxation ratios and the RMSF (root mean square fluctuation) from MD simulations of wild type (e) and mutant Ig W514R (g). R2/R1 relaxation ratios are mapped on the NMR structure as shown in (f) (wild type) and (h) (mutant) respectively. Some of the residues showing differences in their dynamic behaviour in wild type and mutant are represented as sphere in the NMR structures.
Figure 6
Figure 6
Ig W514R affects the state of association of Ig domain: SEC-MALS analysis of Ig and Ig W514R showing the different forms of the proteins respectively. (red line) Refractive index. (black line) Laser light scattering. (blue line) UV absorbance 280 nm. (black dot line) Molecular weight (right axis).
Figure 7
Figure 7
Wild type and mutant Ig unfold differently: Thermograms from differential scanning calorimetry to determine the thermal stability and corresponding unfolding behaviour of (a) Ig and (b) Ig W514R. Black and red represent experimental data and fitted data respectively.
Figure 8
Figure 8
Average structures of Ig W514R fluctuates from Ig: RMSF values of amino acids (nm) from the MD simulation are mapped on the average structures of (a) Ig and (b) Ig W514R.Tryptohan residues are shown as stick model with magenta colour.
Figure 9
Figure 9
Electrostatic potential map for Ig and Ig W514R proteins were obtained using an APBS tool: The negative electrostatic potential is highlighted in red, and the positive potential is highlighted in blue. Green color marking is for mutated residue for (a) Ig and (b) Ig W514R. The view of the opposite face as space filled model with Asp and Glu residues highlighted in pink colour for (c) Ig and (d) Ig W514R.
Figure 10
Figure 10
W514R overexpression in C2C12 leads to increased mesh size: (a) Panels show a single plane and 3D surface view of EGFP-LA and EGFP-LA W514R. Scale bar = 5 μm.
Figure 11
Figure 11
W514R alters the normal distribution pattern of nuclear envelop associated nuclear pore complex (NPC): (a) Distribution of LB1 on nuclear lamina shown in a single plain of wild type and mutant transfected cells. (b) Localization of nuclear pore complex on the nuclear rim has been elucidated in the two panels for wild type and mutant transfected cells. Insets marked by white squares represent zoomed (~6 fold) portion of the rim depicted by square shaped boxes. Scale bar = 5 μm. (c) Schematic illustration to calculate pearson correlation of selected region of interest (ROIs) on the periphery of nucleus through NIS Elements version 4.13.00 (build 914). (d) Pearson correlation for the co-localization of LA with LB1 & Nuclear pore complex. Black bar represents the wild type and red bar represents the mutant W514R (Error bars represent s.d., **represents p < 0.001, ***represents p < 0.0001).

Similar articles

Cited by

References

    1. Gruenbaum Y, Foisner R. Lamins: nuclear intermediate filament proteins with fundamental functions in nuclear mechanics and genome regulation. Annu Rev Biochem. 2015;84:131–64. doi: 10.1146/annurev-biochem-060614-034115. - DOI - PubMed
    1. Turgay Y, et al. The molecular architecture of lamins in somatic cells. Nature. 2017;543:261–264. doi: 10.1038/nature21382. - DOI - PMC - PubMed
    1. Worman HJ, Schirmer EC. Nuclear membrane diversity: underlying tissue-specific pathologies in disease? Curr Opin Cell Biol. 2017;34:101–12. doi: 10.1016/j.ceb.2015.06.003. - DOI - PMC - PubMed
    1. Lammerding J, et al. Lamins A and C but not lamin B1 regulate nuclear mechanics. J Biol Chem. 2006;281:25768–80. doi: 10.1074/jbc.M513511200. - DOI - PubMed
    1. Swift J, et al. Nuclear lamin-A scales with tissue stiffness and enhances matrix-directed differentiation. Science. 2013;341:1240104. doi: 10.1126/science.1240104. - DOI - PMC - PubMed

Publication types