. 2018 Sep 14;9(1):3763.
doi: 10.1038/s41467-018-06268-0.

Macrophage-secreted interleukin-35 regulates cancer cell plasticity to facilitate metastatic colonization

Affiliations

Macrophage-secreted interleukin-35 regulates cancer cell plasticity to facilitate metastatic colonization

Chih-Chan Lee et al. Nat Commun. .

Abstract

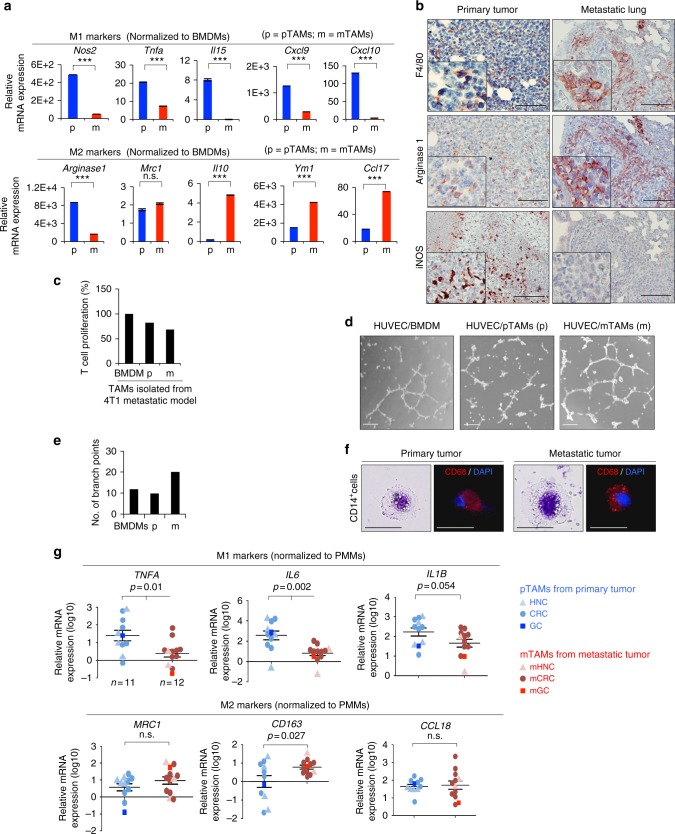
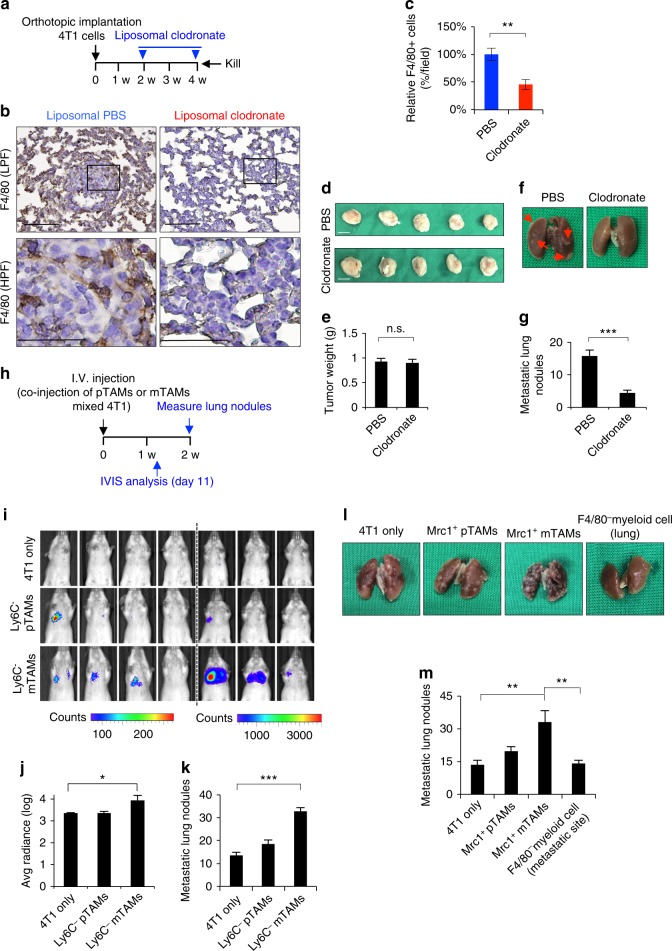
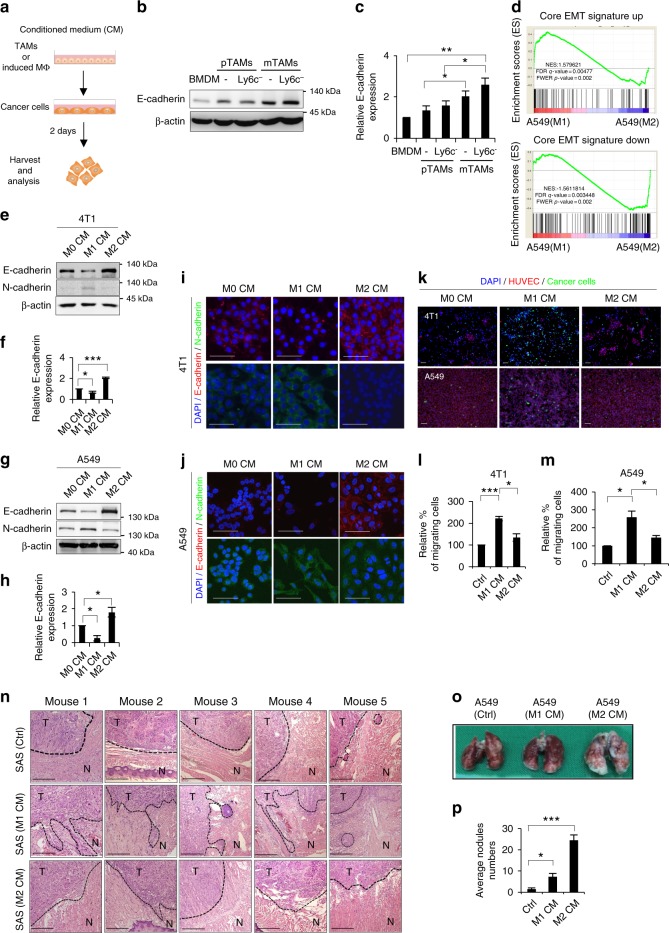
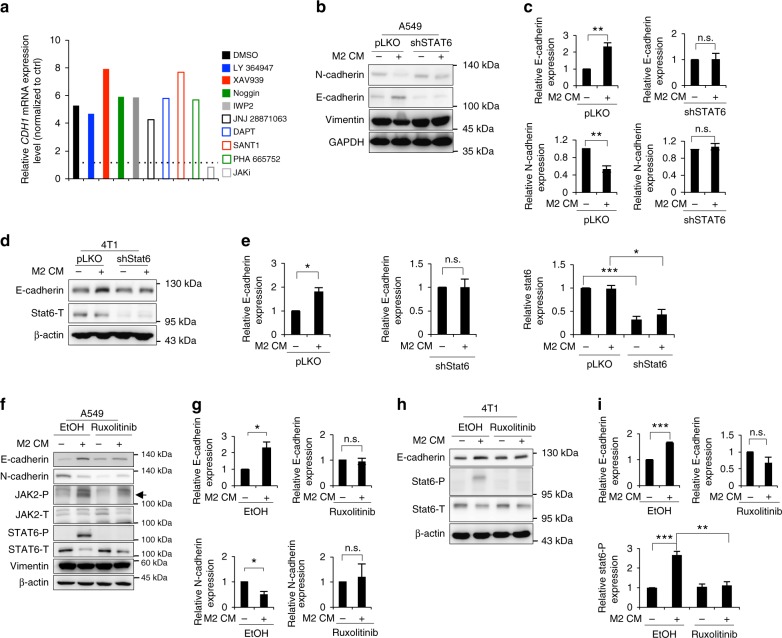
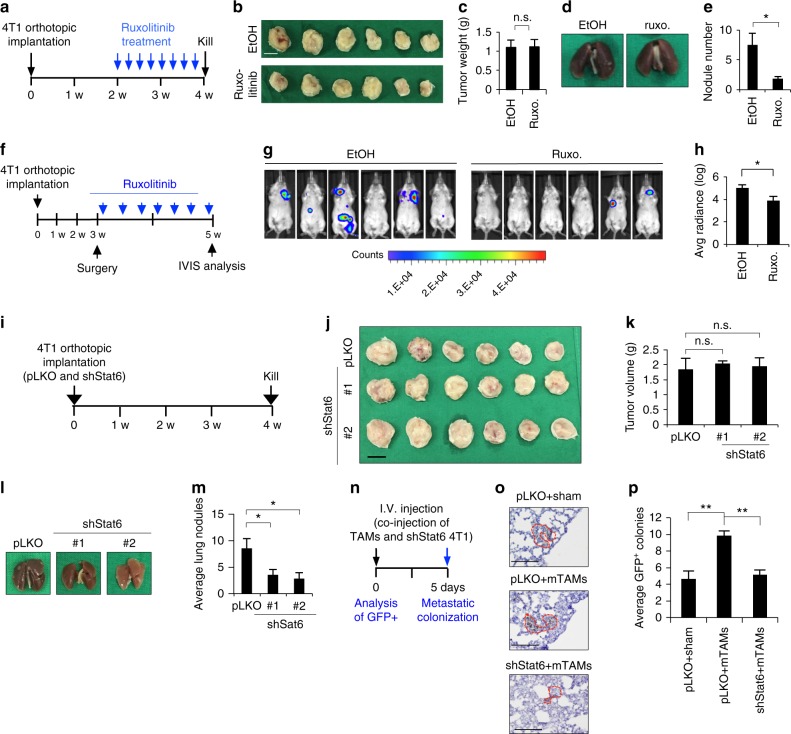
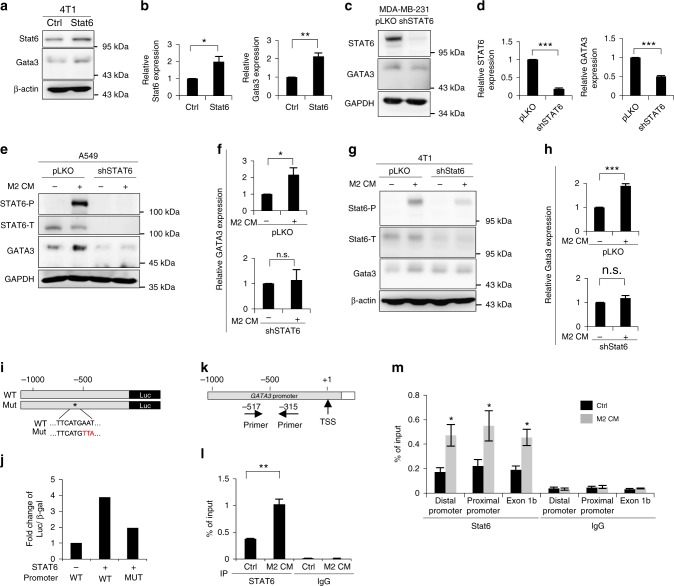
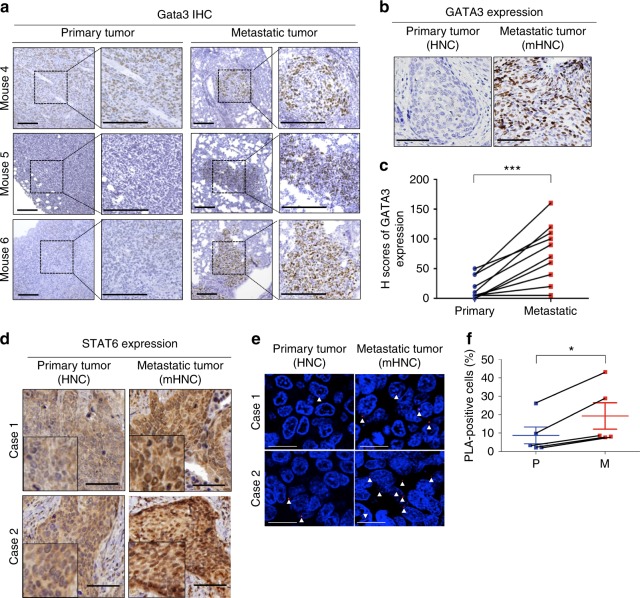
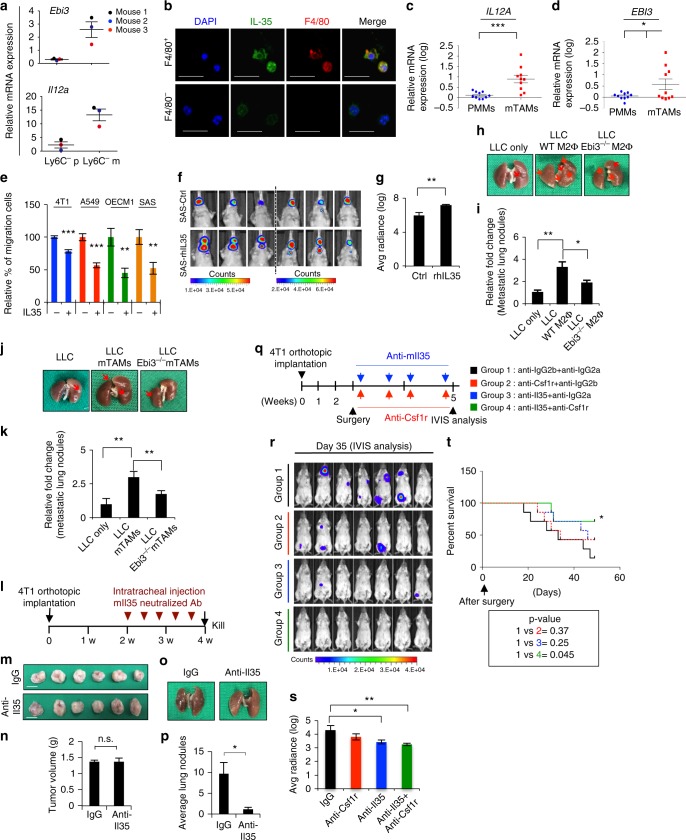
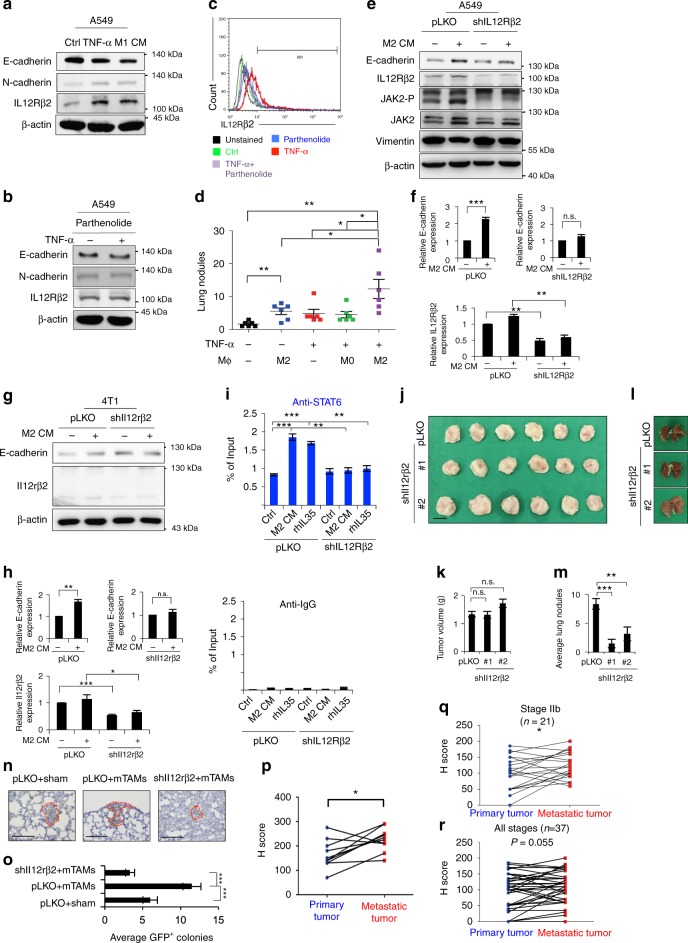
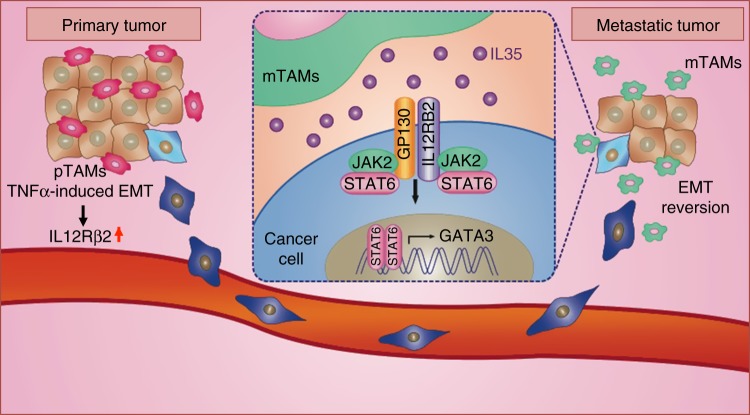
A favorable interplay between cancer cells and the tumor microenvironment (TME) facilitates the outgrowth of metastatic tumors. Because of the distinct initiating processes between primary and metastatic tumors, we investigate the differences in tumor-associated macrophages (TAMs) from primary and metastatic cancers. Here we show that dual expression of M1 and M2 markers is noted in TAMs from primary tumors, whereas predominant expression of M2 markers is shown in metastatic TAMs. At metastatic sites, TAMs secrete interleukin-35 (IL-35) to facilitate metastatic colonization through activation of JAK2-STAT6-GATA3 signaling to reverse epithelial-mesenchymal transition (EMT) in cancer cells. In primary tumors, inflammation-induced EMT upregulates IL12Rβ2, a subunit of the IL-35 receptor, in cancer cells to help them respond to IL-35 during metastasis. Neutralization of IL-35 or knockout of IL-35 in macrophages reduces metastatic colonization. These results indicate the distinct TMEs of primary and metastatic tumors and provide potential targets for intercepting metastasis.


Conflict of interest statement

The authors declare no competing interests.

Figures

Fig. 1
Fig. 1
Distinct macrophages population in primary and metastatic tumor. a RT-qPCR for analyzing the expression of M1 (Nos2, Tnfa, Il15, Cxcl9, and Cxcl10) and M2 markers (Arginase 1, Mrc1, Il10, Ym1, and Ccl17) of CD11b+F4/80+ TAMs in the primary tumors (pTAMs; p) and metastatic lungs (mTAMs; m) 5 weeks after inoculation of 4T1 cells. The data were normalized to bone marrow-derived macrophages (BMDM) from healthy mice. n = 3 (triplicated RT-qPCR from the same mouse). b Representative result of immunohistochemistry of F4/80, Arg-1, and iNOS in matched primary-metastatic tumor pairs for showing the tumor-associated macrophages in 4T1-BALB/c orthotopic syngeneic model. Scale bar, 100 μm. c T cell proliferation assay. The CD4+ T cells were co-cultured with BMDMs, pTAMs (p), or mTAMs (m) from 4T1 orthotopic model. n = 2 independent experiments (each experiment contains three technical replicates). d Representative images of HUVEC organization. Scale bar, 50 μm. e Quantification of HUVEC tube formation cultivated in different conditioned media as measured by their branching number. n = 2 independent experiments (the data of each experiment was the mean value of quantification of four randomly selected fields) f Liu’s stain and immunofluorescent stain of CD68 in CD14+ cells from primary and metastatic tumor. Scale bar, 20 μm. g RT-qPCR for analyzing the expression of M1 (TNFA, IL6, IL1B) and M2 markers (MRC1, CD163, CCL18) of CD14+ TAMs in primary (n = 11) and metastatic human cancers (n = 12). The data were normalized to peripheral blood monocytes-derived macrophages (PMMs) (n = 5). Data represent mean ± S.E.M. The p-value is show in each panel. n.s. non-significance. HNC head and neck cancer, CRC colon rectal cancer, GC gastric cancer, mHNC metastatic head and neck cancer; mCRC metastatic colon rectal cancer, mGC metastatic gastric cancer. Data represent mean ± S.E.M. *p < 0.05, **p < 0.01, ***p < 0.001. Statistical analysis: Student’s t-test (a, g). See also Supplementary Figure 1
Fig. 2
Fig. 2
mTAMs facilitates metastatic colonization. a Schema of 4T1-BALB/c orthotopic syngeneic model in mice receiving depletion of pulmonary macrophages through intratracheal injection of liposomal clodronate. b Representative result for confirming the effect of macrophages depletion. IHC for staining F4/80 was performed in lungs of mice receiving intratracheal liposomal clodronate or vehicle control (PBS). LPF low power field; Scale bar, 100 μm. HPF high power field; Scale bar, 50 μm. c Quantification of F4/80+ macrophages in lungs of mice receiving intratracheal liposomal clodronate or vehicle control (PBS). The result is present as the fold change of the percentage of F4/80+ macrophages in six representative fields. n = 5 for each group. d, e Photos (d) and quantification (e) of primary tumors. n.s. non-significance. f, g Photos (f) and quantification (g) of lung nodules of mice receiving intratracheal liposomal clodronate or control PBS. Red arrows indicate the metastatic tumors in lung. Scale bar, 1 cm. n = 5 for each group. h Schema of metastatic colonization experiments. 4T1 cells co-injected with CD11b+F4/80+Ly6C pTAMs or mTAMs through tail vein of BALB/C mice. i IVIS for visualizing tumor dissemination 11 days after tumor cells injection. n = 7 for each group. j Quantification of bioluminescent imaging of i experiment 2 weeks after tumor cells injection. k Quantification of metastatic lung nodules of i experiment 2 weeks after tumor cells injection. n = 6 for each group. l Representative photos of lungs of mice 2 weeks after injection of the 4T1 cells with/without Mrc1+ TAMs or F4/80 myeloid cell from metastatic tumors. m Quantification of metastatic lung nodules. n = 6 for each group. Data represent mean ± S.E.M. *p < 0.05, **p < 0.01, ***p < 0.001. Statistical analysis: Student’s t-test (c, e, g, j, k, m). See also Supplementary Figure 2
Fig. 3
Fig. 3
The effect of macrophages on the epithelial plasticity of cancer cells. a Schema for the experiments. b, c The representative result (b) and quantification (c) of western blots of E-cadherin in 4T1 cells treated with the indicated conditioned media (CM) for 48 h. n = 3. BMDM bone marrow-derived macrophages; pTAM, CD11b+F4/80+ primary tumor-associated macrophages; Ly6CpTAM, Ly6C CD11b+F4/80+ primary tumor-associated macrophages; mTAM, CD11b+F4/80+ metastatic tumor-associated macrophages; Ly6C mTAMs: Ly6C CD11b+F4/80+ metastatic tumor-associated macrophages. d GSEA plot for showing the association between M1/M2 CM-regulated signature in A549 cells and core signature in EMT. NES normalized enrichment score, FDR false discovery rate, FWER family-wise error rate. e, f The representative result (e) and quantification (f) of western blots for E-cadherin in 4T1 cells upon treatment of the indicated CM for 48 h. n = 3. g, h The representative result (g) and quantification (h) of western blots of E-cadherin in A549 cells upon treatment of the indicated CM for 48 h. n = 3. i, j Immunofluorescent staining of E-cadherin/N-cadherin in 4T1 and A549 cells upon indicated CM treatment for 48 h. Scale bar, 100 μm. k Transendothelial migration assay of 4T1 and A549 cells upon indicated CM treatment. Scale bar, 100 μm. l, m Quantification of cancer cells of the result (k). n = 3 independent experiments (the data of each experiment was the mean value of quantification of five randomly selected fields). n Hematoxylin & eosin stain of the tumor samples harvested from the orthotopic SAS xenograft. The SAS cells were treated with the indicated CM for 48 h before inoculation. T tumor, N normal tissue. Scale bar, 200 μm. (n = 5 for each group). o Representative photos of the lungs from mice receiving tail vein injection of A549 cells pretreated with M1 or M2 CM or control media. p Quantification of metastatic lung nodules 8 weeks after tumor cells injection (n = 6 for each group). Data represent mean ± S.E.M. *p < 0.05, **p < 0.01, ***p < 0.001. Statistical analysis: Student’s t-test (c, f, h, l, m, p) and Kolmogorov–Smirnov test for GSEA (d). See also Supplementary Figure 3, Supplementary Table 1, Supplementary Data 1
Fig. 4
Fig. 4
JAK–STAT6 axis reverses EMT. a RT-qPCR for CDH1 in M2-conditioned media (CM)-treated A549 cells under different inhibitors for 48 h. n = 2 independent experiments (each experiment contains two technical replicates). b, c The representative result (b) and quantification (c) of the EMT markers in A549 infected with a shRNA against STAT6 (shSTAT6) or a control vector (pLKO) upon M2 CM treatment for 48 h. n = 3. d, e The representative result (d) and quantification (e) of E-cadherin and Stat6 in 4T1 cells infected with shStat6 or a control vector upon M2 CM treatment for 48 h. n = 3. f, g The representative result (f) and quantification (g) of the EMT markers in M2 CM-treated A549 cells with/without 10 μM ruxolitinib treatment for 48 h. The arrow indicates phosphorylated JAK2. n = 3. h, i The representative result (h) and quantification (i) of E-cadherin and phosphorylated Stat6 in M2 CM-treated 4T1 cells with/without 10 μM ruxolitinib treatment for 48 h. n = 3. Data represent mean ± S.E.M. *p < 0.05, **p < 0.01, ***p < 0.001. Statistical analysis: Student’s t-test (c, e, g, i). See also Supplementary Figure 4, Supplementary Data 2, Supplementary Data 3
Fig. 5
Fig. 5
Activation of JAK–STAT6 pathway promotes metastasis. a Schema of animal experiment. 4T1-BALB/c syngeneic orthotopic mice receiving 30 mg/kg ruxolitinib or normal saline through intraperitoneal injection every 2 days for 2 weeks started from the end of 2nd week after 4T1 cells inoculation. b, c Photos (b) and quantification (c) of primary tumors in (a). Scale bar, 1 cm. d, e Photos (d) and quantification (e) of lung nodules in (a). n = 6. f Schema of animal experiment. 4T1-BALB/c syngeneic orthotopic mice receiving surgery for removing primary tumor at the end of 3rd week after tumor inoculation. 30 mg/kg ruxolitinib or normal saline was delivered through intraperitoneal injection every 2 days after surgery for 2 weeks, and IVIS images were taken at the end of 5th week. g Bioluminescence signals of the mice 2 weeks after surgery. h Quantification of bioluminescent imaging. i Schema for animal experiment. 4T1 cells with/without Stat6 knockdown were inoculated orthotopically and mice were killed at the end of 4th week. j, k Photos (j) and quantification (k) of primary tumors. Scale bar, 1 cm. l, m Photos (l) and quantification (m) of lung nodules. n = 6. n Schema of metastatic colonization experiment. GFP-labeled 4T1 cells with/without Stat6 knockdown were co-injected with Ly6CmTAMs/vehicle control through tail vein, and the mice were killed at 5th days. IHC of GFP was used for analyzing metastatic colonization in lung. o Representative images of IHC for GFP of lungs. Scale bar, 100 μm. p Quantification of average GPF-positive colonies from 5 paraffin-embedded lung section. n = 6. Data represent mean ± S.E.M. *p < 0.05, **p < 0.01, ***p < 0.001. Statistical analysis: Student’s t-test (c, e, h, k, m, p). See also Supplementary Figure 4
Fig. 6
Fig. 6
Direct regulation of GATA3 by STAT6. a, b The representative result (a) and quantification (b) of STAT6 and GATA3 in 4T1 cells infected with a STAT6 expression vector or a control vector. n = 3. c, d The representative result (c) and quantification (d) of STAT6 and GATA3 in MDA-MB-231 cells infected shSTAT6 or a control sequence (pLKO). n = 3. e The representative result (e) and quantification (f) of GATA3 in A549 cells infected with shSTAT6 or control with/without M2 CM treatment for 48 h. n = 3. g, h The representative result (g) and quantification (h) of Gata3 in 4T1 cells infected with shStat6 or control with/without M2 CM for 48 h. n = 3. i Representation of the reporter constructs. j Luciferase reporter assay in HEK-293T transfected with indicated plasmids. n = 2 independent experiments (each experiment contains two technical replicates). k Chromatin immunoprecipitation (ChIP). Organization of the promoter region of GATA3. TSS transcription start site. The primers for amplification of the DNA-binding region are indicated. l ChIP assay. A549 cells were treated with M2 CM/control media for 24 h. The enrichment values were normalized to the input of immunoprecipitation. n = 3 independent experiments (each experiment contains two technical replicates). m ChIP assay. 4T1 were treated with M2 CM/control media for 24 h. n = 3 independent experiments (each experiment contains two technical replicates). Data represent mean ± S.E.M. *p < 0.05, **p < 0.01, ***p < 0.001. Statistical analysis: Student’s t-test (b, d, f, h, l, m). See also Supplementary Figure 5
Fig. 7
Fig. 7
Activation of STAT6–GATA3 axis in metastatic tumors. a Immunohistochemistry (IHC) of Gata3 in primary-metastatic paired sample from three mice. Scale bar, 200 μm. b Representative images of IHC of GATA3 in paired primary-metastatic tumors from 10 patients. Scale bar, 100 μm. HNC head and neck cancers, mHNC metastatic head and neck cancer. c Quantification of IHC by H score. d IHC of STAT6 in paired primary-metastatic sample. Scale bar, 100 μm. e Proximity ligation assay (PLA) for detecting phosphorylated STAT6 by dual staining of the anti-STAT6 and the anti-pan-phosphorylated tyrosine antibodies in paired head and neck cancer patient sample (n = 5). Scale bars, 20 μm. The arrows indicate the representative PLA-positive signals. f Quantification of PLA-positive cells. P Primary tumor, M Metastatic tumor. Data represent mean ± S.E.M. *p < 0.05, **p < 0.01, ***p < 0.001. Statistical analysis: Student’s t-test (c, f). See also Supplementary Figure 5
Fig. 8
Fig. 8
mTAMs-secreted IL-35 facilitates metastatic colonization. a RT-qPCR for Il12a and Ebi3 in Ly6C TAMs from the matched primary tumors and lungs of 4T1-BALB/c syngeneic orthotopic mice 5 weeks after 4T1 cells inoculation (n = 3). The data were normalized to BMDM from healthy mice (n = 3). b Immunofluorescent staining of Il-35 (green) and F4/80 (red) in Ly6CF4/80+ and Ly6CF4/80 cells from lungs of 4T1-BALB/c syngeneic orthotopic mice. Blue, nuclei. Scale bar, 50 μm. c, d RT-qPCR for analyzing the expression of IL12A and EBI3 in CD14+ TAMs from metastatic human tumors (n = 10) versus peripheral blood monocyte-derived macrophages (PMMs) (n = 10). e Transwell migration assay. Recombinant human/murine IL-35 (50 ng ml−1) treatment duration: 48 h. n = 3 independent experiments (the data of each experiment was the mean value of quantification of at least five randomly selected fields). f Orthotopic xenograft experiment. SAS cells were pretreated with rhIL-35 (50 ng ml−1) or control for 48 h before inoculation. IVIS images were taken 14 days after tumor inoculation (n = 6 for each group). g Quantification of bioluminescent imaging. h Representative photos of lungs 2 weeks after injection of the LLC cells with/without co-injection of the WT or Ebi3/ M2-like macrophages. i Quantification of metastatic lung nodules. n = 5 for each group. j Representative photos of lungs 2 weeks after injection of the LLC cells with/without co-injection of mTAMs from WT or Ebi3/ mice. k Quantification of metastatic lung nodules. n = 4 for each group. l Schema for animal experiment. m, n Photos (m) and quantification (n) of primary tumor. Scale bar, 1 cm. o, p Photos (o) and quantification (p) of lung nodules. n = 6. q Schema for presenting the antibody therapy experiment. n = 7 for each group. r, s Bioluminescence signal (r) and quantification (s). t Kaplan–Meier analysis of the survival of mice after antibody administration. Data represent mean ± S.E.M. *p < 0.05, **p < 0.01, ***p < 0.001. Statistical analysis: Student’s t-test (c, d, e, g, i, k, n, p, s) and log-rank test for survival curve (t). See also Supplementary Figure 6, Supplementary Data 4
Fig. 9
Fig. 9
TNFα-primed cancer cells express IL12Rβ2 for metastasis. a IL12Rβ2 and EMT markers in A549 treated with TNFα (20 ng ml−1), M1 CM, or control for 24 h. b IL12Rβ2 and EMT markers in A549 upon TNFα treatment with/without parnetholide for 24 h. c Flow cytometry for detecting IL12Rβ2 in A549 upon TNFα (20 ng ml−1) treatment with/without parnetholide for 24 h. d Quantification of the metastatic lung nodules in mice receiving 1 × 106 A549 with/without TNFα (20 ng ml−1) pretreatment for 48 h and 5 × 105 resting (M0)/M2 macrophages. Mice were killed 2 months after injection. n = 6. e, f The representative result (e) and quantification (f) of IL12Rβ2 and E-cadherin in A549 infected with shIL12RB2 or control (pLKO) with/without M2 CM for 48 h. n = 3. g, h The representative result (g) and quantification (h) of Il12rβ2 and E-cadherin in 4T1 infected shIl12rb2 or control with/without M2 CM for 48 h. n = 3. i ChIP in A549 infected with shIL12RB2/control and treated with M2 CM, rhIL-35, or a control media for 24 h. n = 3 independent experiments (each experiment contains two technical replicates). j, k The 4T1-BALB/c orthotopic tumor experiment. The tumors were harvested 4 weeks after tumor implantation. Photos (j) and quantification (k) of primary tumor. Scale bar, 1 cm. l, m Photos (l) and quantification (m) of lung nodules. n = 6. n Metastatic colonization assay. The GFP-labeled 4T1 with/without Il12rb2 knockdown were co-injected with Ly6CF4/80+mTAMs from 4T1-BALB/c syngeneic tumor model, and the lungs were harvested 5 days after injection. n = 6. IHC for staining GFP in representative sections of lungs. Scale bar, 100 μm. o Quantification of IHC results by counting the average GFP+ colonies from five tissue sections. p IHC of IL12Rβ2 in paired primary-metastatic head and neck cancers. Quantification of IHC by H score. n = 10. q, r IHC of IL12Rβ2 in 37 paired primary-metastatic breast cancer samples. Quantification of IHC by H score. q Stage IIb cases; r all-stage cases. Data represent mean ± S.E.M. *p < 0.05, **p < 0.01, ***p < 0.001. Statistical analysis: Student’s t-test (d, f, h, i, k, m, o, p, q, r). See also Supplementary Figure 7, Supplementary Table 2 and 3
Fig. 10
Fig. 10
A proposed model of macrophages-regulated epithelial plasticity during metastasis. In primary tumor, TNFα induces EMT and expression of IL12Rβ2 in cancer cells, which promotes tumor invasion and migration. In metastatic sites, mTAMs secrete IL-35 to activate JAK2–STAT6 axis in cancer cells, which promotes MET through activating GATA3, MET of cancer cells at metastatic sites facilitates colonization

References

    1. Acloque H, Adams MS, Fishwick K, Bronner-Fraser M, Nieto MA. Epithelial–mesenchymal transitions: the importance of changing cell state in development and disease. J. Clin. Invest. 2009;119:1438–1449. doi: 10.1172/JCI38019. - DOI - PMC - PubMed
    1. De Craene B, Berx G. Regulatory networks defining EMT during cancer initiation and progression. Nat. Rev. Cancer. 2013;13:97–110. doi: 10.1038/nrc3447. - DOI - PubMed
    1. Mani SA, et al. The epithelial–mesenchymal transition generates cells with properties of stem cells. Cell. 2008;133:704–715. doi: 10.1016/j.cell.2008.03.027. - DOI - PMC - PubMed
    1. Yang MH, et al. Bmi1 is essential in Twist1-induced epithelial–mesenchymal transition. Nat. Cell Biol. 2010;12:982–992. doi: 10.1038/ncb2099. - DOI - PubMed
    1. Yu M, et al. Ex vivo culture of circulating breast tumor cells for individualized testing of drug susceptibility. Science. 2014;345:216–220. doi: 10.1126/science.1253533. - DOI - PMC - PubMed

Publication types

MeSH terms