

Summertime Primary and Secondary Contributions to Southern Ocean Cloud Condensation Nuclei
- PMID: 30218089
- PMCID: PMC6138724
- DOI: 10.1038/s41598-018-32047-4
Summertime Primary and Secondary Contributions to Southern Ocean Cloud Condensation Nuclei
Erratum in
-
Author Correction: Summertime Primary and Secondary Contributions to Southern Ocean Cloud Condensation Nuclei.Sci Rep. 2019 Jul 18;9(1):10613. doi: 10.1038/s41598-019-46788-3. Sci Rep. 2019. PMID: 31316110 Free PMC article.
Abstract
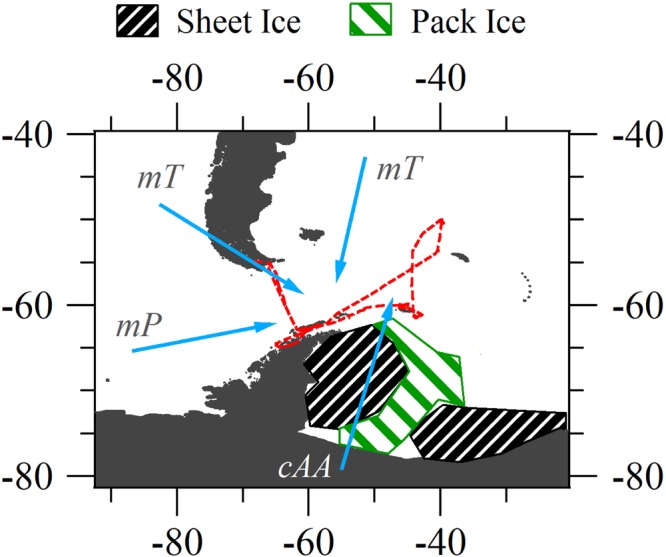
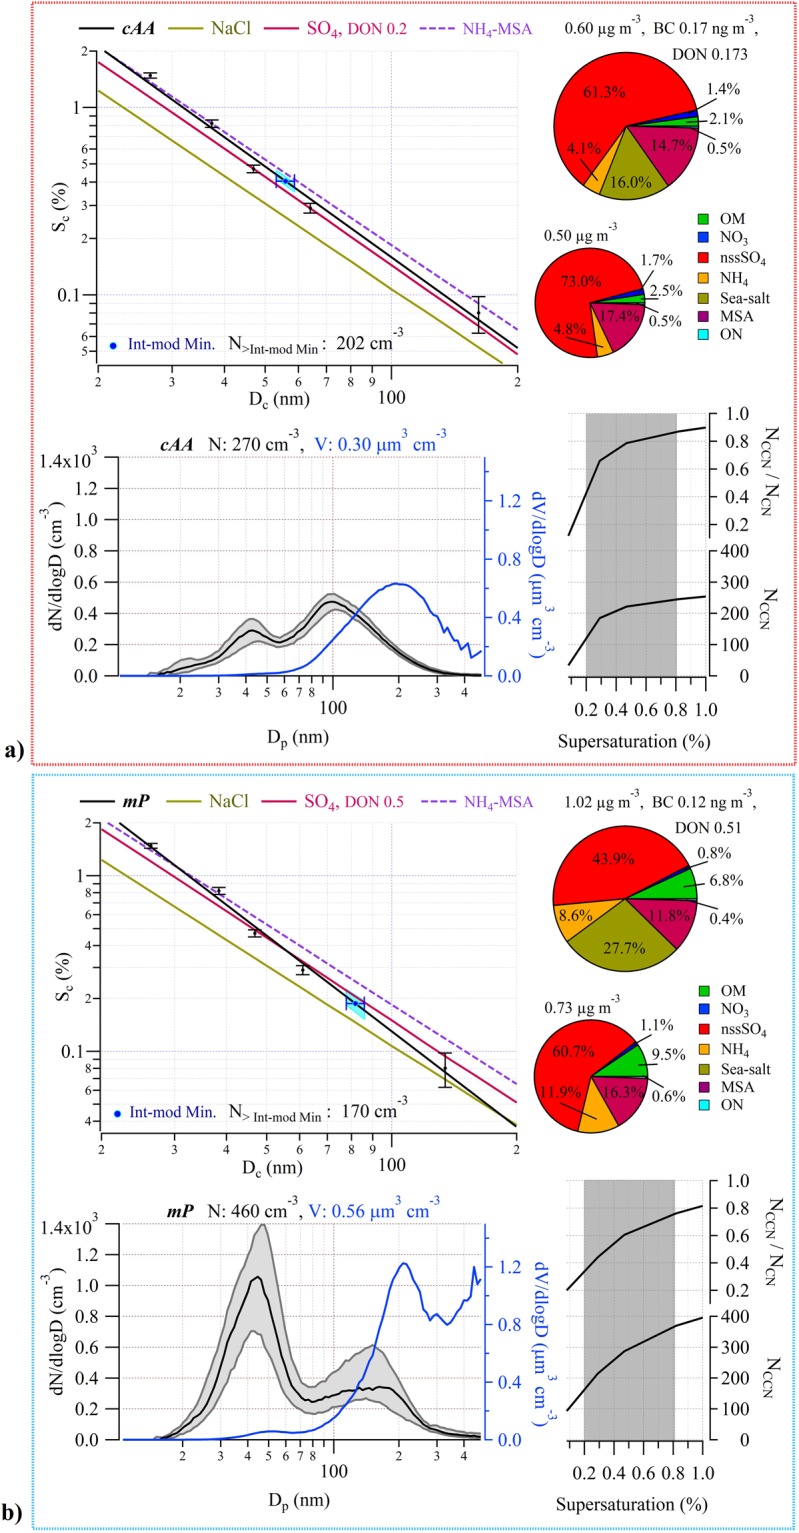
Atmospheric aerosols in clean remote oceanic regions contribute significantly to the global albedo through the formation of haze and cloud layers; however, the relative importance of 'primary' wind-produced sea-spray over secondary (gas-to-particle conversion) sulphate in forming marine clouds remains unclear. Here we report on marine aerosols (PM1) over the Southern Ocean around Antarctica, in terms of their physical, chemical, and cloud droplet activation properties. Two predominant pristine air masses and aerosol populations were encountered: modified continental Antarctic (cAA) comprising predominantly sulphate with minimal sea-salt contribution and maritime Polar (mP) comprising sulphate plus sea-salt. We estimate that in cAA air, 75% of the CCN are activated into cloud droplets while in mP air, 37% are activated into droplets, for corresponding peak supersaturation ranges of 0.37-0.45% and 0.19-0.31%, respectively. When realistic marine boundary layer cloud supersaturations are considered (e.g. ~0.2-0.3%), sea-salt CCN contributed 2-13% of the activated nuclei in the cAA air and 8-51% for the marine air for surface-level wind speed < 16 m s-1. At higher wind speeds, primary marine aerosol can even contribute up to 100% of the activated CCN, for corresponding peak supersaturations as high as 0.32%.
Conflict of interest statement
The authors declare no competing interests.
Figures
References
-
- Mulcahy, J. P., O’Dowd, C. D., Jennings, S. G. & Ceburnis, D. Significant enhancement of aerosol optical depth in marine air under high wind conditions. Geophysical Research Letters35 n/a–n/a, 10.1029/2008GL034303 (2008).
-
- O’Dowd CD, Lowe JA, Smith MH, Kaye AD. The relative importance of non-sea-salt sulphate and sea-salt aerosol to the marine cloud condensation nuclei population: An improved multi-component aerosol-cloud droplet parametrization. Quarterly Journal of the Royal Meteorological Society. 1999;125:1295–1313. doi: 10.1002/qj.1999.49712555610. - DOI
-
- Charlson RJ, Lovelock JE, Andreae MO, Warren SG. Oceanic phytoplankton, atmospheric sulphur, cloud albedo and climate. Nature. 1987;326:655–661. doi: 10.1038/326655a0. - DOI
Publication types
MeSH terms
Substances
LinkOut - more resources
Full Text Sources
Other Literature Sources
