. 2018 Oct;13(10):2247-2267.
doi: 10.1038/s41596-018-0035-4.

An experimental murine model to study periodontitis

Affiliations

An experimental murine model to study periodontitis

Julie Marchesan et al. Nat Protoc. 2018 Oct.

Abstract

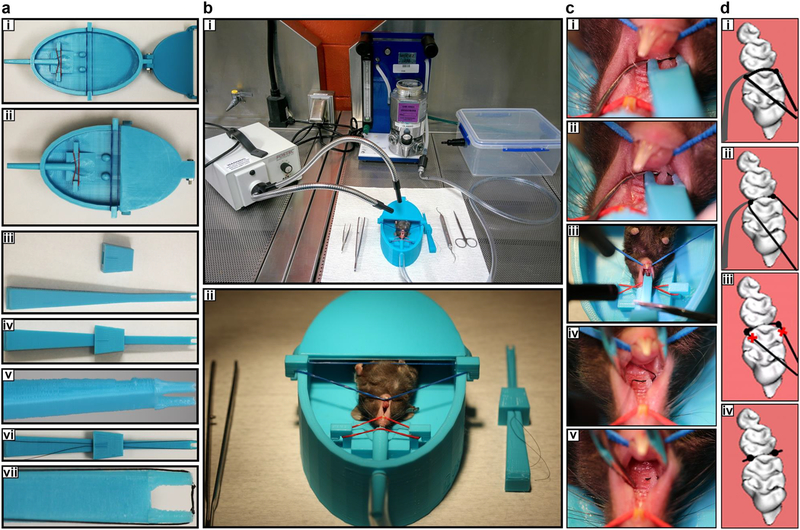
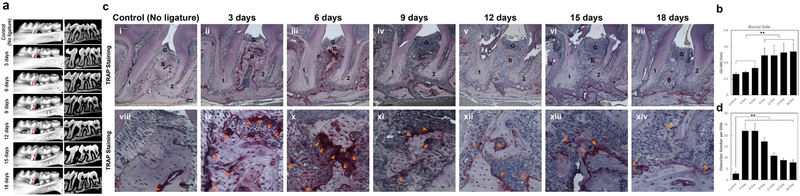
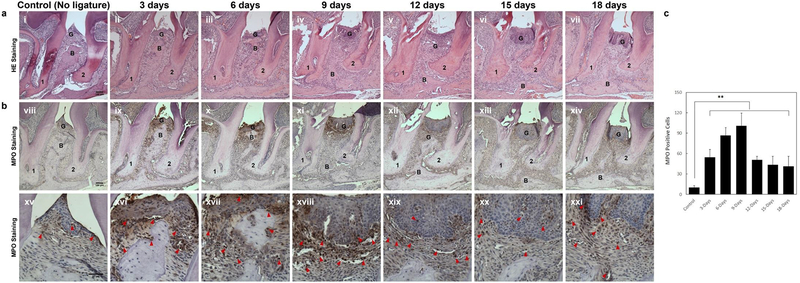
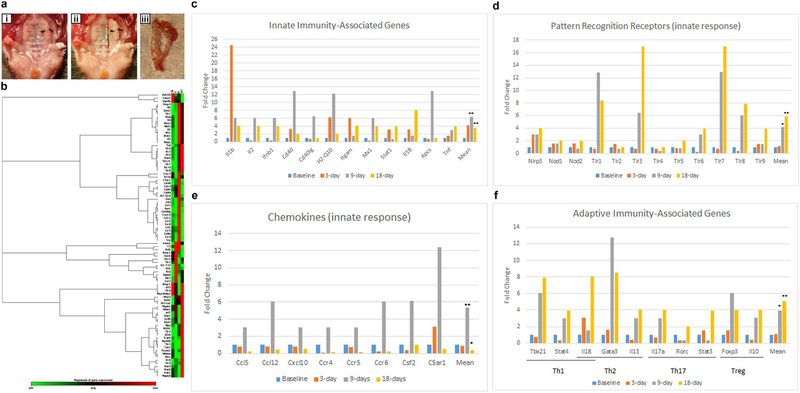
Periodontal disease (PD) is a common dental disease associated with the interaction between dysbiotic oral microbiota and host immunity. It is a prevalent disease, resulting in loss of gingival tissue, periodontal ligament, cementum and alveolar bone. PD is a major form of tooth loss in the adult population. Experimental animal models have enabled the study of PD pathogenesis and are used to test new therapeutic approaches for treating the disease. The ligature-induced periodontitis model has several advantages as compared with other models, including rapid disease induction, predictable bone loss and the capacity to study periodontal tissue and alveolar bone regeneration because the model is established within the periodontal apparatus. Although mice are the most convenient and versatile animal models used in research, ligature-induced periodontitis has been more frequently used in large animals. This is mostly due to the technical challenges involved in consistently placing ligatures around murine teeth. To reduce the technical challenge associated with the traditional ligature model, we previously developed a simplified method to easily install a bacterially retentive ligature between two molars for inducing periodontitis. In this protocol, we provide detailed instructions for placement of the ligature and demonstrate how the model can be used to evaluate gingival tissue inflammation and alveolar bone loss over a period of 18 d after ligature placement. This model can also be used on germ-free mice to investigate the role of human oral bacteria in periodontitis in vivo. In conclusion, this protocol enables the mechanistic study of the pathogenesis of periodontitis in vivo.


Conflict of interest statement

Competing Financial Interests

The authors declare no competing financial interests.

Figures

Figure 1.
Figure 1.. Tools and technical procedures required to set up the simplified ligature model in mice.
(a-h) The tools required. (a,b) Mouse dental bed. b represents high magnification of a. (c-e): U-tipped Ligature holder (U shape for holding silk). e represents high magnification of c and d. (f,g) The U-tipped holder with 5–0 silk suture containing two knots in the inside of the forceps tips (about 2.5 mm distance between knots). g represents high magnification of f (h) Experimental set up immediately prior to anesthetizing the mouse with isoflurane. The stages required to insert the ligature are shown as photos (I,k,m,o) and diagrammatically (j, l, n, p). The left hand is used to hold the dental explorer whilst the tip of the dental explorer and the 2.5 mm silk between knobs are carefully located in the gap between the 1st and 2nd molar using the U-tipped Ligature holder held in the right hand (I,j). The suture is then pushed through the interdentium between first molar and second molar (k-l). The silk is cut and the U-tipped forceps removed (m,n). Finally the silk is cut at the end of the knot (o,p). Appropriate institutional regulatory board permission was obtained to carry out the experimental procedure on the mouse shown here.
Figure 2.
Figure 2.. Time course of alveolar bone loss and osteoclast activation following insertion of ligature.
(a) Representative sagittal three-dimensional and bi-dimensional views of the maxillary molars 0, 3, 6, 9, 12 and 18 days following insertion of ligature. (b) Measurement of the distances from the cementoenamel junction to the alveolar bone crest (CEJ–ABC) on the buccal side of the ligature site at each time point following insertion of ligature. Results are the mean ± standard deviation (n=5 mice per group). **p<0.01 (One-way ANOVA and Bonferroni’s post hoc tests). (c) Representative TRAP stained sections of gingival tissues harvested from at each time point following ligature placement at low (top panels, 100X magnification used, scale bar is 100μm) and high (bottom panels, 400X magnification used, scale bar is 50μm) magnifications. 1, the root of the first molar; 2, the root of the second molar; B=alveolar bone; G=gingival epithelium; Arrowheads mark Osteoclasts. (d) Total osteoclast numbers between the 1st and 2sec molars at the ligature site at all time points. Results are the mean ± standard deviation (n=5 mice per group). **p<0.01 (One-way ANOVA and Bonferroni’s post hoc tests). Appropriate institutional regulatory board permission was obtained for these experiments. Ligatures were retained in all mice used in the experiment so there was no need to exclude any mice from further analysis. Researchers were blind to the groups mice were assigned to when measuring the distances between CEJ to ABC.
Figure 3.
Figure 3.. Time course of of gingival tissue inflammation following insertion of ligature.
(a) Representative H/E stained sections of gingival tissues harvested 0, 3, 6, 9, 12 and 18 days following insertion of ligature at low magnification (i - vii; 100X magnification used, representative scale bar in panel i is 100μm). (b) Representative MPO immunohistochemistry stained sections of gingival tissues harvested from all time points after ligature placement are shown at low (viii–xiv; 100X magnification used, representative scale bar in panel viii is 100μm) and high (xv-xxi; 400X magnification used, representative scale bar in panel xv is 50μm) magnifications. 1, the root of the first molar; 2, the root of the second molar; B=alveolar bone; G=gingival epithelium; Arrowheads mark MPO-positive cells. (c) Numbers of MPO-positive infiltrating cells (Neutrophils and Macrophage) at the ligature site between the 1st and 2sec molars at all time points. Results are expressed as the mean ± standard deviation (n=5 mice per group). **p<0.01 (One-way ANOVA and Bonferroni’s post hoc tests). Appropriate institutional regulatory board permission was obtained for these experiments. Researchers were blind to the groups mice were assigned to when counting the MPO positive cells.
Figure 4:
Figure 4:. The expression of innate and adaptive immune genes at different timepoints following insertion of ligature.
(a-c) Images show the procedure of gingival tissue collection. (a) Picture of mouse palatine with ligature placement between 1st and 2sec molars on the left side of teeth. (b) Picture of mouse palatine after removing of gingival tissue of the ligature side (c) Picture of collected gingival tissue surrounding the molars of ligature side. (d-h) Gene expression as assessed using the RT2 profiler PCR array. (d) Heat map analysis of mRNA expression profiles of innate and adaptive immune responses genes. As shown on the color bar, red represents up-regulated genes and green represents down regulated genes. The relative expression scale changed from 1 to 17 fold. The specific results seen for individual genes are shown in panels e-h, functionally categorized into Innate immunity associated genes (e), Pattern Recognition Receptors (f), Chemokines (g), and Adaptive immunity associated genes (h). The data are presented as the fold change of expression at the 3, 9 and 18 day time points compared to baseline. * p<0.05, **p<0.01 compared to baseline. Appropriate institutional regulatory board permission was obtained for these experiments.
Figure 5:
Figure 5:. Human bacteria induced alveolar bone loss and gingival tissue inflammation when using the ligature model in germ free mice.
(a) Diagram of Mono- and Co-infection experimental procedure. Ligature were placed into GF mice on day 0, and infected sequentially on day1 and 2. Ligature and maxilla were collected on day 10. (n=3 per group) (b-d), Number of Sg, Fn and Vp colonies on TSA-agar plates. Ligatures were removed 10 days following insertion into mice and after exposure to mono (b), double (c) or triple (d) infection (e) Representative 3-D MicroCT pictures from each group. The blue lines with double arrowheads indicate the distance between ABC-CEJ. (f) Distances from the cement enamel junction and alveolar bone crest (CEJ-ABC) 10 days following insertion of the ligature in control, mono and co-infection groups. (g) Representative HE and MPO Immunohistostaining sections of gingival tissues harvested from ligature side of control and each infection group (representative scale bars are shown in the left hand panel and are 100μm for the top and middle images and 20μm for the lower images). 1, the root of the first molar; 2, the root of the second molar; B=alveolar bone; G=gingival epithelium; Red Arrowheads mark MPO-positive cells in the gingival tissues. (h) Number of MPO positive cells 10 days following ligature placement for each group. N=3 in panels b, c, d, f and h. *p<0.05 (One-way ANOVA and Bonferroni’s post hoc tests). Appropriate institutional regulatory board permission was obtained for these experiments.

Similar articles

Cited by

References

    1. Hajishengallis G Immunomicrobial pathogenesis of periodontitis: keystones, pathobionts, and host response. Trends Immunol 35, 3–11, doi:10.1016/j.it.2013.09.001 (2014). - DOI - PMC - PubMed
    1. Hajishengallis G, Darveau RP & Curtis MA The keystone-pathogen hypothesis. Nat Rev Microbiol 10, 717–725, doi:10.1038/nrmicro2873 (2012). - DOI - PMC - PubMed
    1. Richards D Review finds that severe periodontitis affects 11% of the world population. Evid Based Dent 15, 70–71, doi:10.1038/sj.ebd.6401037 (2014). - DOI - PubMed
    1. Kassebaum NJ et al. Global burden of severe periodontitis in 1990–2010: a systematic review and meta-regression. Journal of dental research 93, 1045–1053, doi:10.1177/0022034514552491 (2014). - DOI - PMC - PubMed
    1. Eke PI, Dye BA, Wei L, Thornton-Evans GO & Genco RJ Prevalence of periodontitis in adults in the United States: 2009 and 2010. Journal of dental research 91, 914–920, doi:10.1177/0022034512457373 (2012). - DOI - PubMed

Publication types

LinkOut - more resources