. 2019 Jul;24(7):071603.
doi: 10.1117/1.JBO.24.7.071603.

Optical sampling depth in the spatial frequency domain

Affiliations

Optical sampling depth in the spatial frequency domain

Carole K Hayakawa et al. J Biomed Opt. 2019 Jul.

Abstract

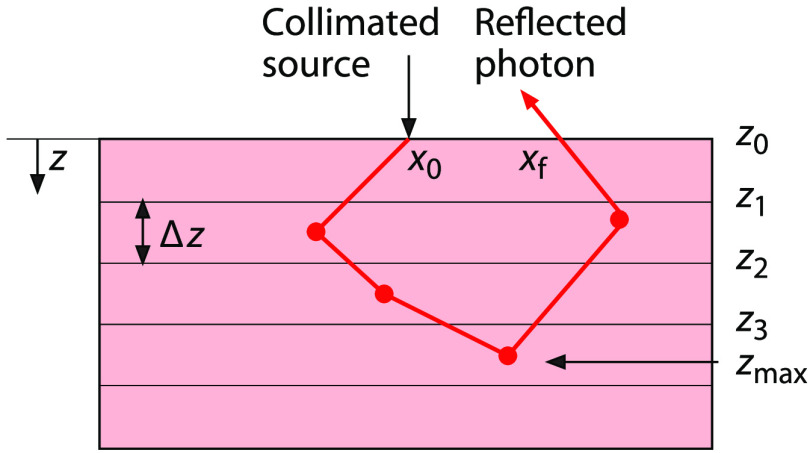
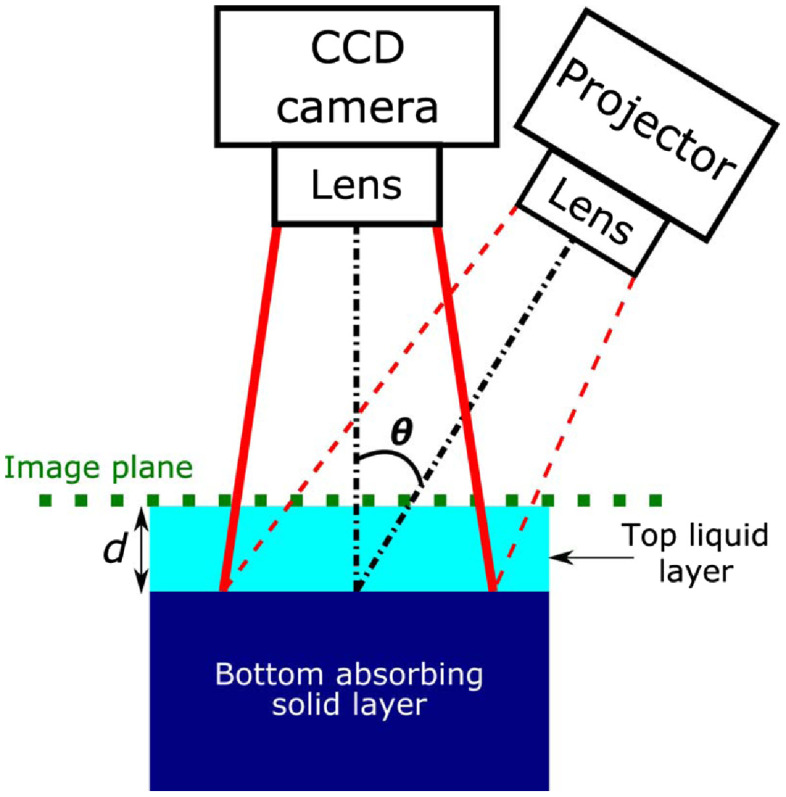
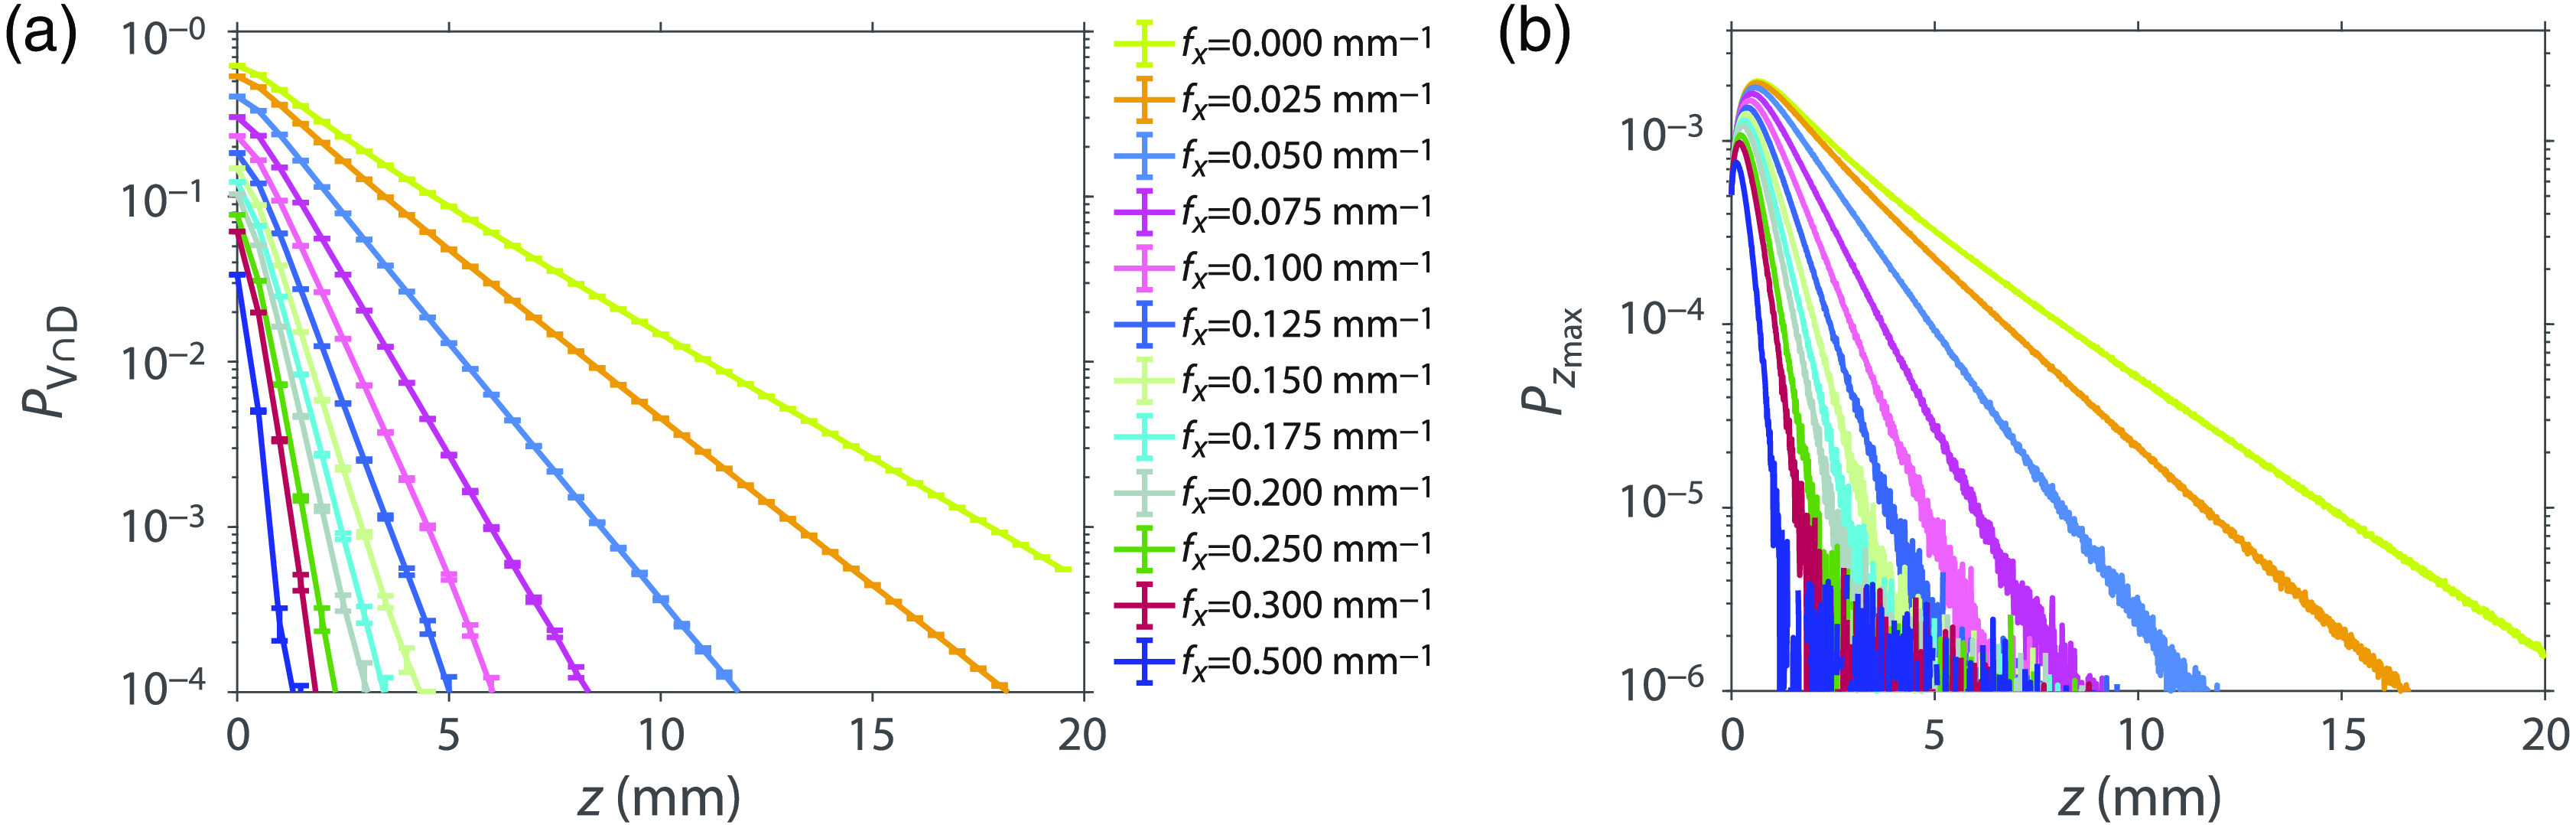
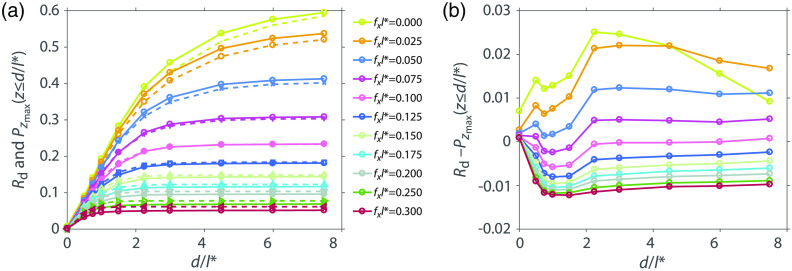
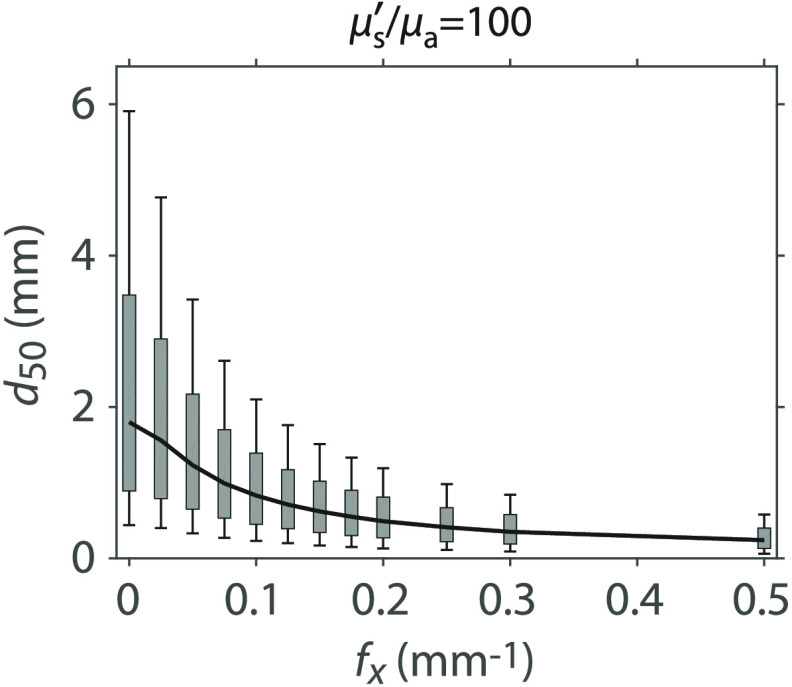
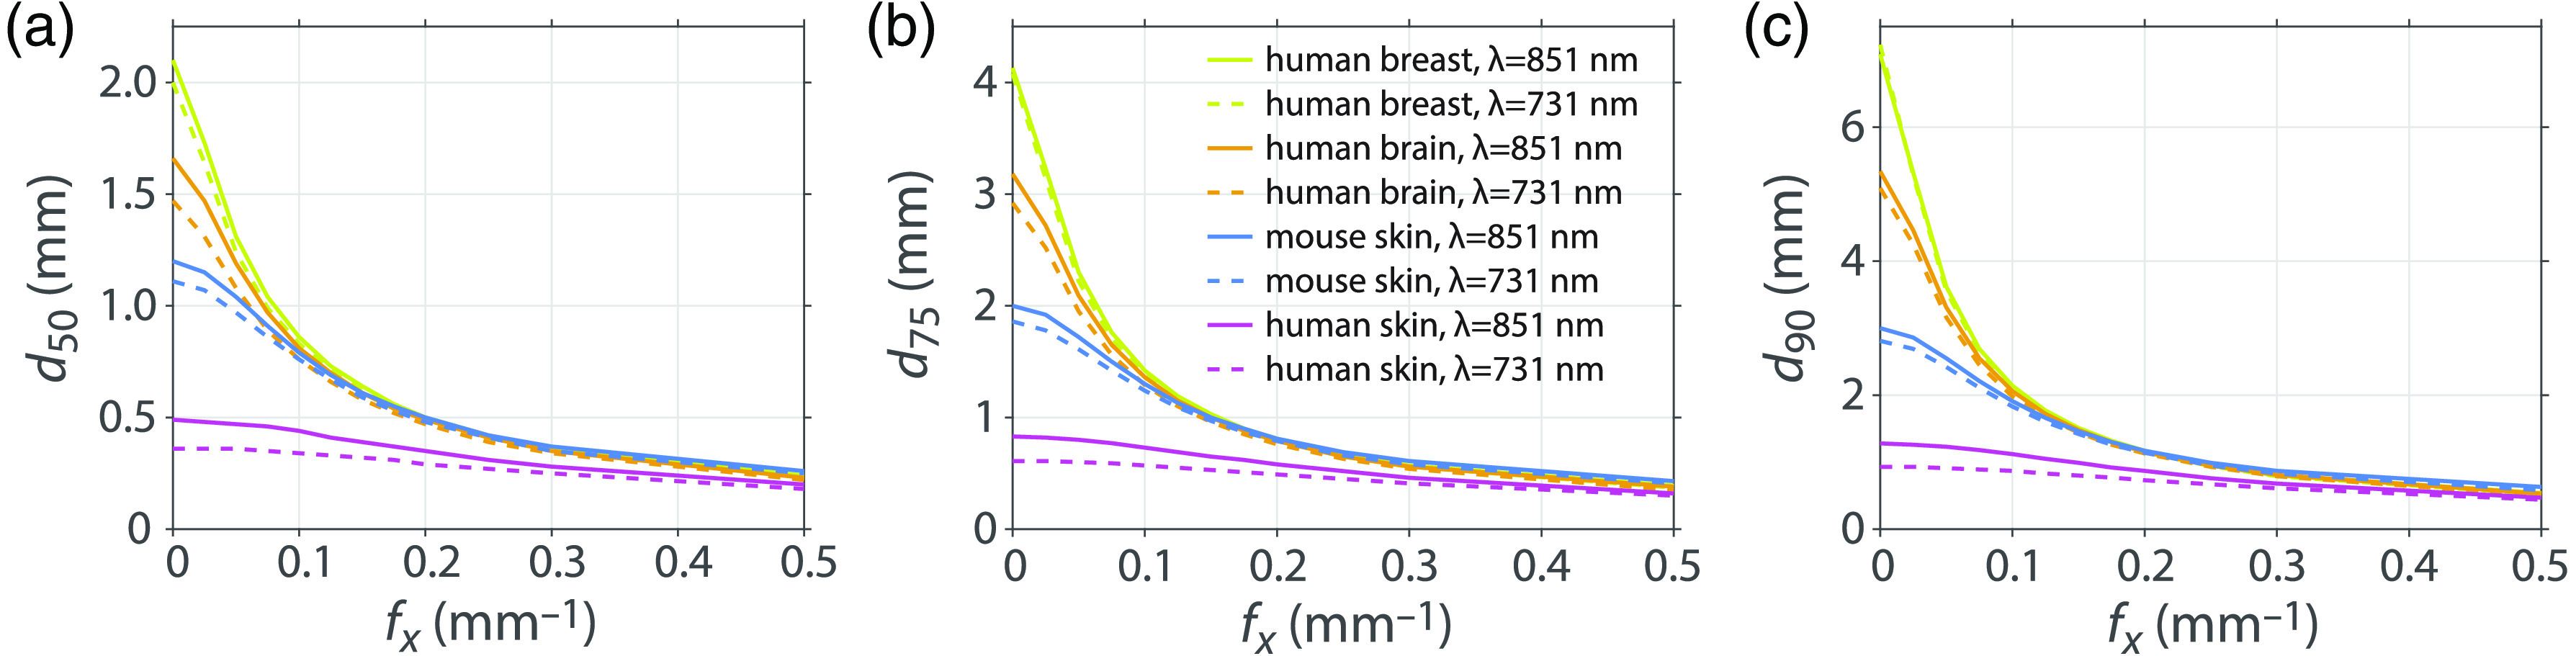
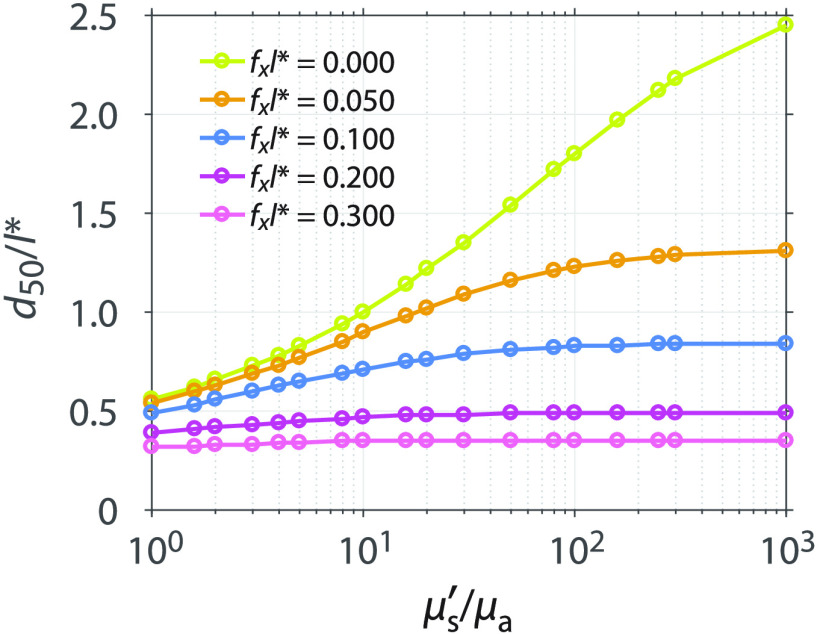
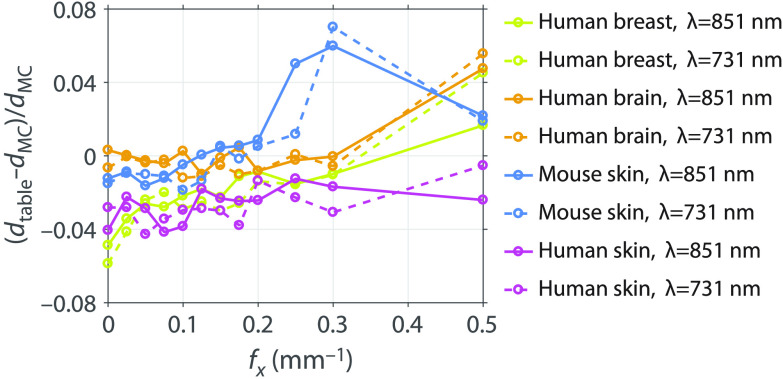
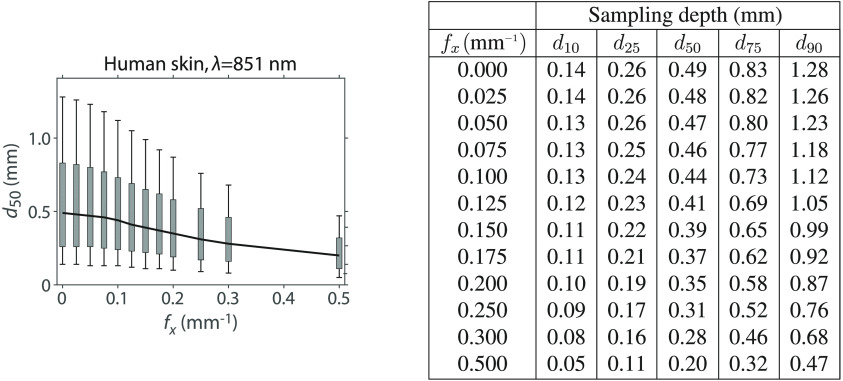
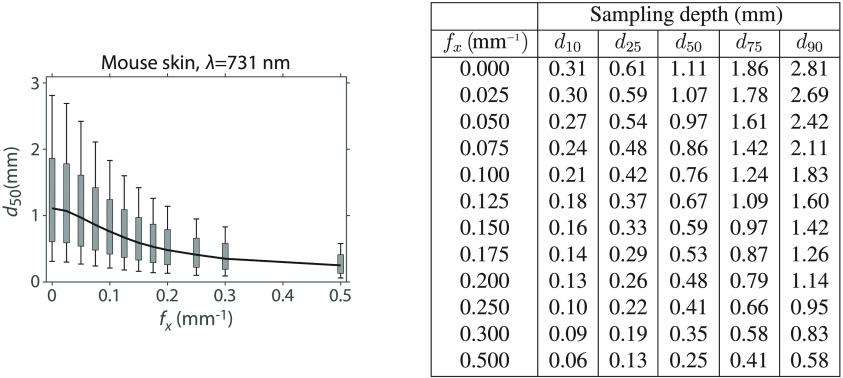
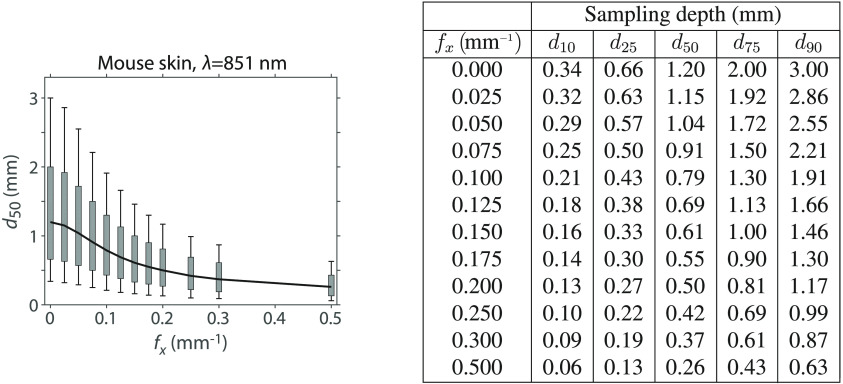
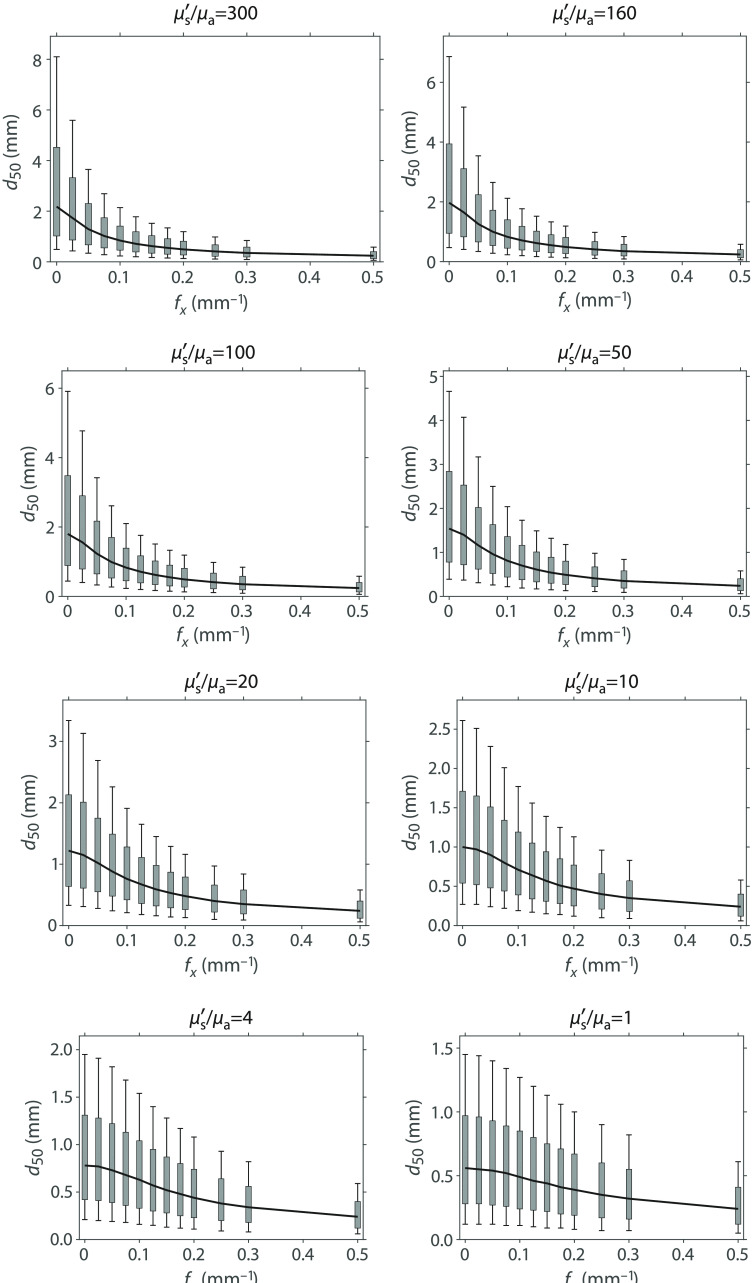
We present a Monte Carlo (MC) method to determine depth-dependent probability distributions of photon visitation and detection for optical reflectance measurements performed in the spatial frequency domain (SFD). These distributions are formed using an MC simulation for radiative transport that utilizes a photon packet weighting procedure consistent with the two-dimensional spatial Fourier transform of the radiative transport equation. This method enables the development of quantitative metrics for SFD optical sampling depth in layered tissue and its dependence on both tissue optical properties and spatial frequency. We validate the computed depth-dependent probability distributions using SFD measurements in a layered phantom system with a highly scattering top layer of variable thickness supported by a highly absorbing base layer. We utilize our method to establish the spatial frequency-dependent optical sampling depth for a number of tissue types and also provide a general tool to determine such depths for tissues of arbitrary optical properties.

Keywords: Monte Carlo simulation; diffuse optical spectroscopy; diffuse optics; photon migration; spatial frequency domain.


Figures

Fig. 1
Fig. 1
Schematic of an SFD PVD MC simulation within a tissue subdivided into layered surfaces.
Fig. 2
Fig. 2
Experimental setup and schematic of two-layer phantom with top layer thickness d varying from [07.5]l* where l*=2  mm. Theta (θ) is 15 deg. This experimental setup was used to acquire reflectance as a function of spatial frequency (fx) and layer thickness d. All measurements were performed at λ=731  nm.
Fig. 3
Fig. 3
(a) PVD(z) generated for media with optical properties μs/μa=100, l*=1  mm using fx=0,0.025,0.05,0.075,0.1,0.125,0.15,0.175,0.2,0.250,0.3,0.5  mm1 with 1σ error bars. Data were obtained at a Δz=0.01  mm. Data symbols are shown on this plot at z-intervals of 1 mm. (b) Pzmax(z) derived from PVD(z) distributions shown in (a).
Fig. 4
Fig. 4
(a) Experimentally measured and calibrated Rd (solid lines) and Pzmax(zd/l*) from simulation (dashed lines) and (b) their difference.
Fig. 5
Fig. 5
Median sampling depth (d50) with [25 to 75]% (gray rectangle) and [10 to 90]% (vertical-capped line) intervals versus fx for media with optical properties μs/μa=100 and l*=1  mm. Table of plot values are provided in Table 3.
Fig. 6
Fig. 6
(a) d50, (b) d75, (c) d90 sampling depths for human brain, mouse skin, human skin and human breast tissues at λ=851  nm (solid lines) and 731 nm (dashed lines).
Fig. 7
Fig. 7
Median sampling depth d50 normalized by the transport mean-free path l* as a function of μs/μa at spatial frequencies fxl*=0, 0.05, 0.1, 0.2, and 0.3. For clarity, results for only a subset of fx values are plotted here. Results for additional fx values are provided in the supplemental data.
Fig. 8
Fig. 8
Relative difference between the median depth determined by the lookup table of general optical properties and the median depth determined by running an MC simulation using the real tissue optical properties.
Fig. 9
Fig. 9
Median sampling depth (d50) with [25 to 75]% (gray rectangle) and [10 to 90]% (vertical-capped line) intervals versus fx and table of plot values for human breast at 731 nm.
Fig. 10
Fig. 10
Median sampling depth (d50) with [25 to 75]% (gray rectangle) and [10 to 90]% (vertical-capped line) intervals versus fx and table of plot values for human breast at 851 nm.
Fig. 11
Fig. 11
Median sampling depth (d50) with [25 to 75]% (gray rectangle) and [10 to 90]% (vertical-capped line) intervals versus fx and table of plot values for human brain at 731 nm.
Fig. 12
Fig. 12
Median sampling depth (d50) with [25 to 75]% (gray rectangle) and [10 to 90]% (vertical-capped line) intervals versus fx and table of plot values for human brain at 851 nm.
Fig. 13
Fig. 13
Median sampling depth (d50) with [25 to 75]% (gray rectangle) and [10 to 90]% (vertical-capped line) intervals versus fx and table of plot values for human skin at 731 nm.
Fig. 14
Fig. 14
Median sampling depth (d50) with [25 to 75]% (gray rectangle) and [10 to 90]% (vertical-capped line) intervals versus fx and table of plot values for human skin at 851 nm.
Fig. 15
Fig. 15
Median sampling depth (d50) with [25 to 5]% (gray rectangle) and [10 to 90]% (vertical-capped line) intervals versus fx and table of plot values for mouse skin at 731 nm.
Fig. 16
Fig. 16
Median sampling depth (d50) with [25 to 75]% (gray rectangle) and [10 to 90]% (vertical-capped line) intervals versus fx and table of plot values for mouse skin at 851 nm.
Fig. 17
Fig. 17
Median sampling depth (d50) with [25 to 75]% (gray rectangle) and [10 to 90]% (vertical-capped line) intervals versus fx for general tissue properties. Values of μs/μa plotted are a subset of those in the supplemental material.

Similar articles

Cited by

References

    1. Dognitz N., Wagnieres G., “Determination of tissue optical properties by steady-state spatial frequency-domain reflectometry,” Lasers Med. Sci. 13, 55–65 (1998).10.1007/BF00592960 - DOI
    1. Cuccia D. J., et al. , “Quantitative in vivo imaging of tissue absorption, scattering, and hemoglobin concentration in rat cortex using spatially modulated structured light,” Chapter 12 in In Vivo Optical Imaging of Brain Function, Frostig R. D., Ed., 2nd ed., CRC Press/Taylor & Francis, Boca Raton, Florida: (2009). - PubMed
    1. O’Sullivan T. D., et al. , “Diffuse optical imaging using spatially and temporally modulated light,” J. Biomed. Opt. 17(7), 071311 (2012).JBOPFO10.1117/1.JBO.17.7.071311 - DOI - PMC - PubMed
    1. Weiss G. H., Nossal R., Bonner R. F., “Statistics of penetration depth of photons re-emitted from irradiated tissue,” J. Mod. Opt. 36(3), 349–359 (1989).JMOPEW10.1080/09500348914550381 - DOI
    1. Sevick E. M., et al. , “Frequency domain imaging of absorbers obscured by scattering,” J. Photochem. Photobiol., B 16(2), 169–185 (1992).JPPBEG10.1016/1011-1344(92)80007-I - DOI - PubMed

Publication types