

Measuring the wall depletion length of nanoconfined DNA
- PMID: 30219022
- PMCID: PMC6135644
- DOI: 10.1063/1.5040458
Measuring the wall depletion length of nanoconfined DNA
Erratum in
-
Erratum: "Measuring the wall depletion length of nanoconfined DNA" [J. Chem. Phys. 149, 104901 (2018)].J Chem Phys. 2019 Jun 7;150(21):219901. doi: 10.1063/1.5108718. J Chem Phys. 2019. PMID: 31176330 Free PMC article. No abstract available.
Abstract
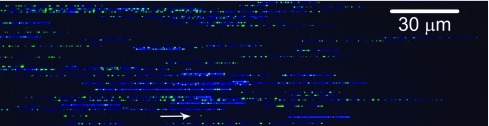
Efforts to study the polymer physics of DNA confined in nanochannels have been stymied by a lack of consensus regarding its wall depletion length. We have measured this quantity in 38 nm wide, square silicon dioxide nanochannels for five different ionic strengths between 15 mM and 75 mM. Experiments used the Bionano Genomics Irys platform for massively parallel data acquisition, attenuating the effect of the sequence-dependent persistence length and finite-length effects by using nick-labeled E. coli genomic DNA with contour length separations of at least 30 µm (88 325 base pairs) between nick pairs. Over 5 × 10⁶ measurements of the fractional extension were obtained from 39 291 labeled DNA molecules. Analyzing the stretching via Odijk's theory for a strongly confined wormlike chain yielded a linear relationship between the depletion length and the Debye length. This simple linear fit to the experimental data exhibits the same qualitative trend as previously defined analytical models for the depletion length but now quantitatively captures the experimental data.
Figures


Similar articles
-
Nanochannel confinement: DNA stretch approaching full contour length.Lab Chip. 2011 May 21;11(10):1721-9. doi: 10.1039/c0lc00680g. Epub 2011 Mar 23. Lab Chip. 2011. PMID: 21431167 Free PMC article.
-
Sequence-Dependent Persistence Length of Long DNA.Phys Rev Lett. 2017 Dec 1;119(22):227802. doi: 10.1103/PhysRevLett.119.227802. Epub 2017 Nov 29. Phys Rev Lett. 2017. PMID: 29286779 Free PMC article.
-
Transition between two regimes describing internal fluctuation of DNA in a nanochannel.PLoS One. 2011 Mar 15;6(3):e16890. doi: 10.1371/journal.pone.0016890. PLoS One. 2011. PMID: 21423606 Free PMC article.
-
DNA confinement in nanochannels: physics and biological applications.Rep Prog Phys. 2012 Oct;75(10):106601. doi: 10.1088/0034-4885/75/10/106601. Epub 2012 Sep 13. Rep Prog Phys. 2012. PMID: 22975868 Review.
-
Probing protein-DNA interactions and compaction in nanochannels.Curr Opin Struct Biol. 2024 Oct;88:102914. doi: 10.1016/j.sbi.2024.102914. Epub 2024 Aug 19. Curr Opin Struct Biol. 2024. PMID: 39163794 Review.
Cited by
-
Erratum: "Measuring the wall depletion length of nanoconfined DNA" [J. Chem. Phys. 149, 104901 (2018)].J Chem Phys. 2019 Jun 7;150(21):219901. doi: 10.1063/1.5108718. J Chem Phys. 2019. PMID: 31176330 Free PMC article. No abstract available.
-
Limitations of the equivalent neutral polymer assumption for theories describing nanochannel-confined DNA.Phys Rev E. 2020 Jan;101(1-1):012501. doi: 10.1103/PhysRevE.101.012501. Phys Rev E. 2020. PMID: 32069627 Free PMC article.
-
Extension distribution for DNA confined in a nanochannel near the Odijk regime.J Chem Phys. 2019 Sep 21;151(11):114903. doi: 10.1063/1.5121305. J Chem Phys. 2019. PMID: 31542006 Free PMC article.
-
Simulations corroborate telegraph model predictions for the extension distributions of nanochannel confined DNA.Biomicrofluidics. 2019 Aug 8;13(4):044110. doi: 10.1063/1.5109566. eCollection 2019 Jul. Biomicrofluidics. 2019. PMID: 31406555 Free PMC article.
-
Nanochannel-Confined TAMRA-Polypyrrole Stained DNA Stretching by Varying the Ionic Strength from Micromolar to Millimolar Concentrations.Polymers (Basel). 2018 Dec 22;11(1):15. doi: 10.3390/polym11010015. Polymers (Basel). 2018. PMID: 30959999 Free PMC article.
References
-
- Daoud M. and de Gennes P. G., “Statistics of macromolecular solutions trapped in small pores,” J. Phys. 38, 85–93 (1977).10.1051/jphys:0197700380108500 - DOI
-
- Odijk T., “The statistics and dynamics of confined or entangled stiff polymers,” Macromolecules 16, 1340–1344 (1983).10.1021/ma00242a015 - DOI
MeSH terms
Substances
Grants and funding
LinkOut - more resources
Full Text Sources
Other Literature Sources