

The increasing burden of diabetes and variations among the states of India: the Global Burden of Disease Study 1990-2016
- PMID: 30219315
- PMCID: PMC6227383
- DOI: 10.1016/S2214-109X(18)30387-5
The increasing burden of diabetes and variations among the states of India: the Global Burden of Disease Study 1990-2016
Abstract
Background: The burden of diabetes is increasing rapidly in India but a systematic understanding of its distribution and time trends is not available for every state of India. We present a comprehensive analysis of the time trends and heterogeneity in the distribution of diabetes burden across all states of India between 1990 and 2016.
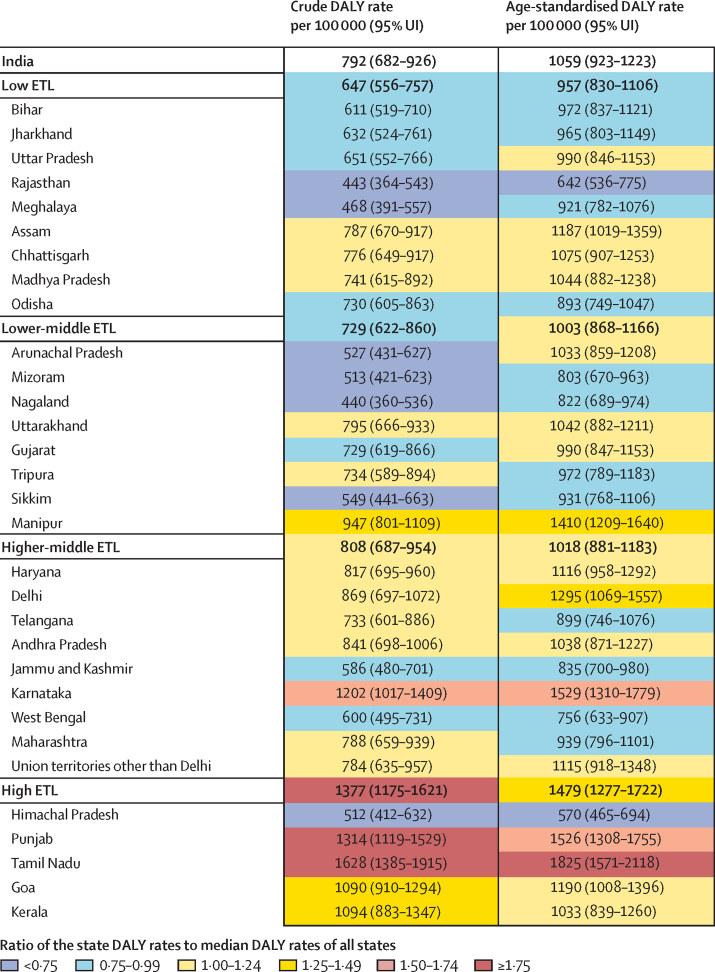
Methods: We analysed the prevalence and disability-adjusted life-years (DALYs) of diabetes in the states of India from 1990 to 2016 using all available data sources that could be accessed as part of the Global Burden of Diseases, Injuries, and Risk Factors Study 2016, and assessed heterogeneity across the states. The states were placed in four groups based on epidemiological transition level (ETL), defined on the basis of the ratio of DALYs from communicable diseases to those from non-communicable diseases and injuries combined, with a low ratio denoting high ETL and vice versa. We assessed the contribution of risk factors to diabetes DALYs and the relation of overweight (body-mass index 25 kg/m2 or more) with diabetes prevalence. We calculated 95% uncertainty intervals (UIs) for the point estimates.
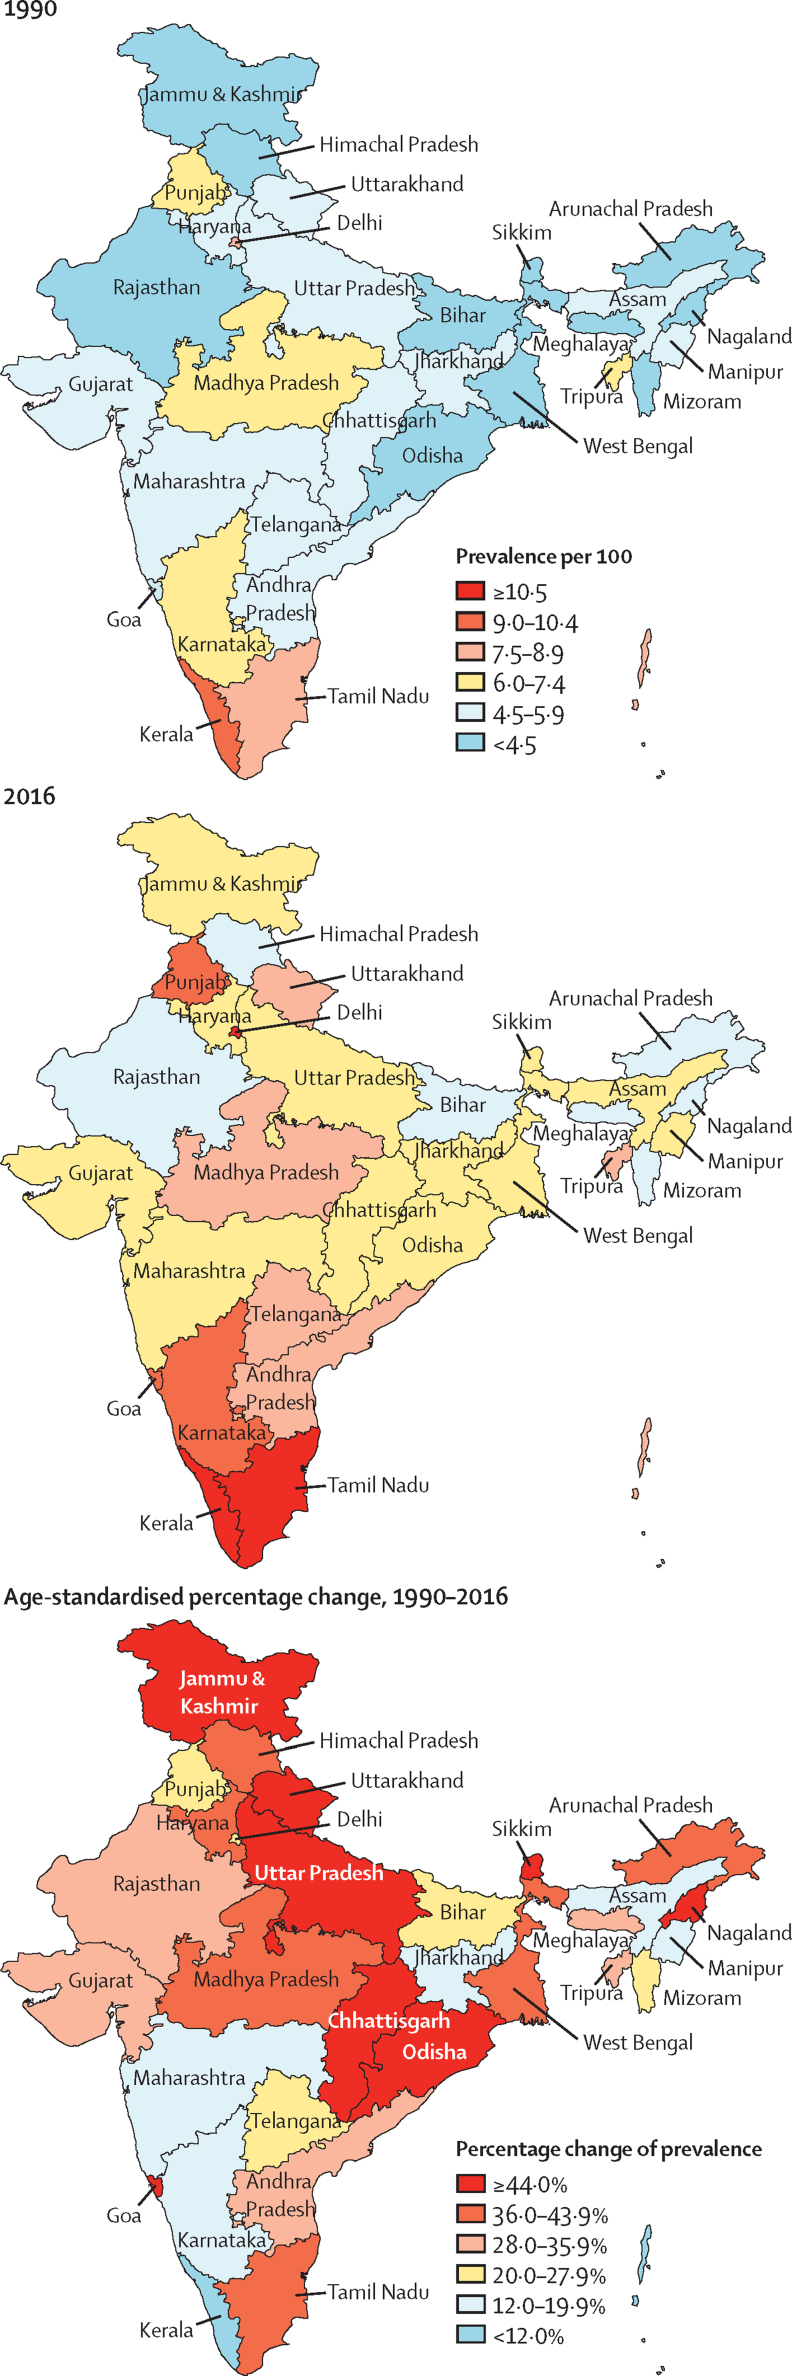
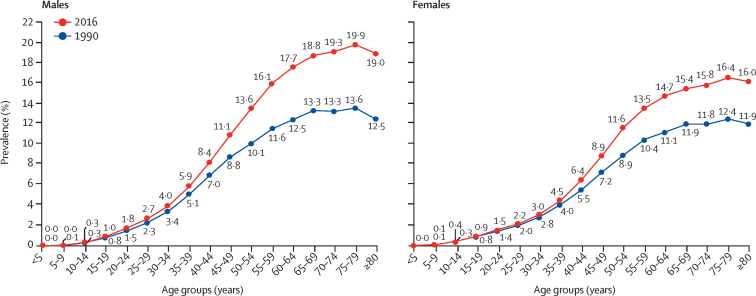
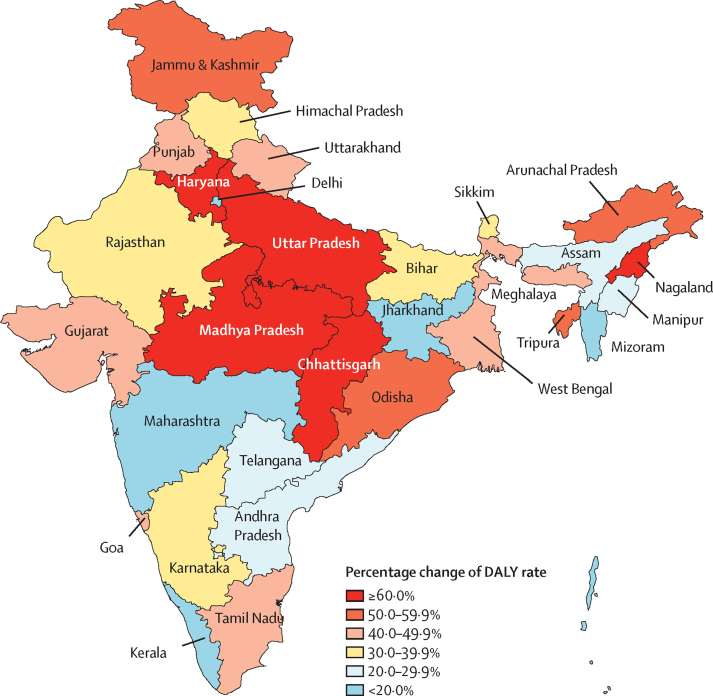
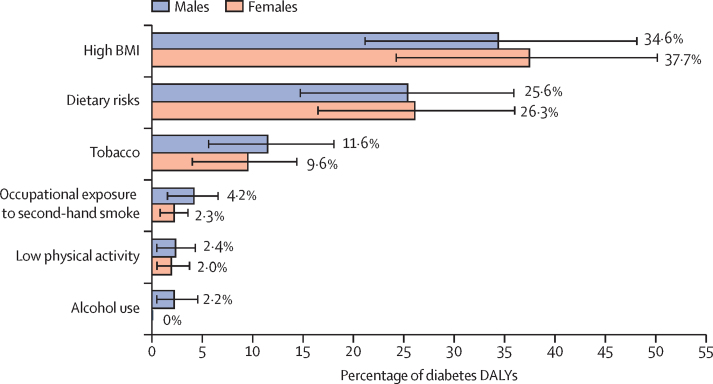
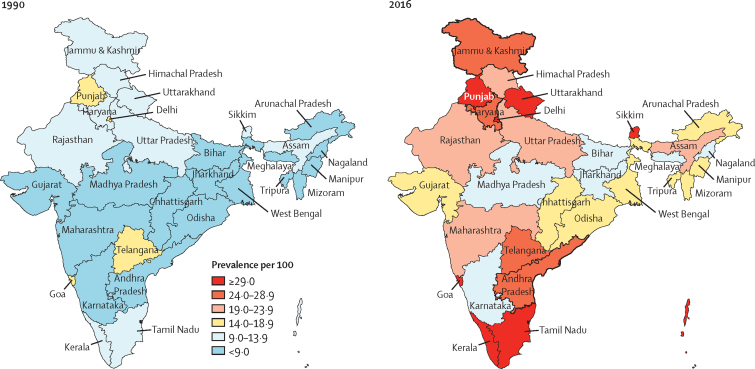
Findings: The number of people with diabetes in India increased from 26·0 million (95% UI 23·4-28·6) in 1990 to 65·0 million (58·7-71·1) in 2016. The prevalence of diabetes in adults aged 20 years or older in India increased from 5·5% (4·9-6·1) in 1990 to 7·7% (6·9-8·4) in 2016. The prevalence in 2016 was highest in Tamil Nadu and Kerala (high ETL) and Delhi (higher-middle ETL), followed by Punjab and Goa (high ETL) and Karnataka (higher-middle ETL). The age-standardised DALY rate for diabetes increased in India by 39·6% (32·1-46·7) from 1990 to 2016, which was the highest increase among major non-communicable diseases. The age-standardised diabetes prevalence and DALYs increased in every state, with the percentage increase among the highest in several states in the low and lower-middle ETL state groups. The most important risk factor for diabetes in India was overweight to which 36·0% (22·6-49·2) of the diabetes DALYs in 2016 could be attributed. The prevalence of overweight in adults in India increased from 9·0% (8·7-9·3) in 1990 to 20·4% (19·9-20·8) in 2016; this prevalence increased in every state of the country. For every 100 overweight adults aged 20 years or older in India, there were 38 adults (34-42) with diabetes, compared with the global average of 19 adults (17-21) in 2016.
Interpretation: The increase in health loss from diabetes since 1990 in India is the highest among major non-communicable diseases. With this increase observed in every state of the country, and the relative rate of increase highest in several less developed low ETL states, policy action that takes these state-level differences into account is needed urgently to control this potentially explosive public health situation.
Funding: Bill & Melinda Gates Foundation; and Indian Council of Medical Research, Department of Health Research, Ministry of Health and Family Welfare, Government of India.
Copyright © 2018 The Author(s). Published by Elsevier Ltd. This is an Open Access article under the CC BY 4.0 license. Published by Elsevier Ltd.. All rights reserved.
Figures
Comment in
-
India's escalating burden of non-communicable diseases.Lancet Glob Health. 2018 Dec;6(12):e1262-e1263. doi: 10.1016/S2214-109X(18)30448-0. Epub 2018 Oct 3. Lancet Glob Health. 2018. PMID: 30292427 No abstract available.
-
The burden of diabetes in India.Lancet Glob Health. 2019 Apr;7(4):e418. doi: 10.1016/S2214-109X(18)30556-4. Lancet Glob Health. 2019. PMID: 30879507 No abstract available.
References
-
- International Diabetes Federation . 8th edn. International Diabetes Federation; 2017. IDF Diabetes Atlas.http://diabetesatlas.org/resources/2017-atlas.html
-
- WHO . World Health Organization; Geneva: 2016. Global report on diabetes.
-
- Institute for Health Metrics and Evaluation GBD compare data visualization. http://vizhub.healthdata.org/gbd-compare
-
- United Nations General Assembly Resolution adopted by the General Assembly on 27 July 2012: the future we want (A/RES/66/288) Sept 11, 2012. http://www.un.org/ga/search/view_doc.asp?symbol=A/RES/66/288&Lang=E
-
- WHO Global action plan for the prevention and control of noncommunicable diseases: 2013–2020. 2013. http://apps.who.int/iris/bitstream/10665/94384/1/9789241506236_eng.pdf
Publication types
MeSH terms
LinkOut - more resources
Full Text Sources
Other Literature Sources
Medical
