

The burden of cancers and their variations across the states of India: the Global Burden of Disease Study 1990-2016
- PMID: 30219626
- PMCID: PMC6167407
- DOI: 10.1016/S1470-2045(18)30447-9
The burden of cancers and their variations across the states of India: the Global Burden of Disease Study 1990-2016
Erratum in
-
Correction to Lancet Oncol 2018; 19: 1289-306.Lancet Oncol. 2018 Nov;19(11):e581. doi: 10.1016/S1470-2045(18)30748-4. Epub 2018 Oct 3. Lancet Oncol. 2018. PMID: 30292527 Free PMC article. No abstract available.
Abstract
Background: Previous efforts to report estimates of cancer incidence and mortality in India and its different parts include the National Cancer Registry Programme Reports, Sample Registration System cause of death findings, Cancer Incidence in Five Continents Series, and GLOBOCAN. We present a comprehensive picture of the patterns and time trends of the burden of total cancer and specific cancer types in each state of India estimated as part of the Global Burden of Diseases, Injuries, and Risk Factors Study (GBD) 2016 because such a systematic compilation is not readily available.
Methods: We used all accessible data from multiple sources, including 42 population-based cancer registries and the nationwide Sample Registration System of India, to estimate the incidence of 28 types of cancer in every state of India from 1990 to 2016 and the deaths and disability-adjusted life-years (DALYs) caused by them, as part of GBD 2016. We present incidence, DALYs, and death rates for all cancers together, and the trends of all types of cancers, highlighting the heterogeneity in the burden of specific types of cancers across the states of India. We also present the contribution of major risk factors to cancer DALYs in India.
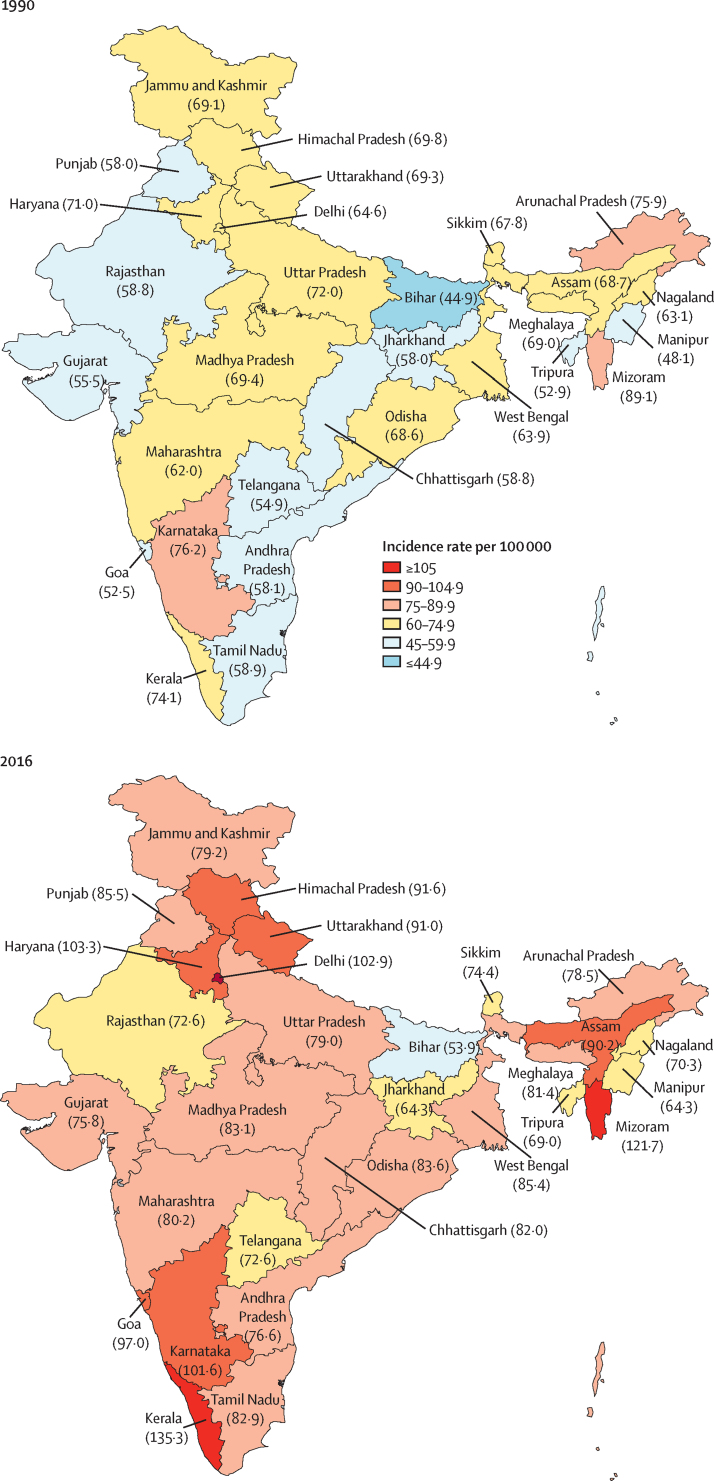
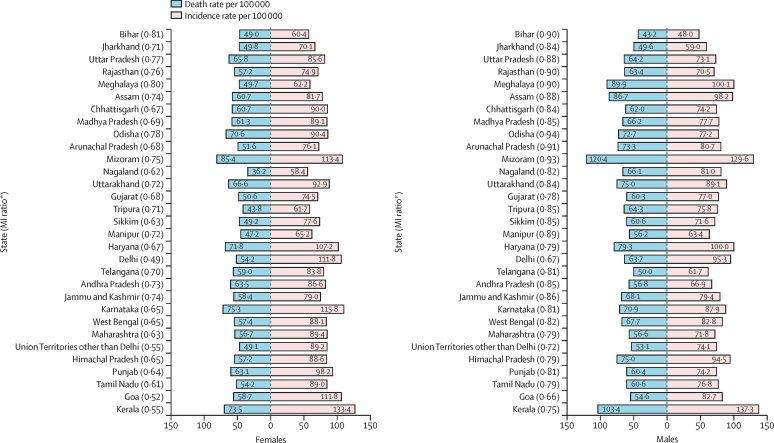
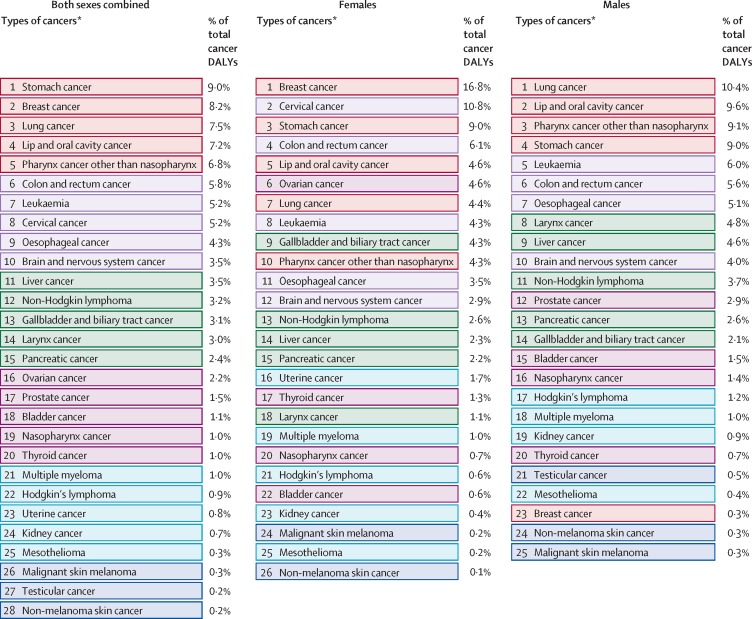
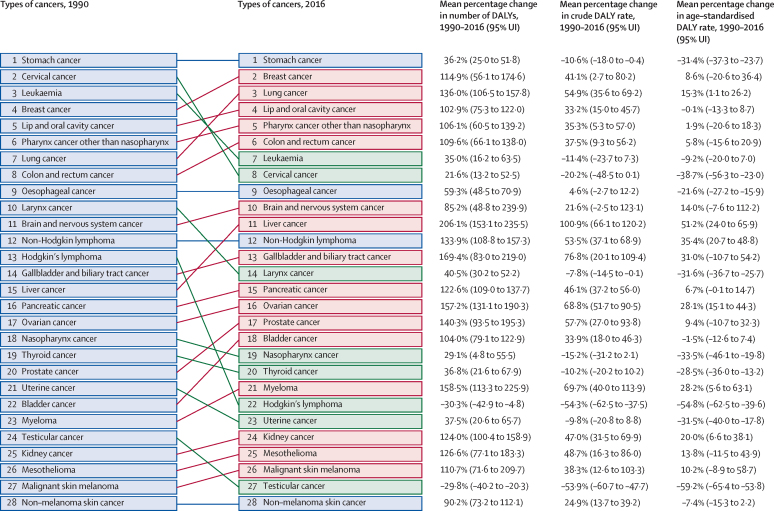
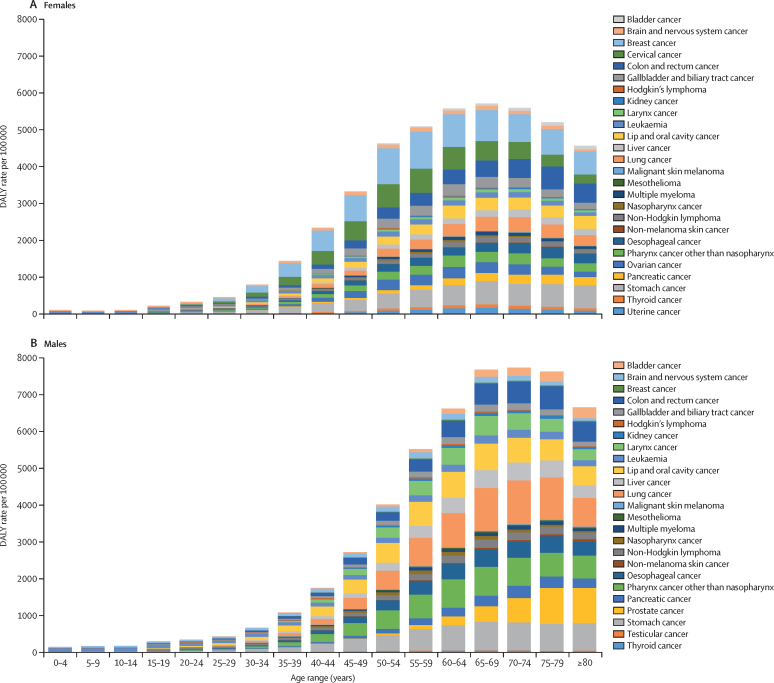
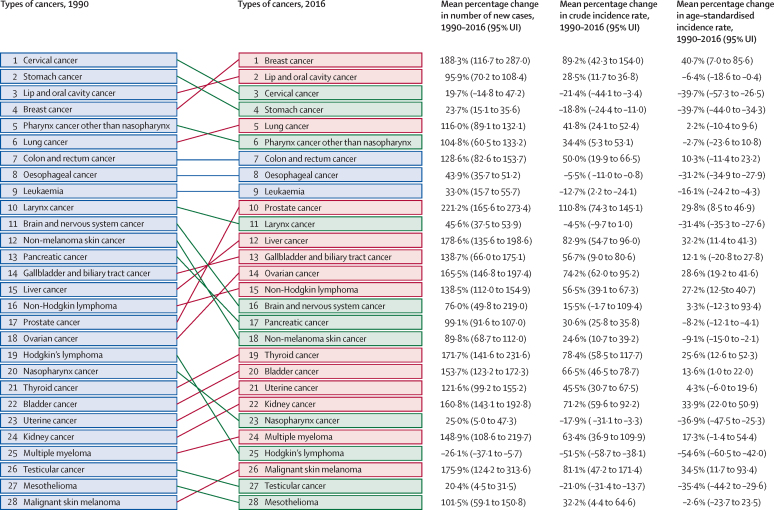
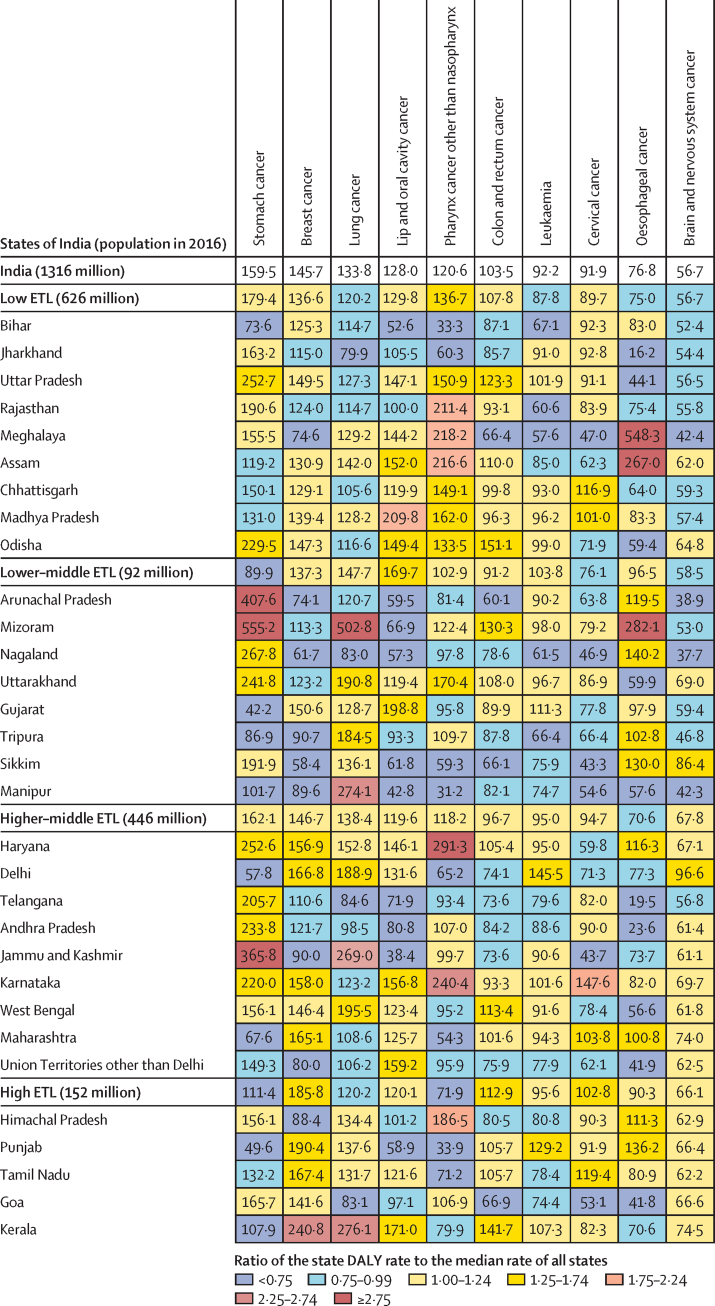
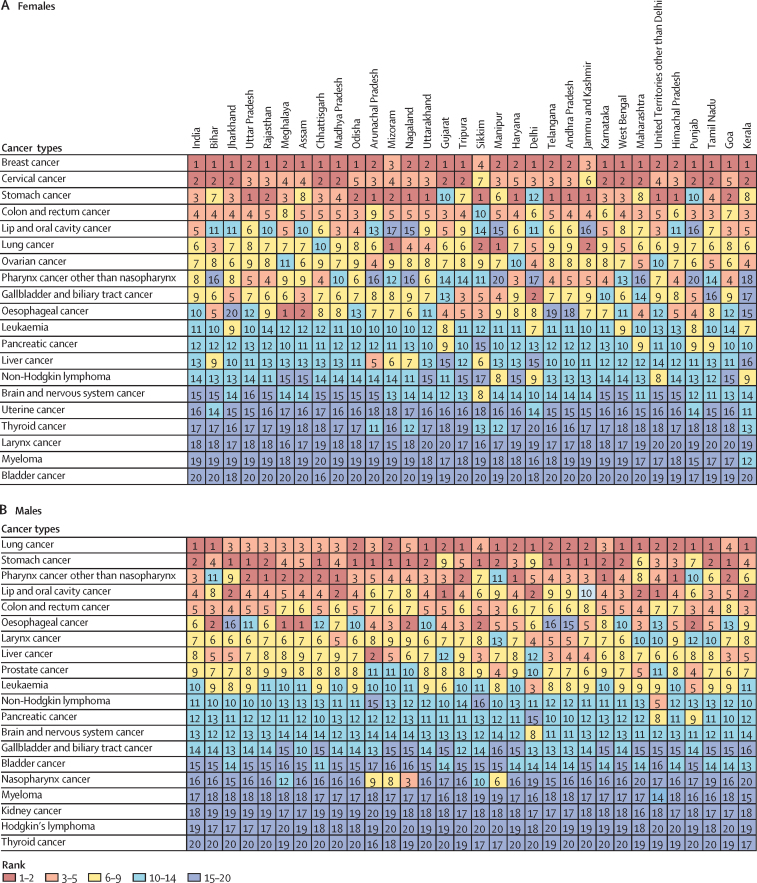
Findings: 8·3% (95% uncertainty interval [UI] 7·9-8·6) of the total deaths and 5·0% (4·6-5·5) of the total DALYs in India in 2016 were due to cancer, which was double the contribution of cancer in 1990. However, the age-standardised incidence rate of cancer did not change substantially during this period. The age-standardised cancer DALY rate had a 2·6 times variation across the states of India in 2016. The ten cancers responsible for the highest proportion of cancer DALYs in India in 2016 were stomach (9·0% of the total cancer DALYs), breast (8·2%), lung (7·5%), lip and oral cavity (7·2%), pharynx other than nasopharynx (6·8%), colon and rectum (5·8%), leukaemia (5·2%), cervical (5·2%), oesophageal (4·3%), and brain and nervous system (3·5%) cancer. Among these cancers, the age-standardised incidence rate of breast cancer increased significantly by 40·7% (95% UI 7·0-85·6) from 1990 to 2016, whereas it decreased for stomach (39·7%; 34·3-44·0), lip and oral cavity (6·4%; 0·4-18·6), cervical (39·7%; 26·5-57·3), and oesophageal cancer (31·2%; 27·9-34·9), and leukaemia (16·1%; 4·3-24·2). We found substantial inter-state heterogeneity in the age-standardised incidence rate of the different types of cancers in 2016, with a 3·3 times to 11·6 times variation for the four most frequent cancers (lip and oral, breast, lung, and stomach). Tobacco use was the leading risk factor for cancers in India to which the highest proportion (10·9%) of cancer DALYs could be attributed in 2016.
Interpretation: The substantial heterogeneity in the state-level incidence rate and health loss trends of the different types of cancer in India over this 26-year period should be taken into account to strengthen infrastructure and human resources for cancer prevention and control at both the national and state levels. These efforts should focus on the ten cancers contributing the highest DALYs in India, including cancers of the stomach, lung, pharynx other than nasopharynx, colon and rectum, leukaemia, oesophageal, and brain and nervous system, in addition to breast, lip and oral cavity, and cervical cancer, which are currently the focus of screening and early detection programmes.
Funding: Bill & Melinda Gates Foundation; and Indian Council of Medical Research, Department of Health Research, Ministry of Health and Family Welfare, Government of India.
Copyright © 2018 The Author(s). Published by Elsevier Ltd. This is an Open Access article under the CC BY 4.0 license. Published by Elsevier Ltd.. All rights reserved.
Figures
Comment in
-
Cancer trends and disparities in India: data needs for providing equitable cancer care.Lancet Oncol. 2018 Oct;19(10):1260-1261. doi: 10.1016/S1470-2045(18)30563-1. Epub 2018 Sep 12. Lancet Oncol. 2018. PMID: 30219627 No abstract available.
-
Cancer trends and burden in India.Lancet Oncol. 2018 Dec;19(12):e660. doi: 10.1016/S1470-2045(18)30708-3. Lancet Oncol. 2018. PMID: 30507420 No abstract available.
-
Cancer trends and burden in India.Lancet Oncol. 2018 Dec;19(12):e662. doi: 10.1016/S1470-2045(18)30755-1. Lancet Oncol. 2018. PMID: 30507422 No abstract available.
-
Cancer trends and burden in India.Lancet Oncol. 2018 Dec;19(12):e663. doi: 10.1016/S1470-2045(18)30839-8. Lancet Oncol. 2018. PMID: 30507423 No abstract available.
-
Cancer trends and burden in India - Authors' response.Lancet Oncol. 2018 Dec;19(12):e664. doi: 10.1016/S1470-2045(18)30857-X. Lancet Oncol. 2018. PMID: 30507424 No abstract available.
References
-
- GBD 2016 Cancer Collaborators Global, regional, and national cancer incidence, mortality, years of life lost, years lived with disability, and disability-adjusted life-years for 29 cancer groups, 1990 to 2016: a systematic analysis for the Global Burden of Disease study. JAMA Oncol. 2018 doi: 10.1001/jamaoncol.2018.2706. published online June 2. - DOI - PMC - PubMed
-
- Chalkidou K, Marquez P, Dhillon PK. Evidence-informed frameworks for cost-effective cancer care and prevention in low, middle, and high-income countries. Lancet Oncol. 2014;15:e119–e131. - PubMed
-
- International Agency for Research on Cancer. World Health Organization CI5plus–cancer incidence in five continents time trends. http://ci5.iarc.fr/CI5plus/Default.aspx
Publication types
MeSH terms
LinkOut - more resources
Full Text Sources
Other Literature Sources
