. 2019 Apr;17(4):762-775.
doi: 10.1111/pbi.13013. Epub 2018 Oct 18.

Resequencing core accessions of a pedigree identifies derivation of genomic segments and key agronomic trait loci during cotton improvement

Affiliations

Resequencing core accessions of a pedigree identifies derivation of genomic segments and key agronomic trait loci during cotton improvement

Xiongfeng Ma et al. Plant Biotechnol J. 2019 Apr.

Abstract

Upland cotton (Gossypium hirsutum) is the world's largest source of natural fibre and dominates the global textile industry. Hybrid cotton varieties exhibit strong heterosis that confers high fibre yields, yet the genome-wide effects of artificial selection that have influenced Upland cotton during its breeding history are poorly understood. Here, we resequenced Upland cotton genomes and constructed a variation map of an intact breeding pedigree comprising seven elite and 19 backbone parents. Compared to wild accessions, the 26 pedigree accessions underwent strong artificial selection during domestication that has resulted in reduced genetic diversity but stronger linkage disequilibrium and higher extents of selective sweeps. In contrast to the backbone parents, the elite parents have acquired significantly improved agronomic traits, with an especially pronounced increase in the lint percentage. Notably, identify by descent (IBD) tracking revealed that the elite parents inherited abundant beneficial trait segments and loci from the backbone parents and our combined analyses led to the identification of a core genomic segment which was inherited in the elite lines from the parents Zhong 7263 and Ejing 1 and that was strongly associated with lint percentage. Additionally, SNP correlation analysis of this core segment showed that a non-synonymous SNP (A-to-G) site in a gene encoding the cell wall-associated receptor-like kinase 3 (GhWAKL3) protein was highly correlated with increased lint percentage. Our results substantially increase the valuable genomics resources available for future genetic and functional genomics studies of cotton and reveal insights that will facilitate yield increases in the molecular breeding of cotton.

Keywords: cotton pedigree; identity by descent (IBD); lint percentage; modern cotton improvement; resequencing.


Conflict of interest statement

The authors declare no competing financial interests.

Figures
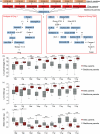
Figure 1
Figure 1
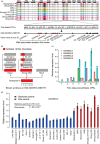
Pedigree of the elite cotton cultivar Ekangmian 9, and statistical analysis of lint percentage, lint index and seed index of the pedigrees in four different locations. (a) Seven elite strains (red) were derived from Ekangmian 9. These elite strains were used as elite parents to breed several hybrid cotton varieties (bright orange). Seven elite parents and 19 backbone parents (blue) were selected for resequencing in this study. Analysis of (b) lint percentage (%), (c) lint index (grams) and (d) seed index (grams) of backbone and elite parents of the cotton harvested from nine environments in China. Dark red and grey indicate elite and backbone parents, respectively. Centre lines indicate medians; box limits represent upper and lower quartiles; and whiskers delineate 1.5× the interquartile range (*P < 0.05, **P < 0.01, two‐sided t‐test).
Figure 2
Figure 2
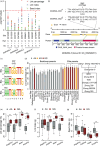
SNP distribution and population diversity between wild and pedigree cotton accessions. (a) SNP density in 27 allotetraploid cotton genomes. The 26 allotetraploid cotton chromosomes, A1–D13, are indicated on the vertical axis. Horizontal curves indicate the density of SNP loci, with the minimum set to 0. The axis of abscissa designates chromosome size in the curves. (b) Phylogenetic analysis of wild type and pedigree groups. The neighbour‐joining tree was constructed using whole genome SNPs from the wild (31 accessions) and pedigree groups (27 accessions or strains). (c) Nucleotide diversity (π) and population divergence (Fst) among the three groups. The value in each circle and line represent nucleotide diversity and population divergence, respectively. The measure of nucleotide diversity for both wild and Chinese groups, and the value population divergence between the two groups were cited from recently published results (Wang et al., 2017). (d) Decay of linkage disequilibrium (LD) in the sub‐genome of each group.
Figure 3
Figure 3
Genome flow of Ejing 1 and Zhong 7263. (a) Specific fragments collected in Ejing 1. (b) Specific fragments collected in Zhong 7263. Different colors represent different parents, and the corresponding color of each parent is noted on the vertical axis (left) together with the genetic pathway. The horizontal axis (top) indicates different chromosomes, A1–D13. Unique genetic segments in each parent are specifically passed according to the genetic pathway shown on the vertical axis.
Figure 4
Figure 4
Genome flow of Ekangmian 9. Different colors represent different parents, and the corresponding color of each parent is noted on the vertical axis (left) together with the genetic pathway. The horizontal axis (top) indicates different chromosomes, A1–D13. Unique genetic segments in each parent are specifically passed to Ekangmian 9 according to the genetic pathway shown on the vertical axis.
Figure 5
Figure 5
Identification of core genetic fragments and candidate genes related to fibre development. (a) Identification of core genetic fragments inherited from Ekangmian 9 in seven elite parents. Different colors corresponding to each parent are labelled on the vertical axis. D02:2204597‐2360776, a key candidate section containing nine QTLs. Arrows indicate genes located within this fragment. (b) Genetic tracking analysis of key candidate IBD segments (red). The segment was divided into 11 equal windows in length. (c) Quantitative RTPCR (qRTPCR) analysis of four cell wall related WAKL genes in TM‐1. Three biological and technical replicates were performed for qRTPCR experiments, and the error bars represent the mean values ± SE. Expression levels are relative to cotton HIS3. (d) Quantitative RTPCR (qRTPCR) analysis of GhWAKL3 between backbone parents and elite parents (**P < 0.01, two‐sided t‐test).
Figure 6
Figure 6
The GG genotype of GhWAKL3 is a dominant mutation related to fibre development. (a) Correlation analysis between yield traits and non‐synonymous mutations present in candidate GhWAKL genes. Red dots, blue dots and green dots represent lint percentage, lint index and seed index, respectively. The x axis indicates the corresponding variation type, and the y axis represents the significance expressed as −log10 P. (b) Gene structure of GhWAKL3 and the allelic variation identified within the pedigree. One non‐synonymous SNPs,resulting in an amino acid change from leucine to proline in the protein kinase domain of GhWAKL3, were shown to be associated with the GWAS signals for both higher lint yield and lint index. (c) Sequence logos of the non‐synonymous SNP site in the protein kinase domain of GhWAKL3. (d) Analysis of lint percentage of different genotypes of GhWAKL3. The x axis shows the different accessions. The genetic relationship between elite parents and their core parents (Ekangmian 9, Ejing 1, Zhong 7263, MO‐3) is displayed on the right. (e) Lint percentage (%), (f) Lint index (grams) and (g) seed index (grams) analyses of accessions with AA and GG genotypes. Centre line, median; box limits, upper and lower quartiles; whiskers, 1.5× the interquartile range (*P < 0.05, **P < 0.01, two‐sided t‐test).

Similar articles

Cited by

References

    1. Bradbury, P.J. , Zhang, Z. , Kroon, D.E. , Casstevens, T.M. , Ramdoss, Y. and Buckler, E.S. (2007) TASSEL: software for association mapping of complex traits in diverse samples. Bioinformatics 23, 2633–2635. - PubMed
    1. Brubaker, C.L. , Bourland, F. and Wendel, J.F. (1999) The origin and domestication of cotton. In Cotton: Origin, history, technology, and production ( Wayne Smith, C. , and Tom Cothren, J. , eds), pp. 3–31. New York, NY: John Wiley & Sons.
    1. Campbell, B.T. , Saha, S. , Percy, R. , Frelichowski, J. , Jenkins, J.N. , Park, W. , Mayee, C.D. et al. (2010) Status of the global cotton germplasm resources. Crop Sci. 50, 1161.
    1. Chen, Z.J. , Scheffler, B.E. , Dennis, E. , Triplett, B.A. , Zhang, T. , Guo, W. , Chen, X. et al. (2007) Toward sequencing cotton (Gossypium) genomes. Plant Physiol. 145, 1303–1310. - PMC - PubMed
    1. Chen, C. , Liu, Z. , Pan, Q. , Chen, X. , Wang, H. , Guo, H. , Liu, S. et al. (2016) Genomic analyses reveal demographic history and temperate adaptation of the newly discovered honey bee subspecies apis mellifera sinisxinyuan n. ssp. Mol. Biol. Evol. 33, 1337–1348. - PMC - PubMed

Publication types

LinkOut - more resources