. 2018 Sep 20;175(1):254-265.e14.
doi: 10.1016/j.cell.2018.08.030. Epub 2018 Sep 13.

A Novel Class of ER Membrane Proteins Regulates ER-Associated Endosome Fission

Affiliations

A Novel Class of ER Membrane Proteins Regulates ER-Associated Endosome Fission

Melissa J Hoyer et al. Cell. .

Abstract

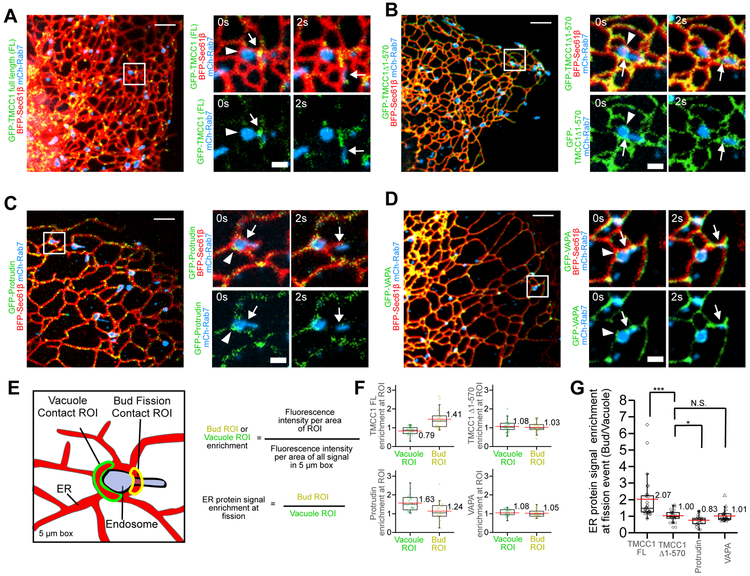
Endoplasmic reticulum (ER) membrane contact sites (MCSs) mark positions where endosomes undergo fission for cargo sorting. To define the role of ER at this unique MCS, we targeted a promiscuous biotin ligase to cargo-sorting domains on endosome buds. This strategy identified the ER membrane protein TMCC1, a member of a conserved protein family. TMCC1 concentrates at the ER-endosome MCSs that are spatially and temporally linked to endosome fission. When TMCC1 is depleted, endosome morphology is normal, buds still form, but ER-associated bud fission and subsequent cargo sorting to the Golgi are impaired. We find that the endosome-localized actin regulator Coronin 1C is required for ER-associated fission of actin-dependent cargo-sorting domains. Coronin 1C is recruited to endosome buds independently of TMCC1, while TMCC1/ER recruitment requires Coronin 1C. This link between TMCC1 and Coronin 1C suggests that the timing of TMCC1-dependent ER recruitment is tightly regulated to occur after cargo has been properly sequestered into the bud.

Keywords: endoplasmic reticulum; endosome fission; endosome recycling; membrane contact site.


Figures

Figure 1.
Figure 1.. A targeted BioID strategy to identify the ER-endosome MCS protein TMCC1.
(A) Merged image of a live Cos7 cell expressing BFP-Sec61β (ER in green), mCh-Rab7 (late endosome, LE in red) and GFP-BioID-Fam21 (bud in cyan). (B) Magnified time-lapse images of the region boxed in (A) shows an example of endosome bud fission. Note that GFP-BioID-Fam21 (yellow arrowheads) correctly localizes to the sorting domain at the position of ER-associated fission. (C) Merged image of a Cos7 cell expressing BFP-KDEL (ER in gray), mCh-Rab7 (red) and GFP-BioID-Fam21 (green) treated with 50μM biotin for 1 hour and then probed for biotinylation using Streptavidin-647 (cyan). (D) Magnified images of the region boxed in (C). Note that GFP-BioID-Fam21 localizes to neck of the bud at an ER MCS labeled by biotin (white arrowhead). (E) Strategy used in HeLa cells to biotinylate ER-endosome bud MCS proteins following transfection with GFP-BioID-Fam21 versus controls: GFP-Fam21 “mock” condition or myc-BioID-Rab7 (F) Differential centrifugation yielded a final 20,000×g pellet that was enriched for ER proteins and was depleted of nuclei, mitochondria, and cytoplasm (fractions were analyzed by immuno-blot (IB) for Rtn-3 (ER), tubulin (cytosol), LE (Rab7), and Tom20 (mitochondria). (G) The 20,000×g pellets were solubilized, bound and eluted from streptavidin beads, and probed with Streptavidin HRP to reveal biotinylation profiles for each sample. Asterisks denote a band size indicative of construct self biotinylation. (H) List of eluted proteins identified using mass spectrometry. Note: TMCC1 was enriched in the GFP-BioID-Fam21 elution. (I) The relative fluorescence intensity of internalized anti-CI-MPR antibody by immuno-staining reveals reduced trafficking of internalized anti-CI-MPR to TGN in Cos7 cells treated with TMCC1 siRNA, FAM21 siRNA, and VPS35 siRNA relative to control siRNA. Smaller insets show Golgi localization by staining with anti-Giantin antibody. (J) The ratio between fluorescence intensity in vesicular structures (outside of the square) relative to that of the TGN (inside the square) was measured for control siRNA, TMCC1 siRNA, FAM21 siRNA, and VPS35 siRNA treated cells (averages 2.1, 4.4, 4.9, 3.6 for n=36, 37, 32, and 35 cells, respectively). Scale bars = 5μm in A and C; 1μm in B and D; 10 μm in I. In the graph in J, median=black line, mean=red line. ***p<0.0005, two-tailed test.
Figure 2.
Figure 2.. TMCC protein family members localize to tubules and rescue cargo sorting.
(A) Primary structure of TMCC protein family members and predicted coiled coil (CC) domains (gray) and trans membrane (TM) domains (black). (B-D) Merged images of Cos7 cells expressing a general ER marker (mCh-Sec61β, in red) and low levels of (B) GFP-TMCC1, (C) GFP-TMCC2, or (D) GFP-TMCC3 (in green). Magnified images of 10 μm × 10 μm boxed regions reveal that compared to a general ER marker, TMCC proteins localize to dynamic domains throughout the tubular ER (box2 and movie S1) and is absent from the nuclear envelope (box 1). (E) Representative images from CI-MPR trafficking assay (as described in Figure 1) shows that re-expression of siRNA-resistant GFP-TMCC1, or family members: GFP-TMCC2 or GFP-TMCC3 rescues the cargo sorting defect caused by TMCC1 siRNA depletion. Lower images show expression of GFP vector or expression of the GFP-TMCC family member fluorescence (green) and anti-Giantin staining of the Golgi (red). (F) Graph of experiment described in (E) (GFP, average 4.5, n=23 cells; GFP-TMCC1 FL, average 3.0, n=24 cells; GFP-TMCC2, average 3.3, n=24; GFP-TMCC3, average 3.0 n=22). Median=black line, mean=red line. *p<0.05, two-tailed test. Scale bars =10 μm.
Figure 3.
Figure 3.. Dynamic TMCC1 domains accumulate at the position and timing of endosome bud fission.
(A-D) Merged images of Cos7 cells expressing BFP-Sec61β (ER in red), mCh-Rab7 (LE in blue) and low levels of (A) GFP-TMCC1, (B) GFP-TMCC1 (Δ1-570), (C) GFP-Protrudin, or (D) GFP-VAPA (green). Magnified images of the boxed regions show examples of endosome pre (t=0s) and post (t=2s) fission. White arrowheads highlight vacuolar ER-LE MCS and white arrows highlight the bud ER-LE MCS where fission occurs. (A) Note example of a GFP-TMCC1 dynamic domain (green) that accumulates at a MCS marking the site of fission (arrow). (B) In contrast, GFP-TMCC1(Δ1-570) signal (green) localizes throughout the ER and does not accumulate at the MCS with the bud. (C) Conversely, GFP-Protrudin domains (green) accumulate at vacuolar ER-LE MCS but not at the bud MCS. (D) GFP-VAPA distribution (green) resembles that of a general ER protein. (E) Cartoon diagrams how vacuolar ER-LE MCS and bud ER-LE MCS regions of interest (ROIs) were drawn on images like those shown in (A-D) in order to quantitatively analyze and graph relative protein distribution as shown in (F). (F) TMCC1, TMCC1(Δ1-570), Protrudin and VAPA enrichments quantified at each separate ROI by comparing each fluorescent signal to the general ER marker fluorescent signal in the pre fission frame of multiple fission events (n=41, n=32, n=34, and n=32 fission events respectively). (G) Quantification of TMCC1, TMCC1(Δ 1-570), Protrudin and VAPA protein signal enrichment at LE fission events described in (F) by comparing bud fission ROI to the vacuole ROI (Bud/Vacuole). TMCC1 protein gives a higher Bud/Vacuole enrichment ratio (2.07). Protrudin has a significantly lower Bud/Vacuole ratio (0.83) emphasizing more contact with the vacuole than with the bud. Mutant TMCC1 and VAPA have an equal ratio of Bud/Vacuole suggesting no MCS enrichment. Scale bars in A-D = 5 μm and 1μm in zooms. In the graphs in F-G, median=black line, mean=red line. *p<0.05, *** p<0.0005, N.S. not significant, two-tailed test.
Figure 4.
Figure 4.. TMCC1 regulates ER-associated endosome fission.
(A) Images of a live Cos-7 cell expressing BFP-KDEL (ER in green), GFP-Rab7 (LE in red), and mCh-Fam21 (sorting domain, cyan) and treated with control siRNA. (B) Magnified image from boxed region in (A) shows ER tubule co-localized with Fam21 on the endosome bud. (C) As in (A), but treated with TMCC1 siRNA. Note the ER morphology is not altered upon siRNA treatment. (D) Magnified images of boxed region in (C) shows reduced co-localization between ER tubules and Fam21. (E-F) Graphs of endosome diameter (E) and bud length (F) reveal similar endosome morphology for control versus TMCC1 siRNA treated cells (control n=47 cells, 493 buds, TMCC1 KD n=51 cells, 405 buds). (G) Graph of endosome bud fission rates reveals all bud fission is reduced following TMCC1 siRNA depletion (from 23.5% to 12.7%). (H) Graph of only Fam21 primed endosome bud fission events reveals a significantly greater reduction in fission efficiency following TMCC1 siRNA depletion (from 30.4% to 10.4% in the TMCC1 knockdown, control n=47 cells, 380 buds, TMCC1 KD n=51 cells, 340 buds). Scale bars = 5μm in A, C and 1μm in B, D. Error bars represent SEM in E-H, **p<0.005 and ***p<0.0005, N.S. not significant, two-tailed test.
Figure 5.
Figure 5.. Coronin 1C regulates ER recruitment to the bud for ER-associated fission.
The effect of CORO1C depletion on ER contact with endosome buds was scored in live Cos7cells. (A-F) Merged images from control cells (A-C) versus CORO1C siRNA-depleted cells (D-F) expressing BFP-KDEL (ER in red), GFP-Rab7 (LEs in blue), and mCh-Fam21 (sorting domain in green). (B and E) Magnified images of the regions boxed in (A and D) shows successful ER crossing with the Fam21 bud in the control cell (B) but no ER contact in the CORO1C KD cell (E) (white arrowheads). However, ER-LE vacuole MCSs are present in both the control cell and the CORO1C KD cell (yellow arrowheads). (C and F) The corresponding line-scan analysis of the relative fluorescence intensity of Rab7, ER, and Fam21 from the lines drawn in (B) and (E). The control cell line scan (C) shows a peak of fluorescence intensity for both Fam21 and ER positioned at the saddle between the endosome and the bud. The CORO1C KD cell line scan (F) reveals there is no peak of ER fluorescence coincident with the peak for Fam21 at the base of the bud. (G) Representative time-lapse images from control versus CORO1C siRNA-depleted cells were used to assess whether ER tubules maintain contact with Fam21 buds over time (white arrowheads). (H) Graph of frame by frame analysis shows a significant reduction in ER contact with the Fam21-marked bud following CORO1C depletion (78.9% in control n=20 cells, 134 buds versus 41.4% in CORO1C knockdown n=21 cells, 159 buds). (I) Graph of Fam21 primed endosome bud fission events reveals a significant reduction in fission efficiency following CORO1C siRNA depletion (from 28.0% to 11.1%; control n=20 cells, 286 buds, CORO1C knockdown n=21 cells, 316 buds). Scale bars = 5μm in A,D and 1μm in B, E, G. In the graph in H, median=black line, mean=red line. Error bars represent SEM in I, ***p<0.0005, two-tailed test.
Figure 6.
Figure 6.. TMCC1 regulates ER MCS formation with the endosome bud.
The effect of TMCC1 depletion on ER contact with endosome buds was scored in live Cos7 cells. (A-F) Merged images from control cells (A-C) versus TMCC1 siRNA-depleted cells (D-F) expressing BFP-KDEL (ER in red), mCh-Rab7 (LEs in blue), and CORO1C-GFP (green). (B and E) Magnified images of the region boxed in (A and D) shows successful ER crossing with the CORO1C punctum in the control cell (B) but no ER contact with the CORO1C punctum in the TMCC1 KD cell (E) (white arrowheads). However, ER-LE vacuole MCSs are present in both the control cell and the TMCC1 KD cell (yellow arrowheads). (C and F) The corresponding line-scan analysis of the relative fluorescence intensity of Rab7, ER, and CORO1C from the lines drawn in (B) and (E). The control cell line scan (C) shows a peak of fluorescence intensity for both CORO1C and ER positioned at the saddle between the endosome and the bud. The TMCC1 KD cell line scan (F) reveals there is no peak of ER fluorescence coincident with the peak for CORO1C at the base of the bud. (G) Representative images from 2 min time-lapse with images taken every 5 seconds of control cells and TMCC1 KD cells from A-C and D-F used to assess ER tubule tracking with CORO1C over time (white arrowheads). (H) Graph shows a significant reduction in the time ER MCS form with the CORO1C -marked bud following TMCC1 depletion (69.2% in control n=18 cells, 37 buds versus 35.2% in TMCC1 knockdown n=24 cells, 38 buds). Scale bars = 5μm in A, D and 1μm in B, E, G. In the graph in H, median=black line, mean=red line. *** p<0.0005, two-tailed test.
Figure 7.
Figure 7.. Model of ER recruitment to endosome sorting and fission factors.
Following retromer and actin mediated sorting of factors into the endosome tubules, Coronin 1C at the endosome bud is required for TMCC1-mediated ER recruitment and the interplay between Coronin 1C and TMCC1 promote fission of the endosome bud.

References

    1. Allison R, Lumb JH, Fassier C, Connell JW, Ten Martin D, Seaman MNJ, Hazan J, and Reid E (2013). An ESCRT-spastin interaction promotes fission of recycling tubules from the endosome. J. Cell Biol 202, 527–543. - PMC - PubMed
    1. Allison R, Edgar JR, Pearson G, Rizo T, Newton T, Günther S, Berner F, Hague J, Connell JW, Winkler J, et al. (2017). Defects in ER-endosome contacts impact lysosome function in hereditary spastic paraplegia. J. Cell Biol 216, 1337–1355. - PMC - PubMed
    1. Alpy F, Rousseau A, Schwab Y, Legueux F, Stoll I, Wendling C, Spiegelhalter C, Kessler P, Mathelin C, Rio M-C, et al. (2013). STARD3 or STARD3NL and VAP form a novel molecular tether between late endosomes and the ER. J. Cell Sci 126, 5500–5512. - PubMed
    1. Arighi CN, Harmell LM, Aguilar RC, Haft CR, and Bonifacino JS (2004). Role of the mammalian retromer in sorting of the cation-independent mannose 6-phosphate receptor. J. Cell Biol 165, 123–133. - PMC - PubMed
    1. Bonifacino JS, and Rojas R (2006). Retrograde transport from endosomes to the trans-Golgi network. Nat. Rev. Mol. Cell Biol 7, 568–579. - PubMed

Publication types