

Towards integrated oncogenic marker recognition through mutual information-based statistically significant feature extraction: an association rule mining based study on cancer expression and methylation profiles
- PMID: 30221015
- PMCID: PMC6135253
- DOI: 10.1007/s40484-017-0119-0
Towards integrated oncogenic marker recognition through mutual information-based statistically significant feature extraction: an association rule mining based study on cancer expression and methylation profiles
Abstract
Background: Marker detection is an important task in complex disease studies. Here we provide an association rule mining (ARM) based approach for identifying integrated markers through mutual information (MI) based statistically significant feature extraction, and apply it to acute myeloid leukemia (AML) and prostate carcinoma (PC) gene expression and methylation profiles.
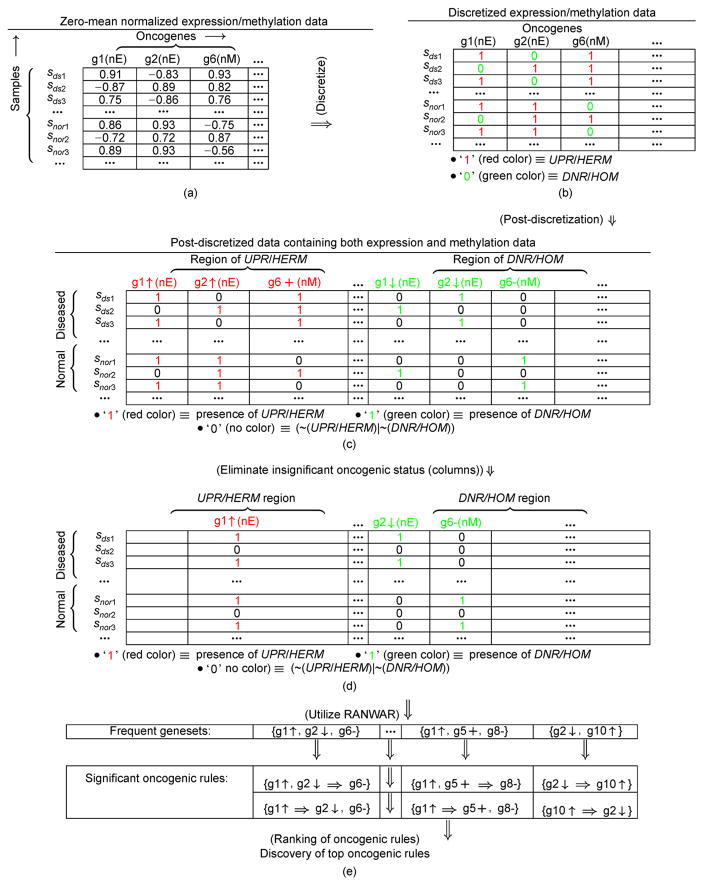
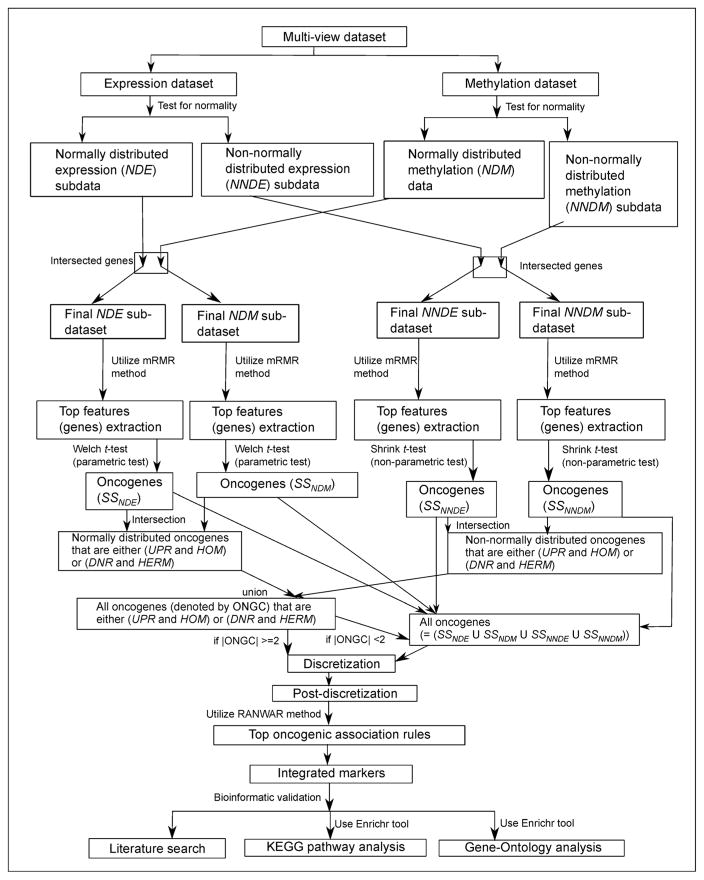
Methods: We first collect the genes having both expression and methylation values in AML as well as PC. Next, we run Jarque-Bera normality test on the expression/methylation data to divide the whole dataset into two parts: one that ollows normal distribution and the other that does not follow normal distribution. Thus, we have now four parts of the dataset: normally distributed expression data, normally distributed methylation data, non-normally distributed expression data, and non-normally distributed methylated data. A feature-extraction technique, "mRMR" is then utilized on each part. This results in a list of top-ranked genes. Next, we apply Welch t-test (parametric test) and Shrink t-test (non-parametric test) on the expression/methylation data for the top selected normally distributed genes and non-normally distributed genes, respectively. We then use a recent weighted ARM method, "RANWAR" to combine all/specific resultant genes to generate top oncogenic rules along with respective integrated markers. Finally, we perform literature search as well as KEGG pathway and Gene-Ontology (GO) analyses using Enrichr database for in silico validation of the prioritized oncogenes as the markers and labeling the markers as existing or novel.
Results: The novel markers of AML are {ABCB11↑∪KRT17↓} (i.e., ABCB11 as up-regulated, & KRT17 as down-regulated), and {AP1S1-∪KRT17↓∪NEIL2-∪DYDC1↓}) (i.e., AP1S1 and NEIL2 both as hypo-methylated, & KRT17 and DYDC1 both as down-regulated). The novel marker of PC is {UBIAD1¶∪APBA2‡∪C4orf31‡} (i.e., UBIAD1 as up-regulated and hypo-methylated, & APBA2 and C4orf31 both as down-regulated and hyper-methylated).
Conclusion: The identified novel markers might have critical roles in AML as well as PC. The approach can be applied to other complex disease.
Keywords: feature extraction; integrated markers; rule mining; statistical test.
Figures
References
-
- Renneville A, Roumier C, Biggio V, Nibourel O, Boissel N, Fenaux P, Preudhomme C. Cooperating gene mutations in acute myeloid leukemia: a review of the literature. Leukemia. 2008;22:915–931. - PubMed
-
- Opgen-Rhein R, Strimmer K. Accurate ranking of differentially expressed genes by a distribution-free shrinkage approach. Stat Appl Genet Mol Biol. 2007;6:e9. - PubMed
Grants and funding
LinkOut - more resources
Full Text Sources
Other Literature Sources
Miscellaneous