. 2018 Dec;42(6):3135-3148.
doi: 10.3892/ijmm.2018.3883. Epub 2018 Sep 17.

Aspirin promotes apoptosis and inhibits proliferation by blocking G0/G1 into S phase in rheumatoid arthritis fibroblast-like synoviocytes via downregulation of JAK/STAT3 and NF-κB signaling pathway

Affiliations

Aspirin promotes apoptosis and inhibits proliferation by blocking G0/G1 into S phase in rheumatoid arthritis fibroblast-like synoviocytes via downregulation of JAK/STAT3 and NF-κB signaling pathway

Xiaoqi Zhang et al. Int J Mol Med. 2018 Dec.

Abstract

Rheumatoid arthritis (RA) is a commonly occurring autoimmune disease. Its defining pathological characteristic is the excessive proliferation of fibroblast‑like synoviocytes (FLS), which is similar to tumor cells and results in a range of clinical problems. As a commonly used antipyretic, analgesic and anti‑inflammatory drug, aspirin is the first‑line treatment for RA. However, its mechanism of action has not been well explained. The goal is to investigate the biological effects of aspirin on primary RA‑FLS and its underlying mechanisms. In this experiment we treated cells with various concentrations of aspirin (0, DMSO, 1, 2, 5, 10 mM). Cell proliferation activity was detected with CCK‑8 assays. Apoptosis and cell cycle distribution were detected via flow cytometry. Apoptosis and cell cycle‑associated proteins (Bcl‑2, Bax, PRAP1, Cyclin D1, P21), as well as the key proteins and their phosphorylation levels of the NF‑κB and JAK/STAT3 signaling pathways, were detected via western blot analysis. Bioinformatics prediction revealed that aspirin was closely associated with cell proliferation and apoptosis, including the p53 and NF‑κB signaling pathways. By stimulating with aspirin, cell viability decreased, while the proportion of apoptotic cells increased, and the number of cells arrested in the G0/G1 phase increased in a dose‑dependent manner. The expression of Bax increased with aspirin stimulation, while the levels of Bcl‑2, PRAP1, Cyclin D1 and P21 decreased; p‑STAT3, p‑P65 and p‑50 levels also decreased while STAT3, P65, P50, p‑P105 and P105 remained unchanged. From our data, it can be concluded that aspirin is able to promote apoptosis and inhibit the proliferation of RA‑FLS through blocking the JAK/STAT3 and NF‑κB signaling pathways.


Figures
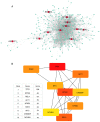
Figure 1
Figure 1
Network of drug-target genes and DPT-associated genes and their enrichment analysis. (A) DrugBank was used to find 11 primary and DPTs of aspirin (red); STRING was used to find 300 secondary DPT-interacting proteins (green); Cytoscape was used to create a PPI network of all 311 genes. (B) Cytohubba was used to find network hub genes by degree, and the top 10 hub genes are displayed (red, high score; yellow, low score). The second hub gene-UBC was not suitable as a hub gene, thus was removed. DPT, direct protein target; STRING, Search Tool for the Retrieval of Interacting Genes/Proteins; PPI, protein-protein interaction. Network of drug-target genes and DPT-associated genes and their enrichment analysis. (C) DAVID was used to analyze GO annotations (biological process) of all 311 genes. The top 12 terms were selected according to P-value. (D) The top 12 KEGG pathways enriched for all 311 genes were identified using the aforementioned method. DAVID, Database for Annotation, Visualization and Integrated Discovery; KEGG, Kyoto Encyclopedia of Genes and Genomes; GO, gene ontology.
Figure 1
Figure 1
Network of drug-target genes and DPT-associated genes and their enrichment analysis. (A) DrugBank was used to find 11 primary and DPTs of aspirin (red); STRING was used to find 300 secondary DPT-interacting proteins (green); Cytoscape was used to create a PPI network of all 311 genes. (B) Cytohubba was used to find network hub genes by degree, and the top 10 hub genes are displayed (red, high score; yellow, low score). The second hub gene-UBC was not suitable as a hub gene, thus was removed. DPT, direct protein target; STRING, Search Tool for the Retrieval of Interacting Genes/Proteins; PPI, protein-protein interaction. Network of drug-target genes and DPT-associated genes and their enrichment analysis. (C) DAVID was used to analyze GO annotations (biological process) of all 311 genes. The top 12 terms were selected according to P-value. (D) The top 12 KEGG pathways enriched for all 311 genes were identified using the aforementioned method. DAVID, Database for Annotation, Visualization and Integrated Discovery; KEGG, Kyoto Encyclopedia of Genes and Genomes; GO, gene ontology.
Figure 2
Figure 2
The CCK-8 assay results are presented as bar graphs for the antiproliferative effects of aspirin on RA-FLS. (A-C) RA-FLS were treated with (0, DMSO, 1, 2, 5 and 10 mM) aspirin for 12, 24 and 48 h. At each time interval, cell viability was determined by CCK-8 analysis. Data are presented as the means ± SD (error bars) from three independent experiments. Aspirin inhibited the growth of RA-FLS in a dose-dependent manner. (D) Cell proliferation decreased at 12, 24 and 48 h. Data are presented as the means ± SD (error bars) from three independent experiments. *P<0.05, **P<0.01, ***P<0.001 vs. DMSO group. CCK-8: Cell-Counting Kit-8; RA-FLS, rheumatoid arthritis-fibroblast-like synoviocytes; DMSO, dimethyl sulfoxide; SD, standard deviation.
Figure 3
Figure 3
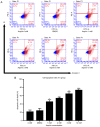
Aspirin induces apoptosis of RA-FLS. (A) Cells were exposed to various concentrations of aspirin for 24 h, and then harvested for apoptosis analysis via flow cytometry and Annexin V-FITC/PI assay. The figures show the apoptosis of RA-FLS induced by aspirin. (B) Bar graph showing the rates of RA-FLS apoptosis induced by various concentrations of aspirin for 24 h; this increased with higher concentrations of aspirin, thus is concentration-dependent. Data are presented as the means ± SD (error bars) from three independent experiments. **P<0.01, ***P<0.001 vs. DMSO group; FITC, fluorescein isothiocyanate; PI, propidium iodide; DMSO, dimethyl sulfoxide; RA-FLS, rheumatoid arthritis-fibroblast-like synoviocytes.
Figure 4
Figure 4
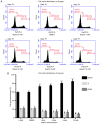
Graphs showing the effects of aspirin on cell cycle distribution in RA-FLS. (A) RA-FLS were treated with aspirin at various concentrations (0, DMSO; 1, 2, 5 and 10 mM) and the cell cycle distribution was detected by flow cytometry after 24 h. (B) Percentages of cells in the different phases are shown in the bar graph. With increased aspirin concentration, the number of cells in the G0/G1 phase increased while those in the S phase decreased. Aspirin blocks cells in the G0/G1 phase to prohibit progression into the S phase. Data are presented as the means ± SD (error bars) from three independent experiments. *P<0.05, **P<0.01, ***P<0.001 vs. DMSO group. DMSO, dimethyl sulfoxide; RA-FLS, rheumatoid arthritis-fibroblast-like synoviocytes.
Figure 5
Figure 5
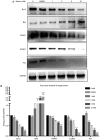
Effects of aspirin on Bcl-2, BAX, PARP1, Cyclin D1 and P21 expression in RA-FLS. (A) After RA-FLS were exposed to various concentration of aspirin for 24 h, western blotting was used to determine Bcl-2, BAX, PARP1, Cyclin D1 and P21 protein levels. The corresponding internal control was GADPH. Changes in Bcl-2, BAX, PARP1, Cyclin D1 and P21 protein expression in RA-FLS treated with aspirin are shown: Bcl-2, PARP1, Cyclin D1 and P21 were decreased while BAX was increased, each with increasing aspirin concentration. (B) Bar graph shows the gray value analysis of Bcl-2, BAX, PARP1, Cyclin D1 and P21. Data are presented as the means ± SD (error bars) from three independent experiments. *P<0.05, **P<0.01, ***P<0.001, ****P<0.0001 vs. DMSO group. We set the value as target protein vs. GAPDH, and set the value of control group as 1. CCND1, Cyclin D1; RA-FLS, rheumatoid arthritis-fibroblast-like synoviocytes; Bcl-2, B-cell lymphoma-2; BAX, Bcl-2-associated X protein; PARP1, poly (ADP-ribose) polymerase 1.
Figure 6
Figure 6
Effects of aspirin on the NF-κB signaling pathway. It was observed that aspirin significantly affects the phosphorylation levels of P65 and P50. (A) Cells were treated with various concentrations of aspirin for 24 h, and then whole cell lysates were obtained and subjected to western blotting to detect p-P65, P65, p-P50, P50, p-P105 and P105. GAPDH served as the loading control. The levels of p-P65 and p-P50 decreased, whilst P65, P50, p-P105 and P105 remained the same. Phosphorylation of P65 and P50 was inhibited to varying degrees by aspirin. (B) Bar graph shows p-P65, P65, p-P50, P50, p-P105 and P105 protein expression, which was analyzed relative to GAPDH expression by densitometry. Data are presented as the means ± SD (error bars) from three independent experiments. *P<0.05, **P<0.01, ***P<0.001, ****P<0.0001 vs. the DMSO group. We set the value as target protein vs. GAPDH, and set the value of control group as 1. RA-FLS, rheumatoid arthritis-fibroblast-like synoviocytes; NF-κB, nuclear transcription factor-κB; DMSO, dimethyl sulfoxide; p-, phosphorylated.
Figure 7
Figure 7
Effects of aspirin on the JAK/STAT3 signaling pathway. Aspirin significantly affects the phosphorylation level of STAT3. (A) Cells were treated with various concentrations of aspirin for 24 h, after which whole cell lysates were obtained and subjected to western blotting to detect p-STAT3 and STAT3. GAPDH served as the loading control. Results showed a decrease in p-STAT3, whilst STAT3 remained unchanged. Phosphorylation of STAT3 was inhibited to varying degrees by aspirin. (B) Bar graph represents the expression of p-PSTAT3 and STAT3, which were analyzed relative to GAPDH expression by densitometry. Data are presented as the means ± SD (error bars) from three independent experiments. *P<0.05, **P<0.01, ***P<0.001, ****P<0.0001 vs. DMSO group. We set the value as target protein vs. GAPDH and set the value of control group as 1. RA-FLS, rheumatoid arthritis-fibroblast-like synoviocytes; STAT3, signal transducer and activator of transcription 3; DMSO, dimethyl sulfoxide; p-, phosphorylated.

Similar articles

Cited by

References

    1. Cooles FA, Isaacs JD. Pathophysiology of rheumatoid arthritis. Curr Opin Rheumatol. 2011;23:233–240. doi: 10.1097/BOR.0b013e32834518a3. - DOI - PubMed
    1. Müller-Ladner U, Pap T. Pathogenesis of RA: More than just immune cells. Z Rheumatol. 2005;64:396–401. doi: 10.1007/s00393-005-0772-y. In German. - DOI - PubMed
    1. Pope RM. Apoptosis as a therapeutic tool in rheumatoid arthritis. Nat Rev Immunol. 2002;2:527–535. doi: 10.1038/nri846. - DOI - PubMed
    1. Vane JR, Botting RM. The mechanism of action of aspirin. Thromb Res. 2003;110:255–258. doi: 10.1016/S0049-3848(03)00379-7. - DOI - PubMed
    1. Yao RS, Rioux N, Castonguay A, You M. Inhibition of COX-2 and induction of apoptosis: Two determinants of nonsteroidal anti-inflammatory drugs’ chemopreventive efficacies in mouse lung tumorigenesis. Exp Lung Res. 2000;26:731–742. doi: 10.1080/01902140150216783. - DOI - PubMed

MeSH terms