. 2018 Nov;285(22):4165-4180.
doi: 10.1111/febs.14660. Epub 2018 Oct 1.

The structure of INI1/hSNF5 RPT1 and its interactions with the c-MYC:MAX heterodimer provide insights into the interplay between MYC and the SWI/SNF chromatin remodeling complex

Affiliations

The structure of INI1/hSNF5 RPT1 and its interactions with the c-MYC:MAX heterodimer provide insights into the interplay between MYC and the SWI/SNF chromatin remodeling complex

Susan Sammak et al. FEBS J. 2018 Nov.

Abstract

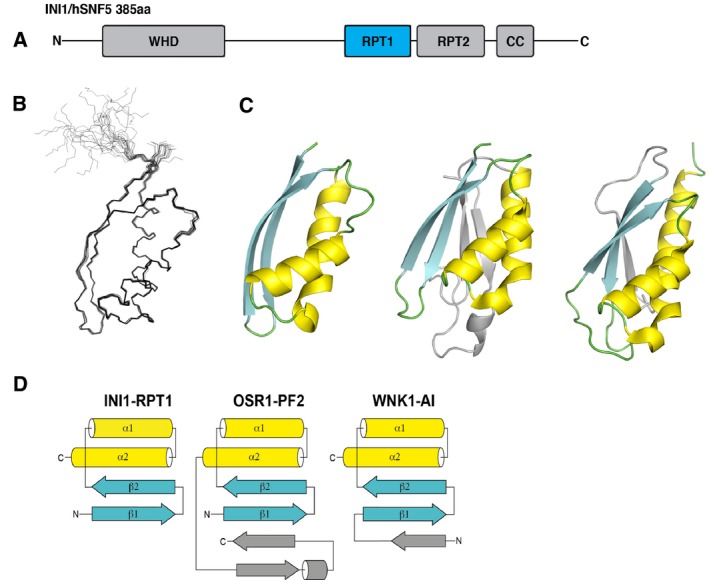
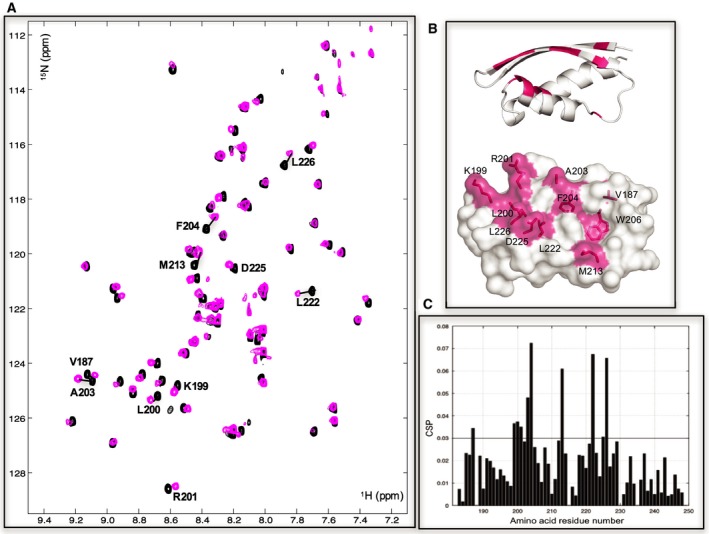
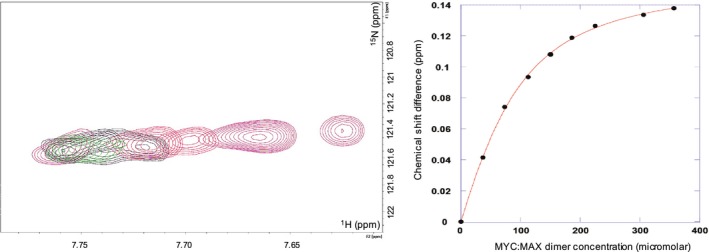
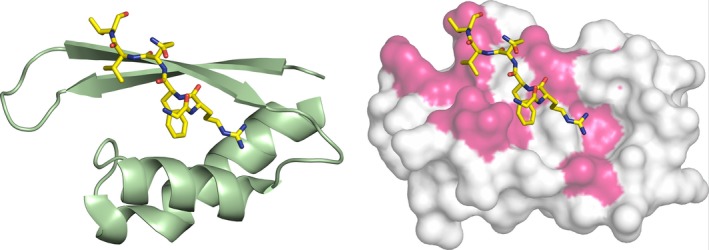
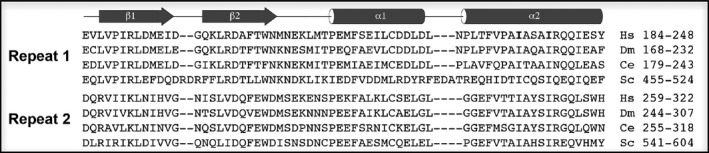
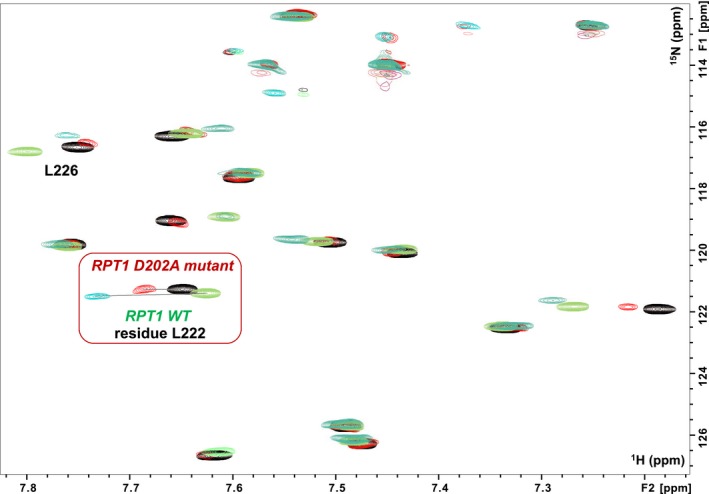
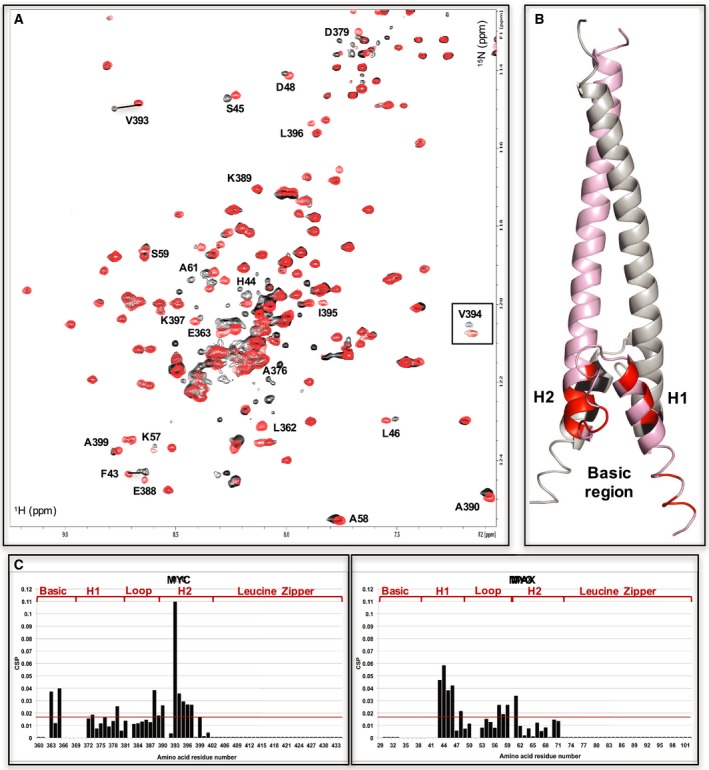
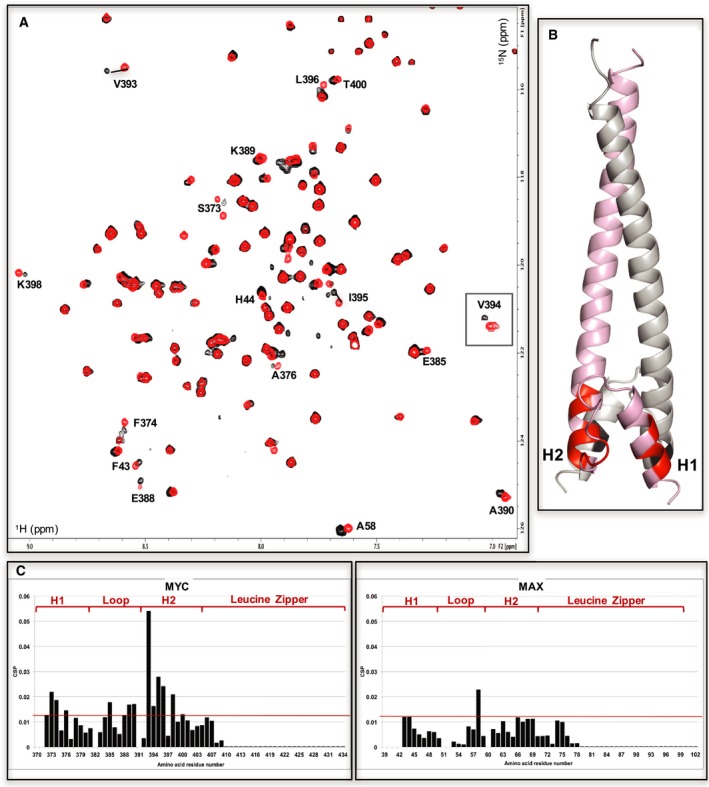
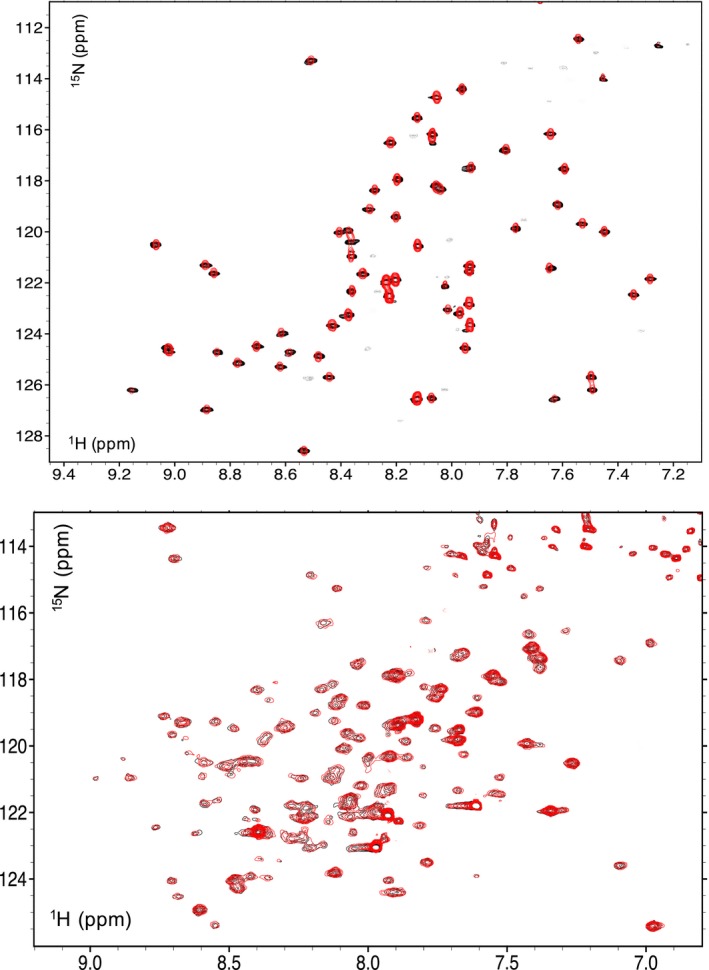
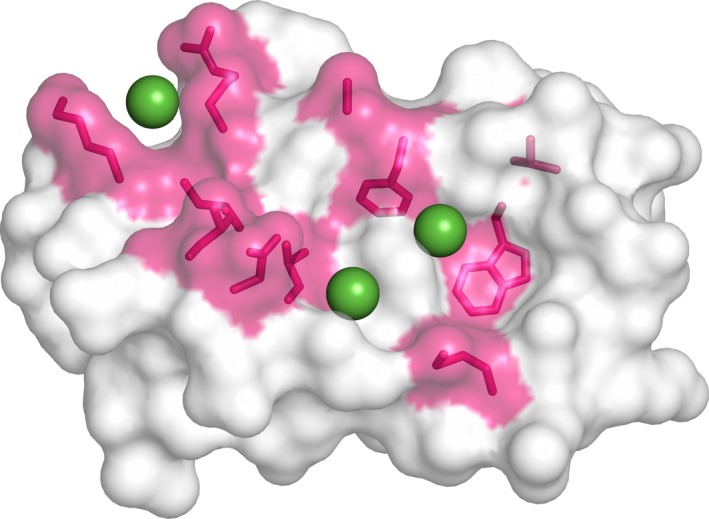
c-MYC and the SWI/SNF chromatin remodeling complex act as master regulators of transcription, and play a key role in human cancer. Although they are known to interact, the molecular details of their interaction are lacking. We have determined the structure of the RPT1 region of the INI1/hSNF5/BAF47/SMARCB1 subunit of the SWI/SNF complex that acts as a c-MYC-binding domain, and have localized the interaction regions on both INI1 and on the c-MYC:MAX heterodimer. c-MYC interacts with a highly conserved groove on INI1, while INI1 binds to the c-MYC helix-loop-helix region. The binding site overlaps with the c-MYC DNA-binding region, and we show that binding of INI1 and E-box DNA to c-MYC:MAX are mutually exclusive.

Keywords: MYC; BAF/PBAF complexes; INI1/hSNF5/BAF47/SMARCB1 subunit; protein-protein interactions; transcription factors.


Conflict of interest statement

The authors declare that they have no conflict of interest.

Figures

Figure 1
Figure 1
Structure of INI1/hSNF5 RPT1. (A) Representation of the domain structure of INI1. (B) Overlay of the 20 lowest energy NMR structures of RPT1. (C) From left to right: cartoon representations of the X‐ray structure of RPT1, and the structures of the OSR1 CCT domain and the autoinhibitory domain of WNK1 (WNK1‐AI). (D) Schematic of the topologies of the INI1/hSNF5 RPT1, OSR1 CCT, and WNK1‐AI domains.
Figure 2
Figure 2
The MYC:MAX bHLHZip dimer binds to a conserved pocket on INI1/hSNF5 RPT1. (A) 1H,15N HSQC spectra of RPT1 without (black) and with (magenta) the addition of unlabeled MYC:MAX bHLHZip dimer (ratio 1 : 2). Residues undergoing chemical shift changes more than the standard deviation (SD) are labeled in black. (B) Cartoon (top) and molecular surface representation (bottom) of RPT1 showing the residues that undergo chemical shift changes more than the standard deviation are highlighted in magenta and labeled. The chemical shift changes of W206 are for the aromatic proton of the side chain (changes in chemical shifts of the backbone are below the threshold). (C) Diagram showing the differences in chemical shifts induced by binding of the MYC:MAX dimer to the 15N‐labeled INI1 RPT1. The black line indicates the calculated standard deviation.
Figure 3
Figure 3
K d determination of the binding of the MYC:MAX dimer to the INI1/hSNF5 RPT1. On the left overlay of 15N HSQC spectra showing the variation of chemical shift changes induced on L222 by the addition of the unlabeled MYC:MAX dimer. The peak moves from right to left with increasing concentration of the dimer; on the right, plot of the induced chemical shifts versus dimer concentration, fitted to a single‐site binding curve. INI1 RPT1 was employed at a concentration of 147 μm.
Figure 4
Figure 4
Comparison of the binding site in INI1/hSNF5 RPT1 and OSR1. On the left cartoon representation of the structure of the OSR1 CCT domain (green) in complex with the RFQV‐peptide (yellow). On the right superimposition of the OSR1 CCT domain (not shown) complex with the RFQV‐peptide (yellow) with the RPT1 structure shown as a molecular surface, with the residues that change chemical shifts upon binding to the MYC:MAX complex highlighted in magenta.
Figure 5
Figure 5
Sequence alignments of the repeats of family members of the INI1/SNF5. At the top, carton representation of the secondary structure elements of RPT1, followed by sequence alignments of RPT1 (middle) and RPT2 (bottom) for the Homo sapiens (Hs), Drosophila melanogaster (Dm), Caenorhabditis elegans (Ce) and Saccharomyces cerevisiae (Sc) proteins.
Figure 6
Figure 6
Binding of the MYC:MAX dimer to the INI1 D202A‐mutant. Overlay of a region of the 1H,15N HSQC spectra of RPT1 INI1 WT without (blue gray) and with (green) unlabeled MYC:MAX bHLHZip dimer (ratio 1 : 1), overlaid with the overlay of the same region of the 1H,15N HSQC spectra of RPT1 INI1 D202A‐mutant without (black) and with (red) unlabeled MYC:MAX bHLHZip dimer (ratio 1 : 1). Highlighted in the red square is the residue L222 which undergoes the largest change in chemical shift upon binding of MYC:MAX complex to both INI1 RPT1 WT and the D202A mutant. Comparison of the same ratio (1 : 1) illustrates the lower affinity of the DA mutant as the change in chemical shift of L222 is significantly less.
Figure 7
Figure 7
INI1/hSNF5 RPT1 binds to the helix‐loop‐helix region of MYC in the MYC:MAX bHLHZip dimer. (A) 1H,15N BST TROSY spectra of 15N‐labeled MYC:MAX bHLHZip dimer without (red) and with (black, ration 1 : 1) binding to RPT1 that move more than the standard deviation are labeled. The region corresponding to residue V394 is inserted in the spectra in a box to better illustrate the changes of chemical shifts that occur upon binding to INI1. (B) Cartoon representation of the MYC:MAX dimer (PDB =  1NKP, pink: MYC, gray: MAX) with highlighted in red (MYC) and black (MAX) the residues labeled in the spectra. H1 = MYC Helix 1; H2 = MYC Helix 2. (C) Diagrams showing the differences in chemical shifts induced by binding of RPT1 to the 15N‐labeled MYC:MAX dimer (MYC on the left, MAX on the right). Residues 29, 34–42, 52, 60, from MAX, and residues 366–71 from MYC are not assigned. L362 is assigned in the free form, but it could not be assigned in the bound form. Residues 51, 382, 391 are prolines. The red line indicates the standard deviation. H1 = MYC Helix 1; H2 = MYC Helix 2.
Figure 8
Figure 8
INI1/hSNF5 RPT1 binds to the helix‐loop‐helix region of MYC in the MYC:MAX dimer lacking the basic region. (A) 1H,15N BST TROSY spectra of 15N‐labeled MYC:MAX HLHZip dimer without (red) and with (black, ration 1 : 2) the addition of unlabeled RPT1 (residue 394 is inserted into the spectra as in Fig. 7). Residues implicated in the binding to RPT1 that move more than the standard deviation are labeled. (B) Cartoon representation of the MYC:MAX dimer (pink: MYC, gray: MAX) with highlighted in red (MYC) and black (MAX) the residues labeled in the spectra. H1 = MYC Helix 1; H2 = MYC Helix 2. (C) Diagrams showing the differences in chemical shifts induced by binding of RPT1 to the 15N‐labeled MYC:MAX dimer (MYC on the left, MAX on the right). Residues 39–42, 52, 370–71 are not assigned. Residues 51, 382, 391 are prolines. The red line indicates the standard deviation. H1 = MYC Helix 1; H2 = MYC Helix 2.
Figure 9
Figure 9
Binding of INI1/hSNF5 RPT1 and DNA to the MYC:MAX bHLHZip dimer are mutually exclusive. Top: overlay of 1H,15N HSQC spectra of RPT1 without (black) and with (red, ratio 1 : 1) unlabeled MYC:MAX bHLHZip dimer bound to DNA. Bottom: overlay 1H,15N BST TROSY spectra of 15N‐labeled MYC:MAX bHLHZip dimer bound to DNA without (black) and with (red, ratio 1 : 1) unlabeled RPT1 INI1. In both spectra, no chemical shift changes are observed, illustrating that INI1 RPT1 does not bind to the MYC:MAX dimer when this is bound to E‐box DNA.
Figure 10
Figure 10
Potential small‐molecule binding pockets in INI1/hSNF5 RPT1. Molecular surface representation of INI1/hSNF5 RPT1 showing the residues that undergo chemical shift more than standard deviation highlighted in magenta, and in green spheres representing three potential small‐molecule binding pockets that were identified by the LIGSITE program.

Similar articles

Cited by

References

    1. Morton JP & Sansom OJ (2013) MYC‐y mice: from tumour initiation to therapeutic targeting of endogenous MYC. Mol Oncol 7, 248–258. - PMC - PubMed
    1. Soucek L, Whitfield J, Martins CP, Finch AJ, Murphy DJ, Sodir NM, Karnezis AN, Swigart LB, Nasi S & Evan GI (2008) Modelling Myc inhibition as a cancer therapy. Nature 455, 679–683. - PMC - PubMed
    1. Zinzalla G (2016) Targeting MYC: is it getting any easier? Future Med Chem 8, 1899–1902. - PubMed
    1. McKeown MR and Bradner JE (2014) Therapeutic strategies to inhibit MYC. Cold Spring Harb Perspect Med 4, a014266. - PMC - PubMed
    1. Wolfram JA, Lesnefsky EJ, Hoit BD, Smith MA & Lee H‐G (2011) Therapeutic potential of c‐Myc inhibition in the treatment of hypertrophic cardiomyopathy. Ther Adv Chronic Dis 2, 133–144. - PMC - PubMed

MeSH terms

Substances