

Transient Otoacoustic Emissions and Auditory Brainstem Responses in Low-Risk Cohort of Newborn and One-Month-Old Infants: Assessment of Infant Auditory System Physiology in the Prenatal Alcohol in SIDS and Stillbirth Network Safe Passage Study
- PMID: 30222544
- PMCID: PMC8252127
- DOI: 10.3766/jaaa.17043
Transient Otoacoustic Emissions and Auditory Brainstem Responses in Low-Risk Cohort of Newborn and One-Month-Old Infants: Assessment of Infant Auditory System Physiology in the Prenatal Alcohol in SIDS and Stillbirth Network Safe Passage Study
Abstract
Background: The Prenatal Alcohol and Sudden Infant Death Syndrome and Stillbirth Network, known as the "Safe Passage Study," enrolled approximately 12,000 pregnant women from the United States and South Africa and followed the development of their babies through pregnancy and the infant's first year of life to investigate the role of prenatal alcohol exposure in the risk for sudden infant death syndrome (SIDS) and adverse pregnancy outcomes, such as stillbirth and fetal alcohol spectrum disorders.
Purpose: Auditory system tests were included in the physiologic test battery used to study the effects of prenatal alcohol exposure on neurophysiology and neurodevelopment, as well as potential causal relationships between neurodevelopmental disorders and SIDS and/or stillbirth. The purpose of this manuscript is to describe normative results when using the auditory test battery applied.
Research design: The test battery included the auditory brainstem response (ABR) and transient-evoked otoacoustic emissions (TEOAEs). Data were collected on individual ears of newborns and 1-month-old infants.
Study sample: From a cohort of 6,070 with auditory system exams, a normative subsample of 325 infants were selected who were not exposed prenatally to alcohol, cigarette smoke, or drugs nor were they preterm or low birthweight. The subsample is small relative to the overall study because of strict criteria for no exposure to substances known to be associated with SIDS or stillbirth and the exclusion of preterm and low birthweight infants. Expectant mothers were recruited from general maternity at two comprehensive clinical sites, in the northern plains in the United States and in Cape Town, South Africa. These populations were selected for study because both were known to be at high-risk for SIDS and stillbirth.
Data collection and analysis: ABR and TEOAE recordings were stored electronically. Peak latency and amplitude analysis of ABRs were determined by study personnel, and results were evaluated for differences by age, sex, test site, race, and ear (left versus right).
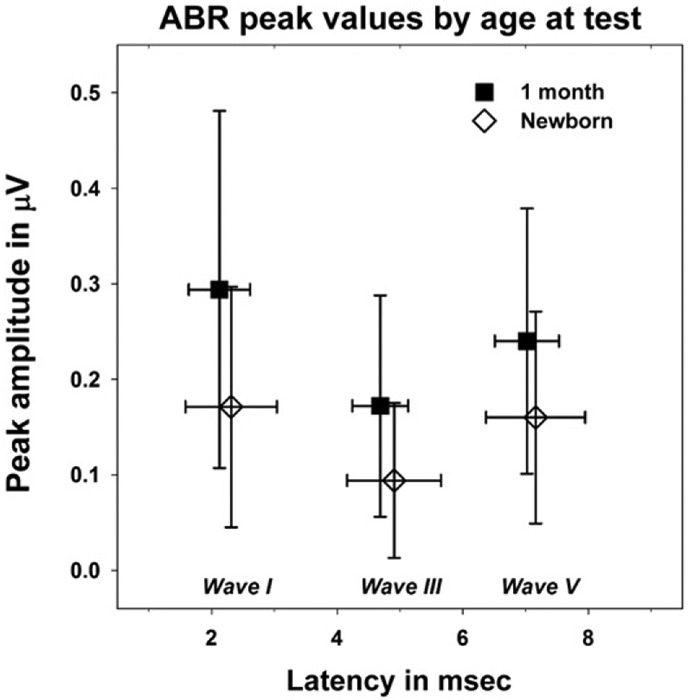
Results: TEOAE findings were consistent with existing literature including the increase in signal-to-noise (SNR) over the first month of life. The SNR increase is due to an increase in amplitude of the emission. TEOAE amplitude asymmetry favoring the right ear was found, whereas SNR asymmetry was not, perhaps because of the small sample size. A nonsignificant trend toward larger responses in female babies was found; a result that is generally statistically significant in studies with larger samples. Latencies were found to be shorter in ABRs elicited in the right ear with amplitudes that were slightly bigger on average. An expected decrease in wave V latency was observed from birth to 1-month of age, but the finding was of borderline significance (p = 0.058).
Conclusions: One month is a short time to judge development of the auditory system; however, the ABR and TEOAE findings were consistent with current literature. We conclude that the auditory system data acquired for the Safe Passage Study, as reflected in the data obtained from this cohort of "unexposed" infants, is consistent with published reports of these auditory system measures in the general population.
American Academy of Audiology.
Figures


Similar articles
-
Prenatal Exposure to Tobacco and Alcohol Alters Development of the Neonatal Auditory System.Dev Neurosci. 2021;43(6):358-375. doi: 10.1159/000518130. Epub 2021 Jul 19. Dev Neurosci. 2021. PMID: 34348289
-
Transient evoked otoacoustic emissions: feasibility in the nursery.Ear Hear. 1996 Feb;17(1):42-8. doi: 10.1097/00003446-199602000-00005. Ear Hear. 1996. PMID: 8741966
-
Relationships between otoacoustic emissions and auditory brainstem responses in neonates and young children: a correlation and factor analytical study.Laryngoscope. 2002 Jan;112(1):156-67. doi: 10.1097/00005537-200201000-00028. Laryngoscope. 2002. PMID: 11802056
-
Association of Audiometric Measures with plasma long chain polyunsaturated fatty acids in a high-fish eating population: The Seychelles Child Development Study.Neurotoxicology. 2020 Mar;77:137-144. doi: 10.1016/j.neuro.2020.01.005. Epub 2020 Jan 23. Neurotoxicology. 2020. PMID: 31982419 Free PMC article. Review.
-
Neonatal Monitoring: Prediction of Autonomic Regulation at 1 Month from Newborn Assessments.In: Duncan JR, Byard RW, editors. SIDS Sudden Infant and Early Childhood Death: The Past, the Present and the Future. Adelaide (AU): University of Adelaide Press; 2018 May. Chapter 21. In: Duncan JR, Byard RW, editors. SIDS Sudden Infant and Early Childhood Death: The Past, the Present and the Future. Adelaide (AU): University of Adelaide Press; 2018 May. Chapter 21. PMID: 30035942 Free Books & Documents. Review.
Cited by
-
Sudden infant death syndrome (SIDS) and the routine otoacoustic emission infant hearing screening test: an epidemiological retrospective case-control study.BMJ Open. 2019 Jul 18;9(7):e030026. doi: 10.1136/bmjopen-2019-030026. BMJ Open. 2019. PMID: 31324686 Free PMC article.
References
-
- Aidan D, Lestang P, Avan P, Bonfils P. (1997) Characteristics of transient-evoked otoacoustic emissions (TEOES) in neonates. Acta Otolaryngol 117(1):25–30. - PubMed
-
- Backus BC. (2007) Bias due to noise in otoacoustic emission measurements. J Acoust Soc Am 121(3):1588–1603. - PubMed
-
- Berninger E. (2007) Characteristics of normal newborn transient-evoked otoacoustic emissions: ear asymmetries and sex effects. Int J Audiol 46(11):661–669. - PubMed
Publication types
MeSH terms
Grants and funding
LinkOut - more resources
Full Text Sources
Other Literature Sources
