

Morphology of mitochondria in spatially restricted axons revealed by cryo-electron tomography
- PMID: 30222729
- PMCID: PMC6160218
- DOI: 10.1371/journal.pbio.2006169
Morphology of mitochondria in spatially restricted axons revealed by cryo-electron tomography
Abstract
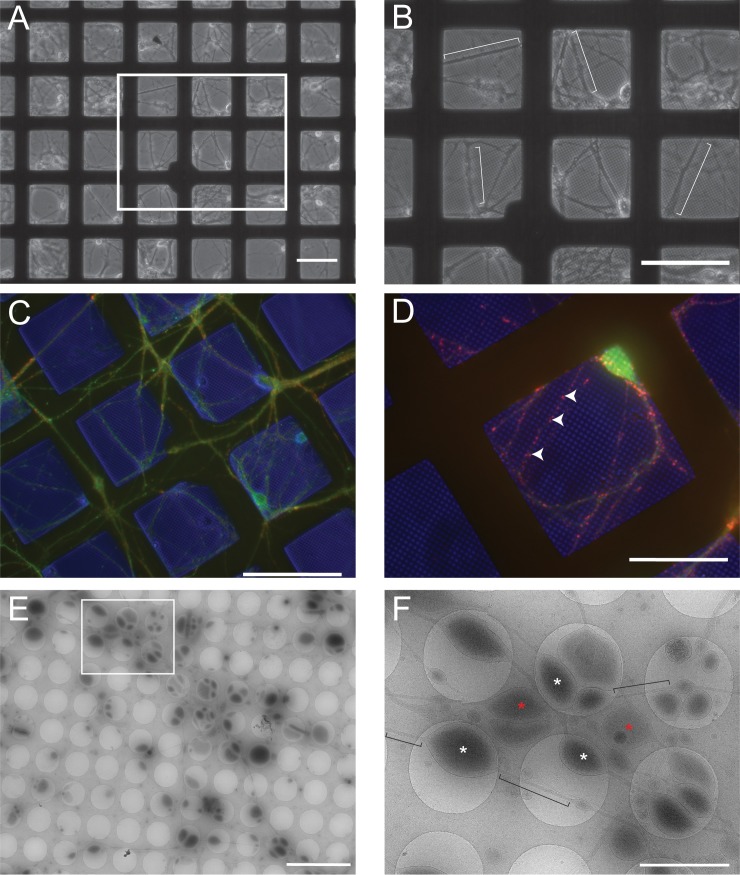
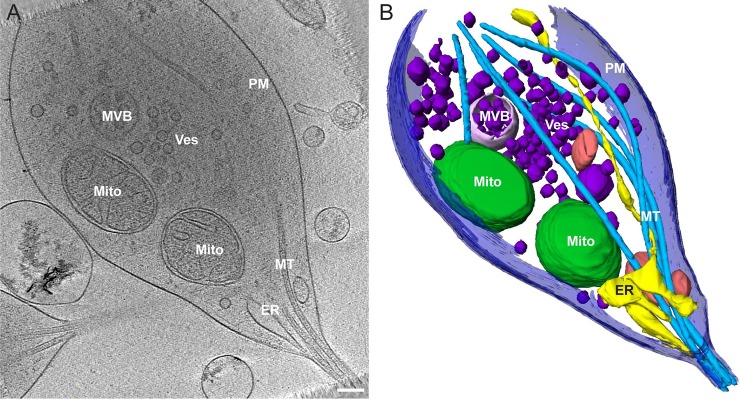
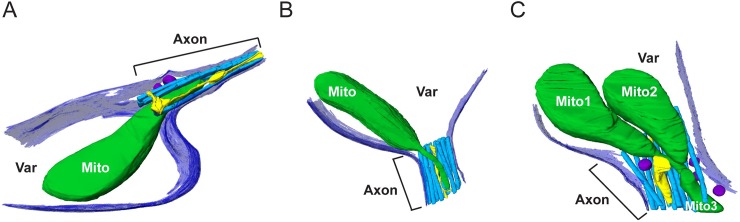
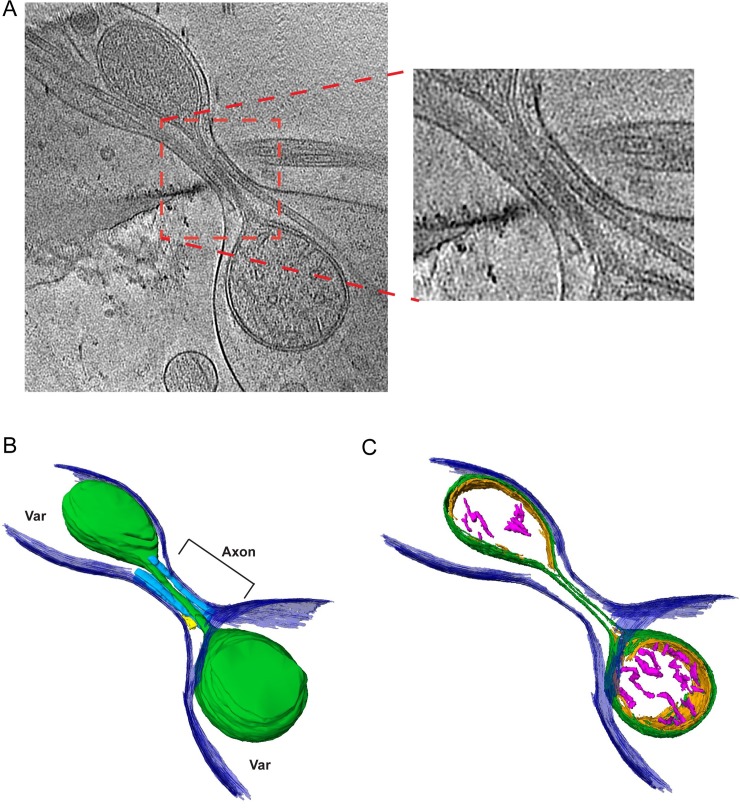
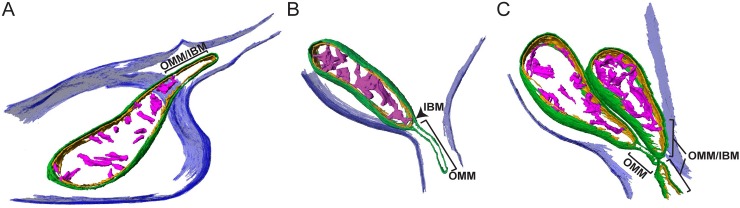
Neurons project axons to local and distal sites and can display heterogeneous morphologies with limited physical dimensions that may influence the structure of large organelles such as mitochondria. Using cryo-electron tomography (cryo-ET), we characterized native environments within axons and presynaptic varicosities to examine whether spatial restrictions within these compartments influence the morphology of mitochondria. Segmented tomographic reconstructions revealed distinctive morphological characteristics of mitochondria residing at the narrowed boundary between presynaptic varicosities and axons with limited physical dimensions (approximately 80 nm), compared to mitochondria in nonspatially restricted environments. Furthermore, segmentation of the tomograms revealed discrete organizations between the inner and outer membranes, suggesting possible independent remodeling of each membrane in mitochondria at spatially restricted axonal/varicosity boundaries. Thus, cryo-ET of mitochondria within axonal subcompartments reveals that spatial restrictions do not obstruct mitochondria from residing within them, but limited available space can influence their gross morphology and the organization of the inner and outer membranes. These findings offer new perspectives on the influence of physical and spatial characteristics of cellular environments on mitochondrial morphology and highlight the potential for remarkable structural plasticity of mitochondria to adapt to spatial restrictions within axons.
Conflict of interest statement
The authors have declared that no competing interests exist.
Figures
Similar articles
-
Quantifying organellar ultrastructure in cryo-electron tomography using a surface morphometrics pipeline.J Cell Biol. 2023 Apr 3;222(4):e202204093. doi: 10.1083/jcb.202204093. Epub 2023 Feb 14. J Cell Biol. 2023. PMID: 36786771 Free PMC article.
-
Topological reorganizations of mitochondria isolated from rat brain after 72 hours of paradoxical sleep deprivation, revealed by electron cryo-tomography.Am J Physiol Cell Physiol. 2021 Jul 1;321(1):C17-C25. doi: 10.1152/ajpcell.00077.2021. Epub 2021 May 12. Am J Physiol Cell Physiol. 2021. PMID: 33979213
-
Snapshots of mitochondrial fission imaged by cryo-scanning transmission electron tomography.J Cell Sci. 2025 May 1;138(9):jcs263639. doi: 10.1242/jcs.263639. Epub 2025 May 14. J Cell Sci. 2025. PMID: 40365741
-
Cryo-electron tomography for the structural study of mitochondrial translation.Tissue Cell. 2019 Apr;57:129-138. doi: 10.1016/j.tice.2018.08.009. Epub 2018 Aug 29. Tissue Cell. 2019. PMID: 30197222 Review.
-
Insights into the molecular organization of the neuron by cryo-electron tomography.J Electron Microsc (Tokyo). 2011;60 Suppl 1:S137-48. doi: 10.1093/jmicro/dfr018. J Electron Microsc (Tokyo). 2011. PMID: 21844585 Review.
Cited by
-
Novel phospho-switch function of delta-catenin in dendrite development.J Cell Biol. 2020 Nov 2;219(11):e201909166. doi: 10.1083/jcb.201909166. J Cell Biol. 2020. PMID: 33007084 Free PMC article.
-
Crowd Control: Effects of Physical Crowding on Cargo Movement in Healthy and Diseased Neurons.Front Cell Neurosci. 2019 Oct 25;13:470. doi: 10.3389/fncel.2019.00470. eCollection 2019. Front Cell Neurosci. 2019. PMID: 31708745 Free PMC article. Review.
-
Visualizing lipid membrane structure with cryo-EM: past, present, and future.Emerg Top Life Sci. 2023 Mar 31;7(1):55-65. doi: 10.1042/ETLS20220090. Emerg Top Life Sci. 2023. PMID: 36606590 Free PMC article. Review.
-
Enhanced presynaptic mitochondrial energy production is required for memory formation.Sci Rep. 2023 Sep 2;13(1):14431. doi: 10.1038/s41598-023-40877-0. Sci Rep. 2023. PMID: 37660191 Free PMC article.
-
Membrane fission via transmembrane contact.Nat Commun. 2024 Mar 30;15(1):2793. doi: 10.1038/s41467-024-47122-w. Nat Commun. 2024. PMID: 38555357 Free PMC article.
References
-
- Westrum LE, Blackstad TW. An electron microscopic study of the stratum radiatum of the rat hippocampus (regio superior, CA 1) with particular emphasis on synaptology. J Comp Neurol. 1962;119:281–309. . - PubMed
Publication types
MeSH terms
Grants and funding
LinkOut - more resources
Full Text Sources
Other Literature Sources
